


 |
市场调查报告书
商品编码
1940568
资料中心交换器:市场占有率分析、产业趋势与统计、成长预测(2026-2031)Data Center Switch - Market Share Analysis, Industry Trends & Statistics, Growth Forecasts (2026 - 2031) |
||||||
※ 本网页内容可能与最新版本有所差异。详细情况请与我们联繫。
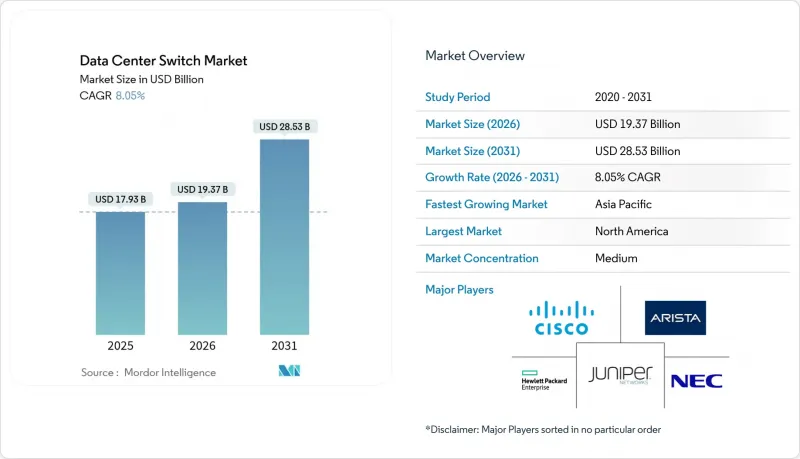
2025年资料中心交换器市值为179.3亿美元,预计到2031年将达到285.3亿美元,高于2026年的193.7亿美元。
预计在预测期(2026-2031 年)内,复合年增长率将达到 8.05%。
人工智慧训练丛集的日益普及、云端原生工作负载的稳定成长以及超大规模园区的快速扩张,持续推动着对高频宽交换基础设施的资本投资。从三层架构到叶脊式架构的转变,使网路拓扑结构趋于扁平化,从而实现了低延迟和可预测的平行处理效能。乙太网路晶片的创新使得每个装置的连接埠密度超过 51.2 Tbps,降低了每Gigabit的功耗,并促进了 400G 和 800G光学模组的普及。资料居住的监管要求推动了区域容量的成长,而边缘设施的扩展则催生了对紧凑型、可远端系统管理且面积有限的交换机的额外需求。随着垂直整合的供应商将晶片、光学模组和软体捆绑销售,以缩短引进週期并简化操作,市场竞争日益激烈。
全球资料中心交换器市场趋势与洞察
云端运算和边缘运算工作负载正在爆炸式增长
处理 5G、物联网和即时分析工作负载的边缘站点数量激增,推动了对可在空间受限机架中运行的紧凑型高吞吐量交换机的需求。超大规模资料中心业者目前正在设计区域边缘节点,以向消费级应用提供低于 10 毫秒的延迟,这使得交换器硬体需要在恶劣且通常无人值守的环境中运行。可程式传输平面允许业者在城域边缘和核心园区之间动态地引导流量,而无需手动重新布线。基于硬体的、时间敏感型网路功能也有助于支援需要确定性延迟的工业机器人和自动驾驶车辆。随着边缘面积的扩大,多租用户託管服务供应商正在增加冗余存取层,从而扩大低功耗交换器的潜在市场规模。
需要高频宽交换的AI/ML训练丛集
训练大规模语言模型产生的东向流量是标准资料中心流量模式的 24 到 32 倍。超大规模营运商正在部署 102.4 Tbps 的 ASIC 晶片,这些晶片能够维护 GPU 之间的单跳路径,并采用拥塞控制演算法来确保近乎零丢包率。供应商正在试验链路级遥测技术,以预测微突发流量并在微秒内重新路由资料流。初步现场试验表明,在同一网路架构中用 400G 链路替换 100G 链路后,模型训练时间缩短了 1.6 倍。由于 GPU 利用率的提高,这种效能提升转化为数百万美元的成本节约,进一步强化了部署高速交换器的商业价值。
下一代交换器升级需要高额的资本支出(CAPEX)和营运支出(OPEX)。
从 10G 或 40G 升级到 400G 不仅需要新的交换机,还需要高等级的光纤、更大的功率和更先进的冷却系统,这使得企业级网路建设的总计划从 1000 万美元飙升至 5 亿美元。由于许多中型企业推迟了网路升级,转而从託管服务提供商处租赁容量,交换机的直接销售速度有所放缓。随着连接埠速度的提升,电力消耗也随之增加,持续营运成本也随之上升,儘管新一代 ASIC 晶片的效率提昇在一定程度上抵消了这一成本。对于财富 500 强以外的预算紧张型企业而言,资金筹措障碍仍然是最大的挑战。
细分市场分析
到2025年,核心交换器将占据资料中心交换器市场份额的47.35%,这主要归功于它们在超大规模园区内聚合数千条叶链路的作用。对于需要在数万台伺服器上实现确定性延迟的横向扩展架构而言,核心交换器仍然至关重要。随着人工智慧工作负载对高半径架构的需求日益增长,基于底盘的设计也越来越受欢迎,因此核心平台相关的资料中心交换器市场规模预计将稳步扩大。儘管接取交换器的单位成本较低,但由于边缘节点和微型资料中心的激增,预计其复合年增长率将达到8.86%,成为成长最快的交换器。供应商正在将深度缓衝和设备端分析功能整合到存取设备中,使营运商能够在网路边缘实施服务品质(QoS)策略。新兴市场正在推动低功耗接入模式的部署,即使在电力供应薄弱的地区也能实现。整体成长模式呈现双轨演进:超大规模环境中的高价值核心交换器更新周期与分散式设施中的大批量存取交换器销售并行。
到2025年,100GbE交换器将维持38.40%的资料中心交换器市场份额,这反映了其在主流工作负载方面出色的成本绩效。然而,随着人工智慧丛集对无阻塞网路架构的需求超过400G超额订阅阈值,800GbE设备的资料中心交换器市场规模预计将快速成长。初步试点计画表明,800GbE主干网和400GbE叶网的组合,凭藉其高频宽二分特性,可以将生成模型训练时间缩短30%。早期升级用户,例如高效能运算中心和金融交易所,对200-400GbE的需求依然强劲。同时,随着伺服器网路卡速度的提升,传统的10GbE及以下网路卡的出货量持续下降,产业需求正转向更高速度的网路卡。
区域分析
北美地区是全球最大的区域收入来源,这得益于持续的超大规模扩张、充裕的资本以及有利于数位基础设施的政策框架。主要云端服务供应商继续在维吉尼亚和俄亥俄州建置数吉瓦的资料中心。根据《晶片法案》(CHIPS Act),国内半导体激励措施旨在实现ASIC晶片的在地化生产,并减少对海外晶圆厂的依赖。加拿大和墨西哥正吸引寻求可再生能源和税收优惠的营运商进行二次建设,以提供冗余和延迟分散功能。
亚太地区预计将维持最高的整体成长率,到2030年资料中心容量将翻倍。中国市场仍占据主导地位,但严格的数据本地化法规使跨境云端设计变得复杂。印度正在加强其製造业基础,像Arista这样的供应商推出组装以缩短供应链并避免关税。日本和韩国正在投资延长海底电缆,并探索液冷技术以管理人口密集都市区的部署。该地区监管环境的多样性要求供应商根据每个国家的具体情况调整合规能力。
数位主权是欧洲关注的焦点,84% 的企业正在寻求区域化云端解决方案。虽然 FLAPD 都会区将吸收大部分新增兆瓦容量,但北欧国家凭藉其丰富的可再生能源资源吸引着营运商。本地供应商正将合规认证作为差异化优势。在中东和非洲,基础设施的快速扩张与国家人工智慧策略相契合,其中阿联酋和沙乌地阿拉伯主导,为外国超大规模资料中心业者营运商提供数十亿美元的激励措施和优惠的房地产条款。严酷的气候条件正在加速液冷技术的应用,以维持能源效率。
其他福利:
- Excel格式的市场预测(ME)表
- 3个月的分析师支持
目录
第一章 引言
- 研究假设和市场定义
- 调查范围
第二章调查方法
第三章执行摘要
第四章 市场情势
- 市场概览
- 市场驱动因素
- 云端运算和边缘运算工作负载的爆炸性成长
- 人工智慧/机器学习训练丛集对高频宽交换的需求
- 资料居住义务和主权云
- 400G/800G光纤技术将推动每个连接埠成本(美元/Gb)的下降。
- 资料中心去中心化和开放式网路的采用
- 采用液冷技术的超高密度开关
- 市场限制
- 下一代交换器升级需要高额的资本支出(CAPEX)和营运支出(OPEX)。
- 叶脊结构管理技能短缺
- 先进ASIC晶片供应链中断
- 5nm/3nm晶片生产监管方面的延误
- 价值/供应链分析
- 监管环境
- 技术展望
- 波特五力模型
- 买方的议价能力
- 供应商的议价能力
- 新进入者的威胁
- 替代品的威胁
- 竞争对手之间的竞争
- 技术概述
- 频宽
- 交换技术
第五章 市场规模与成长预测
- 按开关类型
- 核心交换机
- 配电开关
- 存取交换机
- 按频宽等级
- 10 GbE 或更低
- 25-100 GbE
- 100-200 GbE
- 200-400 GbE
- 800 GbE 以上
- 透过技术
- Ethernet
- Fiber Channel
- InfiniBand
- 依资料中心类型
- 超大规模云端供应商
- 託管服务提供者
- 企业/本地部署
- 按最终用户行业划分
- 资讯科技/通讯
- BFSI
- 政府/国防
- 医疗保健和生命科学
- 媒体与娱乐
- 零售与电子商务
- 教育/研究
- 按地区
- 北美洲
- 我们
- 加拿大
- 墨西哥
- 南美洲
- 巴西
- 南美洲其他地区
- 欧洲
- 英国
- 德国
- 法国
- 义大利
- 其他欧洲地区
- 亚太地区
- 中国
- 日本
- 印度
- 韩国
- 亚太其他地区
- 中东和非洲
- 中东
- 沙乌地阿拉伯
- 阿拉伯聯合大公国
- 土耳其
- 其他中东地区
- 非洲
- 南非
- 其他非洲地区
- 中东
- 北美洲
第六章 竞争情势
- 市占率分析
- 公司简介
- Cisco Systems, Inc.
- Arista Networks, Inc.
- Juniper Networks, Inc.
- Hewlett Packard Enterprise Development LP
- Dell Technologies, Inc.
- Huawei Technologies Co., Ltd.
- H3C Holding Limited
- Lenovo Group Limited
- NEC Corporation
- Extreme Networks, Inc.
- NVIDIA Corporation(Mellanox and Cumulus)
- Fortinet, Inc.
- Broadcom Inc.
- ZTE Corporation
- Quanta Cloud Technology
- D-Link Corporation
- Edgecore Networks(Accton)
- Super Micro Computer, Inc.
- Pluribus Networks, Inc.
- Silicom Ltd.
- Netgear, Inc.
- Chelsio Communications, Inc.
第七章 市场机会与未来展望
The data center switches market was valued at USD 17.93 billion in 2025 and estimated to grow from USD 19.37 billion in 2026 to reach USD 28.53 billion by 2031, at a CAGR of 8.05% during the forecast period (2026-2031).
Rising deployment of artificial-intelligence training clusters, steady migration toward cloud-native workloads, and rapid scaling of hyperscale campuses continue to drive capital spending on high-bandwidth switch infrastructure. The shift from three-tier to leaf-spine fabrics is flattening network topologies, enabling lower latency and more predictable performance for parallel processing. Ethernet silicon innovation is pushing port density past 51.2 Tbps per device, trimming power draw per gigabit and widening adoption of 400G and 800G optics. Regulatory mandates on data residency spur in-region capacity additions, while expanding edge facilities create incremental demand for compact, remotely managed switches that can tolerate constrained footprints. Competitive intensity is heightening as vertically integrated vendors bundle silicon, optics, and software to shorten deployment cycles and simplify operations.
Global Data Center Switch Market Trends and Insights
Cloud and Edge Computing Workload Surge
Edge sites that process 5G, IoT, and real-time analytics workloads are proliferating, boosting demand for compact, high-throughput switches able to function in space-limited racks. Hyperscalers now design regional edge nodes to keep latency under 10 milliseconds for consumer applications, which places switch hardware in harsh, often unmanned locations. Programmable forwarding planes allow operators to steer traffic dynamically between metro edge and core campuses without manual recabling. Hardware-based time-sensitive networking features also help support industrial robots and autonomous vehicles that require deterministic latency. As edge footprints grow, multi-tenant colocation providers are adding redundant access layers, enlarging the addressable pool for low-power switches.
AI/ML Training Clusters Requiring High-Bandwidth Switching
Training large language models generates east-west traffic that is 24-32 times higher than standard data-center traffic patterns. Hyperscale operators therefore deploy 102.4 Tbps ASICs that maintain single-hop paths between GPUs, while congestion-control algorithms keep packet loss near zero. Vendors experiment with link-level telemetry to predict micro-bursts and reroute flows within micro-seconds. Early field results show a 1.6 times reduction in model training duration when 400G links replace 100G links in the same fabric. These performance gains translate into millions of dollars in GPU utilization savings, reinforcing the ROI for faster switches.
High CAPEX and OPEX for Next-Gen Switch Upgrades
Upgrading from 10G or 40G to 400G demands not just new switches but also higher-grade fiber, power upgrades, and advanced cooling, pushing total project budgets from USD 10 million to USD 500 million for enterprise-scale builds. Many mid-size firms postpone overhauls and instead lease capacity from colocation providers, slowing direct switch sales. Ongoing operating expenses rise as higher port speeds increase electricity draw, although newer ASICs partially offset this through efficiency gains. Financing hurdles remain most acute for budget-constrained organizations outside the Fortune 500.
Other drivers and restraints analyzed in the detailed report include:
- Mandates on Data Residency and Sovereign Clouds
- 400G/800G Optics Driving Port USD/Gb Down
- Skills Shortage in Managing Leaf-Spine Fabrics
For complete list of drivers and restraints, kindly check the Table Of Contents.
Segment Analysis
Core switches accounted for 47.35% of the data center switches market share in 2025 due to their role in aggregating thousands of leaf links within hyperscale campuses. They remain essential for scale-out fabrics that demand deterministic latency across tens of thousands of servers. The data center switches market size associated with core platforms is projected to expand steadily as AI workloads require higher radix architectures that favor chassis-based designs. Access switches, while smaller ticket items, post the highest 8.86% CAGR as edge nodes and micro data centers proliferate. Vendors integrate deep buffering and on-device analytics into access gear, letting operators enforce quality-of-service policies at the network edge. In emerging markets, low-power access models enable deployments where utility grids remain fragile. The combined growth pattern shows a dual-track evolution, with high-value core refresh cycles in hyperscale settings and high-volume access sales in distributed estates.
The 100 GbE segment retained 38.40% data center switches market share in 2025, reflecting its favorable cost-performance trade-off for mainstream workloads. Yet the data center switches market size for 800 GbE gear is projected to rise sharply as AI clusters require non-blocking fabrics that exceed 400G oversubscription thresholds. Early pilots demonstrate that 800 GbE spines paired with 400 GbE leaves reduce training time for generative models by 30% through higher bisectional bandwidth. Customer interest in 200-400 GbE remains healthy among HPC centers and financial exchanges that upgraded earlier. Meanwhile, legacy <=10 GbE shipments continue to taper as server NIC speeds climb, further tilting industry demand toward high-speed segments.
The Data Center Switch Market is Segmented by Switch Type (Core Switches, Access Switches, and More), Bandwidth Class (<=10 GbE, 25-100 GbE, and More), Switching Technology (Ethernet, Infiniband, and More), Data Center Type (Hyperscale Cloud, Colocation, and More), End-User Industry (IT and Telecom, BFSI, and More), and Geography (North America, Europe, and More). The Market Forecasts are Provided in Terms of Value (USD).
Geography Analysis
North America accounts for the largest regional revenue thanks to sustained hyperscale expansion, abundant capital, and supportive digital-infrastructure policy frameworks. Major cloud providers continue to break ground on multi-giga-watt campuses across Virginia and Ohio. Domestic semiconductor incentives under the CHIPS Act aim to localize ASIC production, reducing dependence on overseas fabs. Canada and Mexico attract secondary builds as operators seek renewable energy and tax incentives, providing redundancy and latency diversification.
Asia-Pacific registers the fastest aggregate growth, with data center capacity expected to double before 2030. China's market remains dominant yet constrained by strict data-localization rules that complicate cross-border cloud designs. India gains manufacturing traction as vendors such as Arista launch assembly lines that shorten supply chains and bypass tariffs. Japan and South Korea invest in submarine cable extensions and liquid-cooling research to manage dense urban deployments. Regulatory diversity across the region forces vendors to tailor compliance features on a country-by-country basis.
Europe centers on digital sovereignty, with 84% of enterprises pursuing region-bound cloud solutions. The FLAPD metros absorb most new megawatt additions, yet Nordic states lure operators with abundant renewable power. Local vendors emphasize compliance certifications as differentiators. Middle East and Africa witness rapid build-out aligned with national AI strategies. The United Arab Emirates and Saudi Arabia lead, offering multi-billion-dollar incentives and favorable real-estate terms to foreign hyperscalers. Harsh climates accelerate adoption of liquid-cooling to maintain energy efficiency.
- Cisco Systems, Inc.
- Arista Networks, Inc.
- Juniper Networks, Inc.
- Hewlett Packard Enterprise Development LP
- Dell Technologies, Inc.
- Huawei Technologies Co., Ltd.
- H3C Holding Limited
- Lenovo Group Limited
- NEC Corporation
- Extreme Networks, Inc.
- NVIDIA Corporation (Mellanox and Cumulus)
- Fortinet, Inc.
- Broadcom Inc.
- ZTE Corporation
- Quanta Cloud Technology
- D-Link Corporation
- Edgecore Networks (Accton)
- Super Micro Computer, Inc.
- Pluribus Networks, Inc.
- Silicom Ltd.
- Netgear, Inc.
- Chelsio Communications, Inc.
Additional Benefits:
- The market estimate (ME) sheet in Excel format
- 3 months of analyst support
TABLE OF CONTENTS
1 INTRODUCTION
- 1.1 Study Assumptions and Market Definition
- 1.2 Scope of the Study
2 RESEARCH METHODOLOGY
3 EXECUTIVE SUMMARY
4 MARKET LANDSCAPE
- 4.1 Market Overview
- 4.2 Market Drivers
- 4.2.1 Cloud and Edge Computing Workload Surge
- 4.2.2 AI/ML Training Clusters Requiring High-Bandwidth Switching
- 4.2.3 Mandates on Data Residency and Sovereign Clouds
- 4.2.4 400G / 800G Optics Driving Port $/Gb Down
- 4.2.5 Data-Center Disaggregation and Open Networking Adoption
- 4.2.6 Liquid-Cooling-Enabled Ultra-Dense Switching
- 4.3 Market Restraints
- 4.3.1 High CAPEX and OPEX for Next-Gen Switch Upgrades
- 4.3.2 Skills Shortage in Managing Leaf-Spine Fabrics
- 4.3.3 Supply-Chain Disruptions for Advanced ASICs
- 4.3.4 Regulatory Delays in 5 nm / 3 nm Chip Production
- 4.4 Value / Supply-Chain Analysis
- 4.5 Regulatory Landscape
- 4.6 Technological Outlook
- 4.7 Porter's Five Forces
- 4.7.1 Bargaining Power of Buyers
- 4.7.2 Bargaining Power of Suppliers
- 4.7.3 Threat of New Entrants
- 4.7.4 Threat of Substitute Products
- 4.7.5 Intensity of Competitive Rivalry
- 4.8 Technology Snapshot
- 4.8.1 Bandwidth
- 4.8.2 Switching Technology
5 MARKET SIZE AND GROWTH FORECASTS (VALUE, USD)
- 5.1 By Switch Type
- 5.1.1 Core Switches
- 5.1.2 Distribution Switches
- 5.1.3 Access Switches
- 5.2 By Bandwidth Class
- 5.2.1 <=10 GbE
- 5.2.2 25-100 GbE
- 5.2.3 100-200 GbE
- 5.2.4 200-400 GbE
- 5.2.5 800 GbE and Beyond
- 5.3 By Switching Technology
- 5.3.1 Ethernet
- 5.3.2 Fiber Channel
- 5.3.3 InfiniBand
- 5.4 By Data Center Type
- 5.4.1 Hyperscale Cloud Providers
- 5.4.2 Colocation Providers
- 5.4.3 Enterprise / On-Premise
- 5.5 By End-User Industry
- 5.5.1 IT and Telecom
- 5.5.2 BFSI
- 5.5.3 Government and Defense
- 5.5.4 Healthcare and Life Sciences
- 5.5.5 Media and Entertainment
- 5.5.6 Retail and E-Commerce
- 5.5.7 Education and Research
- 5.6 By Geography
- 5.6.1 North America
- 5.6.1.1 United States
- 5.6.1.2 Canada
- 5.6.1.3 Mexico
- 5.6.2 South America
- 5.6.2.1 Brazil
- 5.6.2.2 Rest of South America
- 5.6.3 Europe
- 5.6.3.1 United Kingdom
- 5.6.3.2 Germany
- 5.6.3.3 France
- 5.6.3.4 Italy
- 5.6.3.5 Rest of Europe
- 5.6.4 Asia-Pacific
- 5.6.4.1 China
- 5.6.4.2 Japan
- 5.6.4.3 India
- 5.6.4.4 South Korea
- 5.6.4.5 Rest of Asia-Pacific
- 5.6.5 Middle East and Africa
- 5.6.5.1 Middle East
- 5.6.5.1.1 Saudi Arabia
- 5.6.5.1.2 United Arab Emirates
- 5.6.5.1.3 Turkey
- 5.6.5.1.4 Rest of Middle East
- 5.6.5.2 Africa
- 5.6.5.2.1 South Africa
- 5.6.5.2.2 Rest of Africa
- 5.6.5.1 Middle East
- 5.6.1 North America
6 COMPETITIVE LANDSCAPE
- 6.1 Market Share Analysis
- 6.2 Company Profiles (includes Global Level Overview, Market Level Overview, Core Segments, Financials as available, Strategic Information, Market Rank/Share for key companies, Products and Services, and Recent Developments)
- 6.2.1 Cisco Systems, Inc.
- 6.2.2 Arista Networks, Inc.
- 6.2.3 Juniper Networks, Inc.
- 6.2.4 Hewlett Packard Enterprise Development LP
- 6.2.5 Dell Technologies, Inc.
- 6.2.6 Huawei Technologies Co., Ltd.
- 6.2.7 H3C Holding Limited
- 6.2.8 Lenovo Group Limited
- 6.2.9 NEC Corporation
- 6.2.10 Extreme Networks, Inc.
- 6.2.11 NVIDIA Corporation (Mellanox and Cumulus)
- 6.2.12 Fortinet, Inc.
- 6.2.13 Broadcom Inc.
- 6.2.14 ZTE Corporation
- 6.2.15 Quanta Cloud Technology
- 6.2.16 D-Link Corporation
- 6.2.17 Edgecore Networks (Accton)
- 6.2.18 Super Micro Computer, Inc.
- 6.2.19 Pluribus Networks, Inc.
- 6.2.20 Silicom Ltd.
- 6.2.21 Netgear, Inc.
- 6.2.22 Chelsio Communications, Inc.
7 MARKET OPPORTUNITIES AND FUTURE OUTLOOK
- 7.1 White-Space and Unmet-Need Assessment
 资料中心交换器市场:按类型、连接埠速度、拓扑结构、最终用户和应用划分-2026年至2032年全球市场预测
 资料中心交换器市场分析及预测(至 2035 年):按类型、产品类型、服务、技术、组件、应用、部署类型、最终用户、安装类型和解决方案划分
 资料中心交换器市场 - 全球产业规模、份额、趋势、机会、预测:按最终用户、产品类型、连接埠速度、交换器类型、地区和竞争对手划分,2021-2031 年资料中心白盒交换器市场按产品类型、连接埠速度、功能、架构、外形规格尺寸、连接埠密度、交换容量、应用和最终用户划分 - 全球预测(2026-2032 年)
 资料中心交换器市场规模、份额和成长分析(按交换器类型、技术、最终用户、频宽和地区划分)—产业预测(2026-2033 年)
 全球人工智慧(AI)资料中心交换器市场
 资料中心交换器市场:全球产业分析、市场规模、份额、成长、趋势与未来预测(2025-2032)
 2025-2029年全球资料中心交换器市场
 2025 年至 2033 年资料中心交换器市场报告(按类型、频宽、技术、最终用户和地区)