


 |
市场调查报告书
商品编码
1940628
加固型显示器:市场占有率分析、产业趋势与统计、成长预测(2026-2031 年)Rugged Display - Market Share Analysis, Industry Trends & Statistics, Growth Forecasts (2026 - 2031) |
||||||
※ 本网页内容可能与最新版本有所差异。详细情况请与我们联繫。
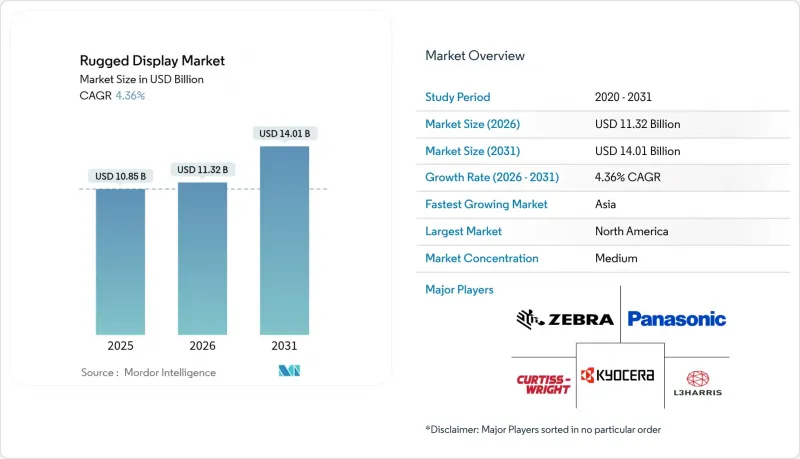
预计加固型显示器市场将从 2025 年的 108.5 亿美元成长到 2026 年的 113.2 亿美元,到 2031 年将达到 140.1 亿美元,2026 年至 2031 年的复合年增长率为 4.36%。
这一成长反映了国防、工业和紧急应变领域关键任务营运的数位化,在这些领域,市售萤幕无法承受衝击、振动或极端温度。扩增扩增实境(AR) 工作流程的日益普及、5G 智慧工厂的升级以及军事现代化专案的推进,正在拓展阳光下可视、本质安全和温度控管面板的应用范围。产品组合向平板电脑、车用电脑和超加固外形规格产品转变,正在重塑供应商的策略蓝图。亚太地区的成长势头最为强劲,製造商正在整合专用 5G 网路;而北美则凭藉国防费用和严格的工业安全法规保持主导。以中国为中心的 LCD 生产供应链风险日益增加,OLED 的散热限制也构成了一定的阻力,但同时也推动了替代材料和本地化采购的研发。
全球环境加固型显示器市场趋势与洞察
将 AR 介面整合到现场服务应用中
像 RealWear Navigator 520 这样的免手持式 AR 头戴平板电脑,能够将即时绘图、远端指导和设备数据直接传输到工作人员的视野中,从而提高首次维修成功率。到 2030 年,全球 AR 硬体出货量将以 50.7% 的复合年增长率 (CAGR) 加速成长,这将推动对具备防破坏、语音控制功能以及可在爆炸性环境中使用的认证显示器的需求。供应商正专注于低功耗晶片组和高效背光技术,以延长整个班次的电池续航时间。这正在推动坚固型显示器市场从被动视觉化向互动式、富含感测器的平台演进,将数位迭加层与现实世界的资产融合在一起。掌握散热技术和人眼安全亮度等级的製造商将有望抓住来自公共产业、石油和天然气设备维护以及重型设备 OEM 服务团队的中期成长机会。
坚固型显示器在自主军用车辆和无人系统的应用
随着人工智慧驱动的自主飞行技术日趋成熟,国防机构正在指定采用模组化、开放式系统架构,以便对柯林斯太空公司的AFD-3210等自适应飞行显示器进行升级。具备夜视功能的触控萤幕平均故障间隔时间(MTBF)高达9000小时,满足夜视和低特征讯号的要求,而密封机壳则能有效抵御衝击、灰尘和电磁干扰。这项转变恰逢采购週期长达2028年以后,但早期原型机已可选地整合到有人驾驶地面车辆中,证明了市场需求。坚固耐用的显示器市场正受益于多域指挥介面,这些介面将即时感测器融合、机动目标数据和预测性维护警报整合到单一面板中。能够平衡散热限制和不断增长的机载处理负载的供应商正在获得战略优势。
温度控管挑战限制了OLED在高温环境下的国防任务应用
由于有机发光二极管(OLED)在持续高于 85°C 的温度下会迅速劣化,军方越来越多地采用液晶显示技术来製造车辆仪錶板和桅杆式瞄准器。冷却板、热管和传导冷却外壳会增加重量和功耗,抵消 OLED 的理论效率。引擎室和沙漠环境的温度可能超过 125°C,因此,加固型显示器市场的供应商优先考虑具有卓越耐热性的非晶质液晶显示器,同时也在投资研发能够满足未来性能标准并消除其热脆弱性的无机发光材料。
细分市场分析
到2025年,平板电脑将占据加固型显示器市场34.72%的份额,其便携性、户外可视性和热插拔电池等特性使其非常适合物流和现场服务作业。受用于设备内电脑视觉分析的人工智慧协处理器的推动,平板电脑加固型显示器的市场规模预计到2031年将以4.25%的复合年增长率成长。安装在堆高机、消防车和战术车辆上的车载设备是成长最快的细分市场,复合年增长率达6%,这主要得益于自动驾驶技术的投资。在公共和公共产业领域,智慧型手机和手持终端机(可实现快速单手操作)将占据一定的市场份额。同时,面板电脑在控制室仍然至关重要,因为控制室需要24至55英寸的多点触控萤幕。
边缘人工智慧与先进晶片组的融合正在重塑设备开发格局。 Panasonic 40 Mk2 采用英特尔酷睿 Ultra 晶片,在满足 MIL-STD-810H 军规级跌落标准的同时,将人工智慧推理性能提升了 143%。这体现了加固型显示器市场正从通用笔记型电脑转向专用运算设备。任务专用韧体、支援戴手套操作的触控显示器以及密封式 I/O 连接埠是新产品的差异化优势。在更新设备时,买家除了考虑生命週期成本、周边设备生态系统和网路安全认证外,还会考虑耐用性指标。
到2025年,全加固型硬体将占据加固型显示器市场47.10%的份额,在工厂车间、仓库和前线防御场所等应用场景中兼顾成本和耐用性。超加固型显示器专为应对零下启动、盐雾腐蚀和10,000 psi压力而设计,正以6.9%的复合年增长率快速增长,以满足采矿、石油天然气和特种部队日益增长的环境需求。半加固型显示器则为轻工业和零售环境提供入门级价格选择,这些环境的风险因素主要是意外跌落和液体飞溅,而非衝击波或爆炸超压。
诸如MIL-STD-810H之类的严格测试标准正从特种部队扩展到通用后勤竞标,推动各个价位的产品规格不断提高。由于高价位产品依然存在,预计超加固型设备的市场成长速度将超过销售成长速度。供应商正在为其产品增加模组化扩展槽、射频吸收机壳和可现场更换的固态硬碟,以确保其产品能够适应未来的发展需求。买家逐渐意识到停机成本远超过初始成本,因此即使在半加固型产品的采购週期中,也加快了对更高耐用性等级产品的追求。
区域分析
到2025年,北美将占据加固型显示器市场37.15%的份额,这主要得益于国防采购、美国职业安全与健康管理局 (OSHA) 和矿山安全与健康管理局 (MSHA) 严格的安全标准,以及成熟的工业自动化基础设施。诸如美国陆军的ENVG-B(夜视镜)等合约持续推动着夜视萤幕的大规模生产。在加拿大,在恶劣环境下的采矿和管道监测需求是主要驱动因素;而在墨西哥,近岸製造业的扩张正在推动汽车和电子工厂对加固型显示器的需求。区域买家优先考虑供应链安全和《国际武器贸易条例》(ITAR) 的合规性,并正在加强与国内和盟国供应商的合作关係。
亚太地区正经历最快成长,复合年增长率达5.62%,这主要得益于工厂数位化、5G专网部署以及政府主导的工业4.0跨越式发展。中国凭藉着电子製造业的规模经济优势和积极的自动化补贴政策,而日本在机器人领域的专业技术则对低延迟视觉化节点提出了更高的要求。印度以电信为中心的数位基础设施规划为铁路和公共产业的加固型平板电脑创造了新的机会。智慧工厂试点计画已实现52%至245%的生产力提升,证明了资本投资的合理性。东南亚的电子产业丛集和澳洲的矿业计划进一步补充了区域需求,从而提振了各垂直领域的需求。
欧洲在ATEX安全法规、汽车电气化专案以及航太航天研发和合作的推动下,实现了稳定成长。德国在汽车组装领域主导地位,该领域需要密封的、可戴手套操作的面板来实现人机协作。英国正在为其机队购买驾驶座显示器和任务计算升级设备。北欧国家正在加大对风电场监测和北极航线的投资,因此更倾向于采用带有加热触控表面的超坚固机壳。欧洲的监管环境鼓励拥有全面认证组合的供应商,使低故障率硬体获得更高的价格。
其他福利:
- Excel格式的市场预测(ME)表
- 分析师支持(3个月)
目录
第一章 引言
- 研究假设和市场定义
- 调查范围
第二章调查方法
第三章执行摘要
第四章 市场情势
- 市场概览
- 市场驱动因素
- 将扩增实境介面整合到现场服务应用中
- 自主军用车辆和无人系统加强型显示器采用趋势
- 危险工业环境中的严格安全法规推动了对本质安全型面板的需求。
- 户外油气作业对高亮度、阳光下可视萤幕的需求不断增长(中东地区)
- 与频繁更换矿用车辆消费级显示器相比,其生命週期成本优势显着。
- 5G专用网路扩充辅助亚太智慧工厂实现加固型平板电脑升级
- 市场限制
- 在高温环境下,温度控管的挑战限制了OLED在国防任务中的应用。
- 由于以中国为中心的製造业,工业液晶面板供应链出现波动。
- 中小型企业仓库用超坚固型平板电脑的初始资本支出较高
- 外形规格限制了边缘运算向穿戴式装置的迁移
- 产业生态系分析
- 监理与技术展望
- 波特五力分析
- 供应商的议价能力
- 消费者议价能力
- 新进入者的威胁
- 替代品的威胁
- 竞争对手之间的竞争
第五章 市场规模与成长预测
- 依产品类型
- 智慧型手机和掌上电脑
- 平板电脑
- 笔记型电脑
- 航空电子显示器
- 车上电脑
- 面板电脑和关键任务显示器
- 按稳健性水平
- 半加固型
- 全加固型
- 超坚固型
- 按作业系统
- Android
- Windows
- Linux 和其他
- 最终用户
- 石油和天然气
- 政府、国防、航太
- 工业製造
- 汽车、运输和物流
- 医疗保健和公共
- 公共产业和能源
- 其他最终用户
- 按地区
- 北美洲
- 我们
- 加拿大
- 墨西哥
- 欧洲
- 德国
- 英国
- 法国
- 北欧国家
- 其他欧洲地区
- 南美洲
- 巴西
- 南美洲其他地区
- 亚太地区
- 中国
- 日本
- 印度
- 东南亚
- 亚太其他地区
- 中东和非洲
- 中东
- GCC
- 土耳其
- 其他中东地区
- 非洲
- 南非
- 其他非洲地区
- 中东
- 北美洲
第六章 竞争情势
- 市场集中度
- 策略趋势
- 市占率分析
- 公司简介
- Curtiss-Wright Corporation
- General Dynamics Corporation
- Collins Aerospace(Raytheon Technologies)
- L3Harris Technologies Inc.
- Esterline Technologies Corporation
- Xplore Technologies Corporation
- Beijer Electronics AB
- Kyocera Corporation
- Sparton Corporation
- Panasonic Holdings Corporation
- Zebra Technologies Corporation
- Getac Technology Corporation
- Dell Technologies Inc.
- Trimble Inc.
- Honeywell International Inc.
- Winmate Inc.
- Advantech Co., Ltd.
- Rockwell Automation, Inc.(Allen-Bradley)
- Juniper Systems Inc.
- AAEON Technology Inc.
- Datalogic SpA
- Leonardo SpA
- Crystal Group, Inc.
第七章 市场机会与未来展望
The rugged display market is expected to grow from USD 10.85 billion in 2025 to USD 11.32 billion in 2026 and is forecast to reach USD 14.01 billion by 2031 at 4.36% CAGR over 2026-2031.
The expansion reflects the digitization of mission-critical operations across defense, industrial, and emergency-response settings where commercial screens cannot survive shocks, vibration, or extreme temperatures. Rising adoption of augmented-reality (AR) workflows, 5G-enabled smart-factory upgrades, and military modernization programs are broadening the application base for sunlight-readable, intrinsically-safe, and thermally-managed panels. A shifting product mix toward tablet PCs, vehicle-mounted computers, and ultra-rugged form factors is reshaping vendor roadmaps. Geographic momentum is strongest in Asia-Pacific as manufacturers integrate private 5G networks, while North America retains leadership thanks to defense spending and strict industrial-safety rules. Intensifying supply-chain risks around China-centric LCD production and OLED thermal constraints pose headwinds but also spur R&D in alternative materials and regional sourcing.
Global Rugged Display Market Trends and Insights
Integration of AR Interfaces in Field-Service Applications
Hands-free AR-ready head-mounted tablets such as RealWear Navigator 520 improve first-time-fix rates by streaming live diagrams, tele-mentoring sessions, and equipment data directly in the operator's line of sight. Global AR hardware shipments are accelerating at 50.7% CAGR through 2030, feeding demand for impact-resistant, voice-controlled displays certified for explosive atmospheres. Vendors focus on low-power chipsets and efficient backlights to extend shift-length battery life. The rugged display market is therefore evolving from passive visualization toward interactive, sensor-rich platforms that blend digital overlays with real-world assets. Manufacturers that master heat-dissipation techniques and eye-safe luminance levels position themselves to capture mid-term growth from utilities, oil-and-gas maintenance, and heavy-equipment OEM service teams.
Adoption of Rugged Displays for Autonomous Military Vehicles and Unmanned Systems
Defense agencies specify modular open-systems architectures so that adaptive flight displays like Collins Aerospace's AFD-3210 can be upgraded as AI-driven autonomy matures. NVIS-compatible touchscreens with 9,000-hour MTBF meet night-vision and low-signature requirements, while sealed enclosures withstand shock, dust, and electromagnetic interference. The transition aligns with long procurement cycles that extend beyond 2028, but early prototypes embedded in optionally-manned ground vehicles validate demand. The rugged display market benefits from multi-domain command interfaces where real-time sensor fusion, kinetic-target data, and predictive-maintenance alerts converge on a single panel. Suppliers able to balance thermal constraints against rising on-board processing loads gain strategic advantage.
Thermal-Management Challenges Limiting OLED in High-Temperature Defense Missions
Organic emissive layers degrade quickly at sustained temperatures above 85 °C, prompting militaries to favor LCD technology for vehicle dashboards and mast-mounted sights. Cooling plates, heat pipes, and conduction-cooled enclosures add weight and power draw, offsetting OLED's theoretical efficiency. As engine-bay and desert climates can surpass 125 °C, rugged display market vendors prioritize robust amorphous-silicon LCDs while funding R&D into inorganic emissive materials that might satisfy future performance criteria without thermal fragility.
Other drivers and restraints analyzed in the detailed report include:
- Stringent Safety Regulations in Hazardous Industrial Environments
- Rising Demand for High-Brightness Sunlight-Readable Screens
- Supply-Chain Volatility of Industrial LCD Panels
For complete list of drivers and restraints, kindly check the Table Of Contents.
Segment Analysis
Tablet PCs accounted for 34.72% of the rugged display market in 2025, combining portability, outdoor readability, and hot-swappable batteries that align with logistics and field-service workflows. The rugged display market size for tablet PCs is projected to climb at 4.25% CAGR through 2031 as AI co-processors enable on-device computer-vision analytics. Vehicle-mounted terminals, installed on forklifts, fire engines, and tactical trucks, represent the fastest-growing niche at 6% CAGR, fueled by autonomous-mobility investments. Smartphones and handhelds hold niche share in public-safety and utilities where single-hand operation speeds ticket closure. Panel PCs remain essential in control rooms that demand 24-inch to 55-inch multi-touch surfaces.
Convergence of edge-AI and advanced chipsets is reshaping device roadmaps. Panasonic's TOUGHBOOK 40 Mk2 leverages Intel Core Ultra silicon to lift AI inference performance by 143% while meeting MIL-STD-810H drop standards. This illustrates how the rugged display market pivots toward specialized computing over generic laptops. Mission-specific firmware, glove-touch displays, and sealed I/O ports differentiate new releases. As fleets refresh, buyers compare lifecycle cost, accessory ecosystems, and cybersecurity certifications alongside raw durability metrics.
Fully-rugged hardware captured 47.10% rugged display market share in 2025, balancing cost and durability for factory floors, warehouses, and frontline defense outposts. Ultra-rugged variants, engineered to withstand sub-zero starts, salt-fog corrosion, and 10,000-psi pressure, are advancing at 6.9% CAGR as mining, oil-and-gas, and special-forces operations escalate environmental demands. Semi-rugged models offer entry pricing for light-industrial and retail settings where occasional drops or spills, rather than shock waves or blast over-pressure, define risk profiles.
Stringent test regimes such as MIL-STD-810H are migrating from elite military to mainstream logistics tenders, driving spec inflation across price bands. The rugged display market size for ultra-rugged gear is poised to outpace unit growth as premium pricing holds. Vendors add modular expansion bays, RF-absorbing housings, and field-swappable SSDs to future-proof assets. Buyers recognise that downtime penalties outweigh initial premiums, reinforcing a shift toward higher endurance ratings even in semi-rugged procurement cycles.
The Rugged Display Market Report is Segmented by Product Type (Smartphones and Handheld Computers, Tablet PCs, Laptops and Notebooks, and More), Level of Ruggedness (Semi-Rugged, Fully-Rugged, and Ultra-Rugged), Operating System (Android, Windows, and More), End User (Oil and Gas, Government, Defense and Aerospace, Industrial Manufacturing, and More) and Geography. The Market Forecasts are Provided in Terms of Value (USD).
Geography Analysis
North America generated 37.15% of rugged display market revenue in 2025, propelled by defense procurement, stringent OSHA and MSHA safety codes, and a mature industrial automation base. Contracts such as the U.S. Army's ENVG-B sustain high-volume production runs for night-vision-ready screens. Canada extends demand through harsh-weather mining and pipeline monitoring, while Mexico's expansion of near-shore manufacturing catalyzes adoption in automotive and electronics plants. Regional buyers emphasize supply-chain security and ITAR compliance, reinforcing relationships with domestic and allied suppliers.
Asia-Pacific is the fastest-growing region at 5.62% CAGR, driven by factory digitization, 5G private-network rollouts, and government initiatives to leapfrog to Industry 4.0. China's scale in electronics manufacturing combines with aggressive automation subsidies, while Japan's robotics expertise demands low-latency visualization nodes. India's telecom-centric digital infrastructure programs create new opportunities for rugged tablet deployments in railways and public utilities. Productivity gains of 52%-245% observed in pilot smart factories validate capital spend. Southeast Asian electronics clusters and Australian mining projects round out regional demand, reinforcing a diversified pull across verticals.
Europe records steady growth underpinned by ATEX safety mandates, automotive e-mobility programs, and aerospace R&D partnerships. Germany leads adoption in automotive assembly where human-robot collaboration requires sealed, glove-operable panels. The United Kingdom procures cockpit displays and mission-computing upgrades for its air fleet. Nordic investment in wind-farm monitoring and extreme-cold shipping lanes favors ultra-rugged enclosures with heated touch surfaces. Europe's regulatory landscape rewards vendors with comprehensive certification portfolios, allowing premium pricing for low-failure-rate hardware.
- Curtiss-Wright Corporation
- General Dynamics Corporation
- Collins Aerospace (Raytheon Technologies)
- L3Harris Technologies Inc.
- Esterline Technologies Corporation
- Xplore Technologies Corporation
- Beijer Electronics AB
- Kyocera Corporation
- Sparton Corporation
- Panasonic Holdings Corporation
- Zebra Technologies Corporation
- Getac Technology Corporation
- Dell Technologies Inc.
- Trimble Inc.
- Honeywell International Inc.
- Winmate Inc.
- Advantech Co., Ltd.
- Rockwell Automation, Inc. (Allen-Bradley)
- Juniper Systems Inc.
- AAEON Technology Inc.
- Datalogic S.p.A.
- Leonardo S.p.A.
- Crystal Group, Inc.
Additional Benefits:
- The market estimate (ME) sheet in Excel format
- 3 months of analyst support
TABLE OF CONTENTS
1 INTRODUCTION
- 1.1 Study Assumptions and Market Definition
- 1.2 Scope of the Study
2 RESEARCH METHODOLOGY
3 EXECUTIVE SUMMARY
4 MARKET LANDSCAPE
- 4.1 Market Overview
- 4.2 Market Drivers
- 4.2.1 Integration of Augmented Reality Interfaces in Field Service Applications
- 4.2.2 Adoption of Rugged Displays for Autonomous Military Vehicles and Unmanned Systems
- 4.2.3 Stringent Safety Regulations in Hazardous Industrial Environments Boosting Intrinsically-Safe Panels
- 4.2.4 Rising Demand for High-brightness Sunlight-Readable Screens in Outdoor Oil and Gas Operations, Middle East
- 4.2.5 Lifecycle Cost Advantage over Frequent Replacement of Consumer-grade Displays in Mining Fleets
- 4.2.6 Expansion of 5G Private Networks Enabling Rugged Tablet Upgrades in Smart Factories, Asia-Pacific
- 4.3 Market Restraints
- 4.3.1 Thermal Management Challenges Limiting Adoption of OLED in High-temperature Defense Missions
- 4.3.2 Supply Chain Volatility of Industrial LCD Panels Due to China-centric Manufacturing
- 4.3.3 High Initial Capital Outlay for Ultra-rugged Panel PCs in SMB Warehouses
- 4.3.4 Form-factor Constraints as Edge Computing Shifts Towards Wearables
- 4.4 Industry Ecosystem Analysis
- 4.5 Regulatory and Technological Outlook
- 4.6 Porter's Five Forces Analysis
- 4.6.1 Bargaining Power of Suppliers
- 4.6.2 Bargaining Power of Consumers
- 4.6.3 Threat of New Entrants
- 4.6.4 Threat of Substitutes
- 4.6.5 Intensity of Competitive Rivalry
5 MARKET SIZE AND GROWTH FORECASTS (VALUES)
- 5.1 By Product Type
- 5.1.1 Smartphones and Handheld Computers
- 5.1.2 Tablet PCs
- 5.1.3 Laptops and Notebooks
- 5.1.4 Avionics Displays
- 5.1.5 Vehicle-mounted Computers
- 5.1.6 Panel PCs and Mission-critical Displays
- 5.2 By Level of Ruggedness
- 5.2.1 Semi-rugged
- 5.2.2 Fully-rugged
- 5.2.3 Ultra-rugged
- 5.3 By Operating System
- 5.3.1 Android
- 5.3.2 Windows
- 5.3.3 Linux and Other
- 5.4 By End-User
- 5.4.1 Oil and Gas
- 5.4.2 Government, Defense and Aerospace
- 5.4.3 Industrial Manufacturing
- 5.4.4 Automotive, Transportation and Logistics
- 5.4.5 Healthcare and Public Safety
- 5.4.6 Utilities and Energy
- 5.4.7 Other End-Users
- 5.5 By Geography
- 5.5.1 North America
- 5.5.1.1 United States
- 5.5.1.2 Canada
- 5.5.1.3 Mexico
- 5.5.2 Europe
- 5.5.2.1 Germany
- 5.5.2.2 United Kingdom
- 5.5.2.3 France
- 5.5.2.4 Nordics
- 5.5.2.5 Rest of Europe
- 5.5.3 South America
- 5.5.3.1 Brazil
- 5.5.3.2 Rest of South America
- 5.5.4 Asia-Pacific
- 5.5.4.1 China
- 5.5.4.2 Japan
- 5.5.4.3 India
- 5.5.4.4 South-East Asia
- 5.5.4.5 Rest of Asia-Pacific
- 5.5.5 Middle East and Africa
- 5.5.5.1 Middle East
- 5.5.5.1.1 Gulf Cooperation Council Countries
- 5.5.5.1.2 Turkey
- 5.5.5.1.3 Rest of Middle East
- 5.5.5.2 Africa
- 5.5.5.2.1 South Africa
- 5.5.5.2.2 Rest of Africa
- 5.5.5.1 Middle East
- 5.5.1 North America
6 COMPETITIVE LANDSCAPE
- 6.1 Market Concentration
- 6.2 Strategic Moves
- 6.3 Market Share Analysis
- 6.4 Company Profiles {(includes Global level Overview, Market level overview, Core Segments, Financials as available, Strategic Information, Market Rank/Share for key companies, Products and Services, and Recent Developments)}
- 6.4.1 Curtiss-Wright Corporation
- 6.4.2 General Dynamics Corporation
- 6.4.3 Collins Aerospace (Raytheon Technologies)
- 6.4.4 L3Harris Technologies Inc.
- 6.4.5 Esterline Technologies Corporation
- 6.4.6 Xplore Technologies Corporation
- 6.4.7 Beijer Electronics AB
- 6.4.8 Kyocera Corporation
- 6.4.9 Sparton Corporation
- 6.4.10 Panasonic Holdings Corporation
- 6.4.11 Zebra Technologies Corporation
- 6.4.12 Getac Technology Corporation
- 6.4.13 Dell Technologies Inc.
- 6.4.14 Trimble Inc.
- 6.4.15 Honeywell International Inc.
- 6.4.16 Winmate Inc.
- 6.4.17 Advantech Co., Ltd.
- 6.4.18 Rockwell Automation, Inc. (Allen-Bradley)
- 6.4.19 Juniper Systems Inc.
- 6.4.20 AAEON Technology Inc.
- 6.4.21 Datalogic S.p.A.
- 6.4.22 Leonardo S.p.A.
- 6.4.23 Crystal Group, Inc.
7 MARKET OPPORTUNITIES AND FUTURE OUTLOOK
- 7.1 White-space and Unmet-Need Assessment
 2026年全球物流手持显示器市场报告2026年全球环境加固型显示器市场报告
 加强型显示器市场 - 全球产业规模、份额、趋势、机会和预测:按类型、触控萤幕类型、最终用户、地区和竞争格局划分,2021-2031 年
 坚固型显示器市场规模、份额和成长分析(按产品类型、坚固性等级、作业系统、显示器类型、最终用户和地区划分)-2026-2033年产业预测
 2025 年至 2033 年坚固型显示器市场报告(按产品、坚固程度、作业系统、最终用户和地区)
 全球坚固型显示器市场规模:依显示器、萤幕尺寸、最终用途产业、地区、范围和预测
 加固型显示器市场、机会、成长动力、产业趋势分析与预测,2024-2032