


 |
市场调查报告书
商品编码
1940632
氯碱:市场占有率分析、产业趋势与统计、成长预测(2026-2031)Chlor-alkali - Market Share Analysis, Industry Trends & Statistics, Growth Forecasts (2026 - 2031) |
||||||
※ 本网页内容可能与最新版本有所差异。详细情况请与我们联繫。
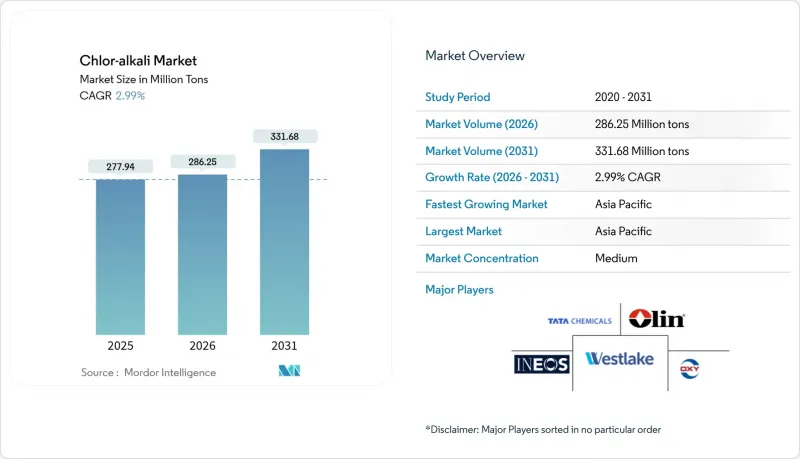
预计到 2026 年,氯碱市场规模将达到 2.8625 亿吨,高于 2025 年的 2.7794 亿吨。
预计到 2031 年将达到 3.3168 亿吨,2026 年至 2031 年的复合年增长率为 2.99%。
这一成长动能主要得益于PVC产能的持续扩张、水处理领域应用范围的扩大以及电动车电池材料对氧化铝需求的成长。氯、苛性钠和碱灰之间独特的供需平衡导致供需趋紧,促使生产商调整产能运转率以适应下游需求趋势。对膜电解的新投资降低了单位电力消耗量,而再生能源合约则缓解了电力成本的波动。同时,汞电解槽的逐步淘汰以及对碳排放监管力道的加大,正推动对更清洁技术平台的持续资本投资。
全球氯碱市场趋势与洞察
亚洲PVC产能快速成长
儘管疲软的房地产市场抑制了短期需求,但中国、印度和东南亚PVC产量的成长支撑了未来的氯需求。 PCC集团正在投资3.4亿美元,在科慕公司位于密西西比州的工厂建造一座氯碱联合装置,该装置到2028年将提供34万吨的年产能。印度对进口PVC征收反倾销税,鼓励了国内生产,直接促进了氯需求的成长。同时,东协生产商正受惠于供应链多元化。随着每条新的PVC生产线运作,都会采用固定的电化学氯与PVC比例,这导致供应链之外的普通消费者氯供应趋紧,并推高了区域价格溢价。这促使一些局部供应过剩地区的物流重心从中国沿海枢纽转移到服务整个亚太氯碱市场的出口管道。
增加氧化铝产量,用于电动车所需的铝
电池铝需要超低杂质氧化铝,而超低苛性钠。印尼氧化铝生产商正争相确保苛性钠的稳定供应,凸显了建造一体化氯碱氧化铝生产走廊的战略必要性。矾土矿床、精炼厂和电解厂在位置的不匹配推高了运输成本,促使当地氯碱工厂整合。由于其烧碱纯度规格高于大宗商品标准,供应此差异化苛性钠市场的生产商能够获得更高的利润。由于浓缩苛性钠长途运输有许多限制,因此,为了获得成本优势,生产商正在整合附近的膜电解设施。
高电价和电网波动
与天然气价格密切相关的电力价格快速上涨正在挤压欧洲氯碱产业的利润空间,导致部分工厂停产和生产转移。新兴市场的电压骤降使得电网运作更加复杂,因为需要昂贵的不断电系统)。能够在尖峰时段高峰期降低负荷,并在离峰时段期可再生能源发电时段提高产量的生产商可以实现重要的成本对冲。泰国天然气资源枯竭就是一个典型的例子,说明上游资源限制如何引发电力短缺,加剧氯碱业者的营运资金波动。
细分市场分析
到2025年,氯将占氯碱市场40.85%的份额,预计到2031年,其复合年增长率将达到3.35%,超过其他任何产品。亚洲和中东地区聚氯乙烯(PVC)聚合产能的加速提升,将确保每增加一吨氯的产量都能拥有稳定的销售管道。市政供水管网中水处理设施的日益完善,将创造对氯衍生物的额外需求,并确保一体化生产商更稳定的运转率。
儘管苛性钠的市场份额落后于氯气,但氧化铝精炼厂和纸浆加工商的需求预计将保持稳定成长。这些公司通常会签订多年承购协议以规避价格风险,同时,绿色氢能增值策略正在将氢气(一种以前被排放的产品)转化为收入来源,尤其是在政策支持的地区。这些因素,加上其多样化的终端用途,有助于稳定氯碱市场的收入并降低收入波动。
本氯碱市场报告按产品类型(苛性钠、氯气、碱灰)、生产製程类型(膜电解槽、隔膜电解槽、其他製程)、应用类型(纸浆和造纸、有机化学品、无机化学品、肥皂和清洁剂等)以及地区类型(亚太地区、北美地区、欧洲地区、南美地区、中东和非洲地区)进行分析。市场预测以销售量(单位)为基础。
区域分析
预计到2025年,亚太地区将占全球氯碱市场规模的62.15%,并在2031年之前以3.12%的复合年增长率持续成长。中国从PVC到电子产品的製造业基础,正推动氯和苛性钠的强劲需求。儘管区域房地产市场降温在短期内抑制了PVC树脂的消费,但这一趋势仍将持续。在印度,包括铁路、地铁和环卫系统在内的基础设施建设快速发展,刺激了PVC管道和城市水处理的需求,确保了未来多年的市场需求。
北美市场维持稳定份额,页岩气衍生乙烯的成本优势巩固了聚氯乙烯的竞争地位。地方政府供水事业持续升级使用了数十年的水处理设施,导致氯化化合物的处理量增加。德克萨斯州和亚伯达签订的长期再生能源购电协议(PPA)使得薄膜处理设备维修期间能够减少排放,从而增强了当地水务公司的韧性。
高昂的电价和严格的碳排放法规迫使欧洲运作了几台老旧的隔膜式除尘器,但特种化学品行业、严格的饮用水标准以及对医药前体的高产量需求支撑着以地区为基础,欧洲仍然是主要的进口地区。
南美洲的成长主要得益于巴西纸浆产业的扩张以及智利和秘鲁的采矿化学品产业的发展,而中东和非洲则出现了一些选择性的大型企划,旨在平衡国内需求与对非洲的出口路线,例如 Befar 集团在埃及投资 5 亿美元的综合体项目。
其他福利:
- Excel格式的市场预测(ME)表
- 3个月的分析师支持
目录
第一章 引言
- 研究假设和市场定义
- 调查范围
第二章调查方法
第三章执行摘要
第四章 市场情势
- 市场概览
- 市场驱动因素
- 亚洲PVC产能快速成长
- 用于电动车级铝的氧化铝产量增加
- 水和污水处理计划快速成长
- 与容量挂钩的可再生能源激励措施
- 化工製造业需求快速成长
- 市场限制
- 高昂的电价和电网不稳定
- 严格的碳足迹法规
- 盐水处理合规成本
- 价值链分析
- 波特五力模型
- 供应商的议价能力
- 买方的议价能力
- 新进入者的威胁
- 替代品的威胁
- 竞争程度
- 进出口趋势
第五章 市场规模与成长预测
- 副产品
- 苛性钠
- 氯
- 碱灰
- 透过製造工艺
- 膜细胞
- 膈肌细胞
- 其他流程
- 透过使用
- 纸浆和造纸
- 有机化学品
- 无机化学品
- 肥皂和清洁剂
- 氧化铝
- 纺织品
- 其他用途
- 按地区
- 亚太地区
- 中国
- 印度
- 日本
- 韩国
- 印尼
- 泰国
- 马来西亚
- 越南
- 亚太其他地区
- 北美洲
- 我们
- 加拿大
- 墨西哥
- 欧洲
- 德国
- 英国
- 法国
- 义大利
- 西班牙
- 土耳其
- 俄罗斯
- 北欧国家
- 其他欧洲地区
- 南美洲
- 巴西
- 阿根廷
- 哥伦比亚
- 其他南美洲
- 中东和非洲
- 沙乌地阿拉伯
- 阿拉伯聯合大公国
- 卡达
- 埃及
- 南非
- 奈及利亚
- 其他中东和非洲地区
- 亚太地区
第六章 竞争情势
- 市场集中度
- 策略趋势
- 市占率(%)/排名分析
- 公司简介
- ANWIL SA
- BorsodChem(Wanhua)
- Ciner Group
- Covestro AG
- Dow
- Ercros SA
- Formosa Plastics Corporation
- Genesis Energy, LP
- Hanwha Group
- INEOS
- Kemira
- MicroBio
- Nirma
- Nobian(Reyez)
- Occidental Petroleum Corporation
- Olin Corporation
- PCC SE
- Shin-Etsu Chemical Co., Ltd
- Sisecam
- Solvay
- Spolchemie
- Tata Chemicals Ltd
- Tosoh Corporation
- Vynova Group
- Westlake Corporation
第七章 市场机会与未来展望
Chlor-alkali market size in 2026 is estimated at 286.25 Million tons, growing from 2025 value of 277.94 Million tons with 2031 projections showing 331.68 Million tons, growing at 2.99% CAGR over 2026-2031.
Momentum stems from persistent PVC build-outs, widening water-treatment coverage, and escalating alumina demand for electric-vehicle battery materials. Unique co-product balances between chlorine, caustic soda, and soda ash tighten supply-demand linkages, prompting producers to align operating rates with downstream pull signals. Renewed investment in membrane electrolysis is lowering unit power consumption, while renewable-electricity contracts cushion electricity cost volatility. At the same time, regulatory scrutiny over mercury cell retirements and carbon emissions compels sustained capital deployment into cleaner technology platforms.
Global Chlor-alkali Market Trends and Insights
Surging PVC Capacity Additions in Asia
PVC additions across China, India, and Southeast Asia underpin forward chlorine offtake, even as real-estate softness tempers near-term volumes. PCC Group is investing USD 340 million in a chlor-alkali complex inside Chemours' Mississippi site that will supply 340,000 tons of annual capacity by 2028. India's antidumping duties on imported PVC stimulate domestic builds that translate directly into incremental chlorine pull, while ASEAN producers gain from supply-chain diversification. Each new PVC line obliges fixed electrochemical chlorine-to-PVC ratios, so merchant chlorine availability outside the chain tightens, reinforcing regional price premiums. Localized oversupply pockets have therefore triggered logistics shifts toward export pipelines from coastal Chinese hubs into the wider Asia-Pacific chlor-alkali market.
Rising Alumina Output for EV-Grade Aluminium
Battery-grade aluminum calls for ultra-low impurity alumina, which in turn demands high-specification caustic soda. Indonesian alumina ventures are scrambling for secured caustic supply, underscoring the strategic need for integrated chlor-alkali-alumina corridors. Regional mismatch between bauxite deposits, refining basins, and co-located electrolysis capacity inflates freight outlays, incentivizing on-site chlor-alkali plant tie-ups. Producers serving this differentiated caustic pool earn premium margins because purity specs exceed commodity thresholds. Long-haul shipments of concentrated caustic soda face handling constraints, so nearby membrane assets secure an embedded cost edge.
High Power Tariffs and Grid Volatility
Electricity price spikes tied to natural-gas benchmarks have eroded European chlor-alkali margins, spurring partial shutdowns and capacity relocations. Emerging-market grids add operational complexity as voltage dips mandate expensive uninterruptible power systems. Producers able to curtail load during peak tariffs and ramp during off-peak renewables gain a crucial cost hedge. Thailand's gas depletion exemplifies how upstream constraints cascade into power scarcity, amplifying working-capital swings for chlor-alkali operators.
Other drivers and restraints analyzed in the detailed report include:
- Booming Water and Wastewater Treatment Projects
- Capacity-Linked Renewable-Energy Incentives
- Stringent Carbon-Footprint Regulations
For complete list of drivers and restraints, kindly check the Table Of Contents.
Segment Analysis
Chlorine held a 40.85% share of the chlor-alkali market in 2025 and will outpace co-products at a 3.35% CAGR to 2031. Accelerated PVC polymerization capacity in Asia and the Middle East locks in a dependable offtake corridor for every incremental ton of chlorine produced. Water-treatment upgrades across municipal grids layer on additional chlorine derivative demand, assuring more stable run-rates for integrated producers.
Caustic soda, while trailing chlorine in share, secures steady lift from alumina refiners and pulp processors that often engage in multi-year offtake contracts to hedge price risk. Meanwhile, green hydrogen valorization strategies turn the once-vented hydrogen co-product into a revenue contributor, especially where policy support exists. Collectively, diversified end-uses stabilize returns and moderate earnings cyclicality across the chlor-alkali market.
The Chlor-Alkali Report is Segmented by Product (Caustic Soda, Chlorine, and Soda Ash), Production Process (Membrane Cell, Diaphragm Cell, and Other Processes), Application (Pulp and Paper, Organic Chemicals, Inorganic Chemicals, Soaps and Detergents, and More), and Geography (Asia-Pacific, North America, Europe, South America, and Middle-East and Africa). The Market Forecasts are Provided in Terms of Volume (Units).
Geography Analysis
Asia-Pacific retained 62.15% of the chlor-alkali market size in 2025 and is projected to compound at a 3.12% CAGR through 2031. China's manufacturing backbone, from PVC to electronics, embeds robust chlorine and caustic soda pull, even as regional real-estate cooling tempers immediate PVC resin consumption. India's infrastructure binge, spanning rail, metro, and sanitation, stimulates both vinyl pipe uptake and municipal water treatment, locking in multiyear demand visibility.
North America holds a stable share, benefiting from shale-derived ethylene cost advantages that safeguard PVC competitiveness. Municipal water utilities continue renewing decades-old treatment plants, lifting chlorine derivative throughput. Long-term renewable PPAs in Texas and Alberta enable lower emissions footprints for membrane retrofits, enhancing regional operator resilience.
Europe grapples with elevated power tariffs and stringent carbon regimes that have pressured several older diaphragm units into mothballing. Yet specialty chemical niches, stringent potable-water standards, and high-margin pharmaceutical precursors sustain a baseline of local demand, ensuring Europe remains a sizable import destination.
South America's growth rests on Brazilian pulp expansion and mining chemicals in Chile and Peru, while Middle-East and Africa witness selective megaprojects such as Befar Group's USD 500 million Egyptian complex targeting both domestic uses and African export lanes.
- ANWIL SA
- BorsodChem (Wanhua)
- Ciner Group
- Covestro AG
- Dow
- Ercros SA
- Formosa Plastics Corporation
- Genesis Energy, L.P.
- Hanwha Group
- INEOS
- Kemira
- MicroBio
- Nirma
- Nobian (Reyez)
- Occidental Petroleum Corporation
- Olin Corporation
- PCC SE
- Shin-Etsu Chemical Co., Ltd
- Sisecam
- Solvay
- Spolchemie
- Tata Chemicals Ltd
- Tosoh Corporation
- Vynova Group
- Westlake Corporation
Additional Benefits:
- The market estimate (ME) sheet in Excel format
- 3 months of analyst support
TABLE OF CONTENTS
1 Introduction
- 1.1 Study Assumptions and Market Definition
- 1.2 Scope of the Study
2 Research Methodology
3 Executive Summary
4 Market Landscape
- 4.1 Market Overview
- 4.2 Market Drivers
- 4.2.1 Surging PVC Capacity Additions in Asia
- 4.2.2 Rising Alumina Output for EV-Grade Aluminium
- 4.2.3 Booming Water and Wastewater Treatment Projects
- 4.2.4 Capacity-Linked Renewable-Energy Incentives
- 4.2.5 Surging Demand in Chemical Manufacturing
- 4.3 Market Restraints
- 4.3.1 High Power Tariffs and Grid Volatility
- 4.3.2 Stringent Carbon-Footprint Regulations
- 4.3.3 Brine-Disposal Compliance Costs
- 4.4 Value Chain Analysis
- 4.5 Porter's Five Forces
- 4.5.1 Bargaining Power of Suppliers
- 4.5.2 Bargaining Power of Buyers
- 4.5.3 Threat of New Entrants
- 4.5.4 Threat of Substitutes
- 4.5.5 Degree of Competition
- 4.6 Import and Export Trends
5 Market Size and Growth Forecasts (Volume)
- 5.1 By Product
- 5.1.1 Caustic Soda
- 5.1.2 Chlorine
- 5.1.3 Soda Ash
- 5.2 By Production Process
- 5.2.1 Membrane Cell
- 5.2.2 Diaphragm Cell
- 5.2.3 Other Processes
- 5.3 By Application
- 5.3.1 Pulp and Paper
- 5.3.2 Organic Chemicals
- 5.3.3 Inorganic Chemicals
- 5.3.4 Soaps and Detergents
- 5.3.5 Alumina
- 5.3.6 Textiles
- 5.3.7 Other Applications
- 5.4 By Geography
- 5.4.1 Asia-Pacific
- 5.4.1.1 China
- 5.4.1.2 India
- 5.4.1.3 Japan
- 5.4.1.4 South Korea
- 5.4.1.5 Indonesia
- 5.4.1.6 Thailand
- 5.4.1.7 Malaysia
- 5.4.1.8 Vietnam
- 5.4.1.9 Rest of Asia-Pacific
- 5.4.2 North America
- 5.4.2.1 United States
- 5.4.2.2 Canada
- 5.4.2.3 Mexico
- 5.4.3 Europe
- 5.4.3.1 Germany
- 5.4.3.2 United Kingdom
- 5.4.3.3 France
- 5.4.3.4 Italy
- 5.4.3.5 Spain
- 5.4.3.6 Turkey
- 5.4.3.7 Russia
- 5.4.3.8 Nordic Countries
- 5.4.3.9 Rest of Europe
- 5.4.4 South America
- 5.4.4.1 Brazil
- 5.4.4.2 Argentina
- 5.4.4.3 Colombia
- 5.4.4.4 Rest of South America
- 5.4.5 Middle-East and Africa
- 5.4.5.1 Saudi Arabia
- 5.4.5.2 United Arab Emirates
- 5.4.5.3 Qatar
- 5.4.5.4 Egypt
- 5.4.5.5 South Africa
- 5.4.5.6 Nigeria
- 5.4.5.7 Rest of Middle-East and Africa
- 5.4.1 Asia-Pacific
6 Competitive Landscape
- 6.1 Market Concentration
- 6.2 Strategic Moves
- 6.3 Market Share (%)/Ranking Analysis
- 6.4 Company Profiles (includes Global level Overview, Market level overview, Core Segments, Financials as available, Strategic Information, Market Rank/Share, Products and Services, Recent Developments)
- 6.4.1 ANWIL SA
- 6.4.2 BorsodChem (Wanhua)
- 6.4.3 Ciner Group
- 6.4.4 Covestro AG
- 6.4.5 Dow
- 6.4.6 Ercros SA
- 6.4.7 Formosa Plastics Corporation
- 6.4.8 Genesis Energy, L.P.
- 6.4.9 Hanwha Group
- 6.4.10 INEOS
- 6.4.11 Kemira
- 6.4.12 MicroBio
- 6.4.13 Nirma
- 6.4.14 Nobian (Reyez)
- 6.4.15 Occidental Petroleum Corporation
- 6.4.16 Olin Corporation
- 6.4.17 PCC SE
- 6.4.18 Shin-Etsu Chemical Co., Ltd
- 6.4.19 Sisecam
- 6.4.20 Solvay
- 6.4.21 Spolchemie
- 6.4.22 Tata Chemicals Ltd
- 6.4.23 Tosoh Corporation
- 6.4.24 Vynova Group
- 6.4.25 Westlake Corporation
7 Market Opportunities and Future Outlook
- 7.1 White-space and Unmet-need Assessment
 氯碱市场分析及预测(至2035年):类型、产品类型、应用、技术、最终用户、製程、材料类型、设备、功能
 2026年全球氯碱市场报告
 氯碱设备市场规模、占有率、成长及全球产业分析:依类型、应用和地区划分的洞察与预测(2026-2034)
 日本氯碱市场报告(按产品、生产流程、应用和地区划分,2026-2034年)
 氯碱市场规模、份额及成长分析(按类型、生产流程及地区划分)-2026-2033年产业预测2025-2033年氯碱市场报告(依产品、生产流程、应用及地区)
 2018-2034年全球氯碱市场需求及预测分析
 氯碱市场-全球产业规模、份额、趋势、机会和预测(按产品类型、应用、地区和竞争细分,2020-2030 年)
 氯碱设备市场报告:2030 年趋势、预测与竞争分析