


 |
市场调查报告书
商品编码
1940641
铝罐:市场占有率分析、产业趋势与统计、成长预测(2026-2031)Aluminum Cans - Market Share Analysis, Industry Trends & Statistics, Growth Forecasts (2026 - 2031) |
||||||
※ 本网页内容可能与最新版本有所差异。详细情况请与我们联繫。
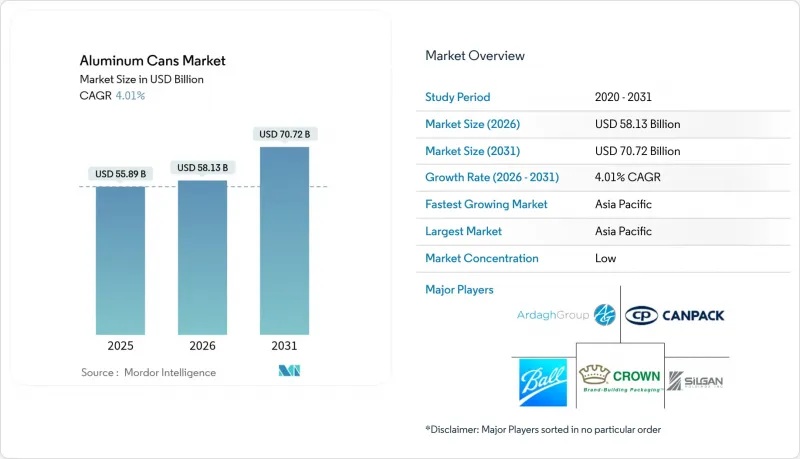
全球铝罐市场预计到 2026 年将价值 581.3 亿美元,高于 2025 年的 558.9 亿美元,预计到 2031 年将达到 707.2 亿美元。
预计从 2026 年到 2031 年,其复合年增长率将达到 4.01%。
持续的政策压力推动循环包装的普及,饮料製造商迅速从PET和玻璃包装转向铝罐,以及高成长地区的产能扩张,共同促成了铝罐市场的稳定成长。欧盟的押金返还机制确保到2029年实现90%的回收率,显着改善了回收的经济效益,促使品牌所有者和加工商加快对闭合迴路生产的投资。亚太地区将继续保持主导地位,这主要得益于都市区可支配收入的成长;而北美和欧洲将利用优质化和不断变化的永续性需求来支撑价值成长。儘管产能瓶颈依然存在,但近期的一些收购和新工厂建设预计将逐步改善供需平衡。同时,高端饮料的推出、葡萄酒罐的倡议以及电商对防凹陷包装的需求,也为铝罐市场的发展提供了额外的推动力,使其应用范围远远超出传统的碳酸饮料领域。
全球铝罐市场趋势与洞察
高可回收性和闭合迴路收集系统
铝材能够永久保持其冶金性能,从而实现塑胶或玻璃无法企及的真正材料循环利用。根据美国罐头製造商协会统计,迄今生产的所有铝材中,75%仍在继续使用,而再生铝的重熔比原生铝冶炼所需的能源减少了95%。欧洲冶炼企业康斯坦铝业(Constellium)、埃尔瓦尔(Elval)、诺贝丽斯(Novelis)和斯佩拉(Speyra)于2024年4月统一了合金规格,使得饮料罐的生产能够使用高达100%的再生材料。这每吨金属可减少2.6吨二氧化碳排放,并降低致力于实现科学气候目标的填充企业的营运成本。儘管美国的回收率在2023年下降至43%,但产业主导的投资旨在到2030年将其恢復到70%,到2050年恢復到90%,从而确保製罐厂的长期原材料供应安全。欧洲、加拿大和美国部分州已实施押金返还计划,每年处理超过400亿个容器,显着提高了回收量。这将降低废料溢价,并提高一体化製罐企业的利润率。这些结构性优势相结合,预计将推动复合年增长率达到1.2个百分点,巩固铝作为循环饮料包装的理想地位。
由于生产者责任延伸制度和塑胶税政策,PET/玻璃材料正向铝材过渡。
生产者延伸责任制(EPR)从根本上重塑了材料成本层级。英国2025年的EPR基准费率设定为每吨铝266英镑,远低于PET、多层包装袋或难以回收的软包装的附加税。加州于2024年1月将容器回收计画扩展至葡萄酒和烈酒,即时使适用的饮料罐市场每年增加4亿个。同时,欧盟法规要求在2029年一次性饮料容器的回收率达到90%,这项标准由于铝的消费后回收价值高而对铝极为有利。澳洲要求到2040年食品级铝的再生材料含量达到80%,也增强了全部区域铝的需求前景。这些政策综效提升了铝的吸引力,促使中期成长预测值上调1.5个百分点。
来自柔性PET和纸盒包装的竞争
多层纸盒和轻质宝特瓶将继续占据主导地位,尤其是在价格敏感的细分市场,例如自有品牌果汁、乳类饮料和常温水,这些品牌所有者更注重单位成本而非可回收性。新型乙二醇改质技术正在延长PET瓶在碳酸饮料和营养敏感型混合饮料中的保质期,从而削弱铝的性能优势。在开发中国家,消费者为永续性支付溢价的意愿仍然较低,限制了其在商品化品类中的应用。然而,欧盟和加拿大对不可可再生塑胶包装的禁令,以及日益严格的生产者延伸责任制(EPR)标准,将逐步削弱软包装的竞争优势。预计这将暂时影响铝罐市场在2025年至2027年间的复合年增长率,使其下降0.8%。
细分市场分析
到2025年,标准330毫升和355毫升罐装饮料将占总收入的55.38%,这主要得益于它们与填充线的兼容性、最快的生产线速度以及最佳的托盘密度。此外,该细分市场也受惠于终端用户的高度认可,有助于降低全球装瓶商的转换成本。然而,以250毫升和310毫升为代表的细长罐装饮料正以4.06%的复合年增长率快速增长,这主要归功于其更佳的视觉效果以及在拥挤的零售货架上更醒目的标识。开发机能饮料、低卡路里和即饮酒精饮料产品的公司重视细长罐装,因为它可以带来差异化的货架空间和在冷藏柜中更高的可见度。 Ball公司的Dynamark可变图形平台使行销人员能够在标准罐和细长罐装饮料上部署专属设计,而无需停机,从而降低库存风险并提高宣传活动的灵活性。随着印刷技术的进步导致单位成本下降,预计细长罐装饮料将在高利润SKU中获得更高的市场份额。特殊形状和纹理压花工艺尚处于起步阶段,但体现了不断创新以进一步丰富消费者体验的趋势。预计整个铝罐市场将继续呈现标准量产规格和纤薄高端规格并存的局面,其中后者相对于产能将带来更高的收入成长。
标准罐仍具有更优的物流经济效益。一箱24罐355毫升的罐装饮料比同等规格的玻璃包装轻20%,从而减少了运输排放,并降低了零售商在货架上堆放饮料时造成人员受伤的风险。自1990年代以来采用的厚规格铝罐,即使在金属价格上涨的情况下,也为加工商提供了稳定的利润率。然而,在註重视觉衝击力和健康理念的生活方式导向市场中,品牌所有者已表现出愿意承担精製罐略微增加的成本,因为在这些市场中,每盎司的价值比视觉衝击力和健康理念更为重要。到2030年,精製罐预计将获得两位数的市场份额,从而丰富包装产品组合,同时保持与现有生产线设备的向下兼容性。这种罐型多样化增强了铝罐市场的整体韧性,并降低了希望进入细分饮料市场的装瓶商的转换成本。
到2025年,饮料业将占全球销售额的48.35%,这反映了碳酸饮料与轻质金属包装之间长达一个世纪的共生关係。碳酸饮料、能量饮料和运动饮料仍然是核心产品,确保了罐板轧延厂的规模经济效益。含酒精气泡水、CBD注入的滋补饮品和氮气咖啡的持续两位数增长将进一步拓宽饮料品类,即使在主流碳酸饮料销量下滑的淡季,也能使罐体生产线接近满负荷运作。同时,从除臭剂到喷雾油等气雾剂产品预计将以5.21%的复合年增长率成长,成为铝罐市场中成长最快的细分市场。品牌拥有者重视铝的耐腐蚀性,克服了马口铁罐在含有油、推进剂和酒精的配方中常见的劣化问题。增强型墙面熨烫技术可承受高达 18 巴的压力,使慕斯、颜料和鲜奶油容器能够膨胀。
宠物食品和人类罐头食品的市占率虽小,但全年需求稳定,这得益于存货周转和紧急囤货。 Silgan Holdings 预计 2024 年宠物食品罐头销售将达到两位数成长,显示高端宠物食品与金属的氧气阻隔性能相契合。医药和营养补充品应用是新的成长领域,充分利用了小容量管瓶的防窜改和精确称重特性。终端用户多元化进一步增强了铝罐市场免受单一品类疲软的影响,同时提供了多个成长点,可以分摊製造成本并加速资产回报。
区域分析
亚太地区占全球铝罐销售额的40.74%,预计到2031年,该地区的铝罐市场将以每年5.52%的速度成长。这主要得益于中国、印度和日本中产阶级可支配收入的增加、都市区追求便利的消费文化以及对一次性塑胶製品日益严格的监管。中国凭藉其自主轧延能力和蓬勃发展的国内饮料产业,摆脱了对进口的依赖,继续保持领先地位。印度铝业公司(Hindalco)100亿美元的扩张计画将扩大印度国内金属供应,加速当地可乐、能量饮料和预调酒生产商采用铝罐。日本成熟的饮料市场正在推动高端茶和精品咖啡罐的创新,朝日集团的净零排放承诺正在推动采购转型。东南亚市场也蓬勃发展,暹罗联合钢铁公司(NS-Siam United Steel)投资5,850万美元扩大其镀锡钢板生产,并与海外铝罐钢板供应商合作。这显示钢铁和铝供应链可以走一条共同发展的道路。
北美地区是全球第二大铝罐市场,但其出货量已趋于稳定。该地区正致力于转向利润率更高的产品,例如高端纤细罐和特殊感温变色罐。 2023年,波尔公司出货约490亿个铝罐,占该地区铝罐市占率的36%。随着回收系统的扩展,其再生材料含量显着提高。美国各州容器押金计画的扩大以及加拿大生产者延伸责任制(EPR)的实施,增强了再生废弃物的供应,使罐体板材的再生材料含量达到历史新高。这降低了加工商的金属采购成本。
儘管欧洲市场已趋于成熟,但仍在大力推动监管倡议,以加速从PET材质转向铝材质的转变。随着欧盟90%回收率目标的临近,品牌商正在预付多年铝罐供应合约款项以符合要求,从而稳定了加工商的订单量。即将实施的英国押金订单计画每年将使140亿个金属容器进入循环经济体系,并增强原料供应的稳定性。德国和法国正积极试行罐装葡萄酒,拓展在啤酒市场以外的业务。这些因素正促使欧洲製造商增加产能、提高生产线速度并整合当地可再生能源,即使产量仅略有成长,也能确保该地区铝罐市场的价值成长。
其他福利:
- Excel格式的市场预测(ME)表
- 3个月的分析师支持
目录
第一章 引言
- 研究假设和市场定义
- 调查范围
第二章调查方法
第三章执行摘要
第四章 市场情势
- 市场概览
- 市场驱动因素
- 高可回收性和闭合迴路收集系统
- 由于生产者延伸责任制(EPR)和塑胶税政策,PET/玻璃材质正转向铝材质。
- 即饮饮料、精酿饮料和机能饮料市场快速成长
- 适用于罐装包装的葡萄酒和烈酒包装市场快速成长
- 电子商务对耐衝击初级包装的需求
- 市场限制
- 来自柔性PET和纸盒包装形式的竞争
- 原生铝价格和供应波动
- 区域罐头製造能力瓶颈
- 范围 3 脱碳成本上升
- 产业供应链分析
- 监管环境
- 技术展望
- 波特五力分析
- 供应商的议价能力
- 买方的议价能力
- 新进入者的威胁
- 替代品的威胁
- 竞争对手之间的竞争
第五章 市场规模与成长预测
- 按类型
- 标准
- 光滑
- 苗条的
- 其他类型
- 按最终用户行业划分
- 饮料
- 酒精饮料
- 不含酒精的饮料
- 食物
- 罐头食品
- 宠物食品(湿粮和零食)
- 气雾剂
- 其他终端用户产业
- 饮料
- 按结构
- 2 件
- 3 件
- 按产能
- 少于250毫升
- 251-500 ml
- 500毫升或以上
- 按地区
- 北美洲
- 我们
- 加拿大
- 墨西哥
- 南美洲
- 巴西
- 阿根廷
- 智利
- 南美洲其他地区
- 欧洲
- 英国
- 德国
- 法国
- 义大利
- 西班牙
- 俄罗斯
- 其他欧洲地区
- 亚太地区
- 中国
- 印度
- 日本
- 韩国
- 澳洲
- 马来西亚
- 亚太其他地区
- 中东和非洲
- 中东
- 沙乌地阿拉伯
- 阿拉伯聯合大公国
- 土耳其
- 其他中东地区
- 非洲
- 南非
- 奈及利亚
- 其他非洲地区
- 中东
- 北美洲
第六章 竞争情势
- 市场集中度
- 策略趋势
- 市占率分析
- 公司简介
- Ball Corporation
- Crown Holdings Inc.
- Ardagh Group SA
- Silgan Holdings Inc.
- CAN-PACK SA
- Novelis Inc.
- ORG Technology Co. Ltd.
- Toyo Seikan Group Holdings Ltd.
- CPMC Holdings Limited
- Baosteel Packaging Co. Ltd.
- Envases Universales
- Tecnocap Group
- CCL Container Inc.
- Massilly Holding SAS
- Nampak Ltd.
- Saudi Arabia Packaging Industry(SAPIN)
- Can-One Berhad
- Alltub Deutschland GmbH
- Baofeng Group Co. Ltd.
- Trivium Packaging BV
第七章 市场机会与未来展望
The global aluminum cans market size in 2026 is estimated at USD 58.13 billion, growing from 2025 value of USD 55.89 billion with 2031 projections showing USD 70.72 billion, growing at 4.01% CAGR over 2026-2031.
Sustained policy pressure favoring circular packaging, rapid adoption by beverage producers shifting away from PET and glass, and capacity additions in high-growth regions collectively underpin this steady expansion. Deposit return systems that guarantee 90% collection by 2029 across the European Union sharply improve recycling economics, prompting brand owners and converters to accelerate investments in closed-loop can manufacturing. Asia Pacific retains its leadership position thanks to rising urban disposable incomes, while North America and Europe leverage premiumization and evolving sustainability mandates to support value growth. Capacity bottlenecks persist, yet recent acquisitions and greenfield builds point to a gradually improving supply balance. At the same time, premium beverage launches, wine-in-can initiatives, and e-commerce demand for dent-resistant formats create additional tailwinds that lift the aluminum cans market well beyond traditional carbonated soft drink applications.
Global Aluminum Cans Market Trends and Insights
High Recyclability and Closed-Loop Recovery Systems
Aluminum retains its metallurgical properties indefinitely, enabling genuine material circularity that plastic and glass cannot match. The Can Manufacturers Institute notes that 75% of all aluminum ever produced remains in active use today, and remelting secondary aluminum consumes 95% less energy than primary smelting. European smelters Constellium, Elval, Novelis, and Speira harmonized alloy specifications in April 2024 to allow beverage cans with up to 100% recycled content, cutting carbon emissions by 2.6 tons of CO2 per ton of metal and lowering operating costs for fillers committed to science-based climate targets. U.S. recycling rates slipped to 43% in 2023, but industry-backed investments aim to lift recovery to 70% by 2030 and 90% by 2050, ensuring long-term feedstock security for can plants. Deposit return programs covering more than 40 billion containers annually in Europe, Canada, and select U.S. states materially raise collection volumes, translating into lower scrap premiums and stronger margins for integrated can makers. These structural advantages collectively add 1.2 percentage points to forecast CAGR, cementing aluminum's reputation as the definitive circular beverage package.
Shift from PET/Glass to Aluminum Amid EPR and Plastics-Tax Mandates
Extended Producer Responsibility schemes fundamentally reshape material cost hierarchies. The United Kingdom's 2025 base EPR fee is set at GBP 266 per tonne for aluminum, far below levies applied to PET, multilayer pouches, or difficult-to-recycle flexibles. California expanded its Container Redemption Value program to wine and spirits in January 2024, immediately widening the addressable beverage can universe by 400 million units a year. Meanwhile, EU rules compel 90% collection of single-use beverage containers by 2029, a benchmark that heavily favors aluminum due to its high post-consumer scrap value. Australia will require 80% recycled content in food-grade aluminum by 2040, again reinforcing demand visibility along the entire Pacific Rim. These converging policies collectively boost aluminum's attractiveness and inject an additional 1.5 percentage point lift into medium-term growth forecasts.
Competition from Flexible PET and Carton Formats
Multilayer cartons and lightweight PET bottles continue to dominate price-sensitive segments, especially for private-label juices, dairy drinks, and shelf-stable water, where brand owners prioritize unit cost over recyclability. New glycol-modification techniques have extended PET shelf life for carbonation and sensitive nutrient blends, narrowing aluminum's functional advantage. In developing economies, consumer willingness to pay sustainability premiums remains low, restraining penetration in commoditized categories. However, upcoming bans on non-recyclable plastic formats across the EU and Canada, alongside hard-to-reach EPR thresholds, will gradually erode the competitive edge of flexibles. Net effect is a temporary 0.8% drag on the aluminum cans market CAGR from 2025-2027.
Other drivers and restraints analyzed in the detailed report include:
- Boom in RTD, Craft, and Functional Beverages
- Rapid Growth of Can-Friendly Wine and Spirits Packaging
- Price and Supply Volatility of Primary Aluminum
For complete list of drivers and restraints, kindly check the Table Of Contents.
Segment Analysis
Standard 330-mL and 355-mL bodies retained 55.38% of 2025 revenue, a share underpinned by filling-line compatibility, the highest line speeds, and optimal pallet density. The segment also capitalizes on broad end-user familiarity, which reduces changeover costs for global bottlers. Nevertheless, sleek cans, typified by 250-mL and 310-mL footprints, are advancing swiftly at a 4.06% CAGR thanks to their premium visual ratio and enhanced billboard effect in crowded retail aisles. Beverage formulators serving functional, low-calorie, and alcohol-ready-to-drink segments prize the elongated profile for differentiated shelf blocking and cold-box visibility. Ball's Dynamark variable-graphics platform lets marketers design limited-run art across both standard and sleek formats without line-stopovers, trimming inventory risk and fostering campaign agility. As printing technology lowers per-unit cost, sleek cans should secure incremental penetration in higher-margin SKUs. Specialty shapes and tactile embossing remain nascent but reflect ongoing innovation that further enriches consumer experience. Altogether, the aluminum cans market expects continued coexistence of standard mass-volume formats and sleek premium variants, with the latter responsible for outsized revenue gains relative to capacity installed.
Standard bodies still benefit from superior logistics economics: a 24-count case of 355-mL cans weighs 20% less than an equivalent glass pack, cutting freight emissions and reducing shelf-stack injuries for retailers. Their thicker gauge, tooled since the 1990s, affords converters a stable margin capture even at high metal premiums. Yet brand owners are willing to absorb a slight cost uplift for sleek cans targeting lifestyle positioning where visual disruption and perceived health cues trump per-ounce value. By 2030, sleek units are likely to reach double-digit market share, adding breadth to packaging portfolios while maintaining backward compatibility with legacy line equipment. As such, type diversification reinforces the broader aluminum cans market's resilience and keeps switching costs low for bottlers contemplating entry into niche beverage sub-categories.
Beverages claimed 48.35% of global revenues in 2025, mirroring a century-long symbiosis between carbonated drinks and lightweight metal containers. Carbonated soft drinks, energy shots, and sports hydration products remain workhorse volumes that secure economies of scale for can-sheet rolling mills. Sustained double-digit launches of spiked seltzers, CBD-infused tonics, and nitro-coffee further widen beverage category breadth, allowing can lines to run at near-full utilization even during off-season contractions for mainstream sodas. Meanwhile, aerosol fillings from deodorants to cooking sprays are forecast to post a 5.21% CAGR, marking them the fastest mover within the aluminum cans market. Brand owners appreciate aluminum's corrosion resistance for formulations containing oils, propellants, or alcohols that degrade tinplate alternatives. Enhanced wall ironing processes enable pressure ratings up to 18 bar, paving the way for mousse, paint, and whipped-cream formats as well.
Pet food and human canned foods hold a smaller slice but deliver stable year-round demand anchored in inventory rotation and emergency-stock purchasing behaviors. Silgan Holdings witnessed double-digit pet food can revenue growth in 2024, illustrating premium pet nutrition's alignment with metal's oxygen-barrier features. Pharmaceutical and nutraceutical applications occupy an emerging frontier, leveraging tamper-evidence and precise metering features of small-volume aluminum vials. Collectively, end-user diversification further insulates the aluminum cans market against single-category downturns while providing multiple growth vectors that absorb manufacturing overhead and accelerate asset payback.
The Aluminum Cans Market Report is Segmented by Type (Standard, Sleek, Slim, and More), End-User Industry (Beverage [Alcoholic Beverages, and Non-Alcoholic Beverages], Food [Canned Food, and Pet Food], Aerosol, and More), Structure (2-Piece, and 3-Piece), Capacity (Up To 250 Ml, 251-500 Ml, and Above 500 Ml), and Geography (North America, Europe, Asia Pacific, and More). The Market Forecasts are Provided in Terms of Value (USD).
Geography Analysis
Asia Pacific contributes 40.74% of global sales, and its aluminum cans market size is projected to advance 5.52% annually to 2031, underwritten by rising middle-class disposable incomes, urban convenience culture, and authoritative restrictions on single-use plastics in China, India, and Japan. China retains pole position with in-house rolling capacity and a vibrant domestic beverage sector that collectively eclipses import dependence. Hindalco's USD 10 billion expansion amplifies India's domestic metal supply in anticipation of can adoption by local cola, energy drink, and alcopop producers. Japan's mature beverage environment spurs innovation in premium tea and craft coffee cans, aided by Asahi Group's net-zero pledges driving procurement switch-overs. Southeast Asia is equally dynamic; NS-Siam United Steel allocated USD 58.5 million to bolster tinplate output, yet concurrently partners with foreign can-sheet suppliers, signaling blended development paths for both ferrous and aluminum supply chains.
North America ranks second in absolute size, though its unit volumes plateau. Instead, the region focuses on trading up to sleek, slim, and specialty thermochromic cans that fetch higher margins. Ball shipped roughly 49 billion containers in 2023, representing 36% regional aluminum cans market share and delivering significant recycled content progress as reclamation systems scale. U.S. state-level container deposit expansions plus Canada's EPR rollouts strengthen secondary scrap supply, raising recycled content in can body sheet to record highs and lowering metal purchase costs for converters.
Europe, while mature, leans heavily on regulatory levers to accelerate modal shift from PET to aluminum. With the EU's 90% collection target looming, brand owners pre-pay for compliance by booking multi-year aluminum can supply contracts that stabilize converter order books. The United Kingdom's upcoming deposit return program will funnel 14 billion metal containers into closed-loop paths yearly, solidifying feedstock security. Germany and France aggressively promote wine-in-can pilots, expanding beyond beer's established foothold. These factors allow European producers to deploy new capacity while raising line speeds and integrating on-site renewable energy, ensuring that the aluminum cans market in the bloc grows in value even where volumes edge upward modestly.
- Ball Corporation
- Crown Holdings Inc.
- Ardagh Group S.A.
- Silgan Holdings Inc.
- CAN-PACK S.A.
- Novelis Inc.
- ORG Technology Co. Ltd.
- Toyo Seikan Group Holdings Ltd.
- CPMC Holdings Limited
- Baosteel Packaging Co. Ltd.
- Envases Universales
- Tecnocap Group
- CCL Container Inc.
- Massilly Holding S.A.S
- Nampak Ltd.
- Saudi Arabia Packaging Industry (SAPIN)
- Can-One Berhad
- Alltub Deutschland GmbH
- Baofeng Group Co. Ltd.
- Trivium Packaging B.V.
Additional Benefits:
- The market estimate (ME) sheet in Excel format
- 3 months of analyst support
TABLE OF CONTENTS
1 INTRODUCTION
- 1.1 Study Assumptions and Market Definition
- 1.2 Scope of the Study
2 RESEARCH METHODOLOGY
3 EXECUTIVE SUMMARY
4 MARKET LANDSCAPE
- 4.1 Market Overview
- 4.2 Market Drivers
- 4.2.1 High recyclability and closed-loop recovery systems
- 4.2.2 Shift from PET/glass to aluminum amid EPR and plastics-tax mandates
- 4.2.3 Boom in RTD, craft and functional beverages
- 4.2.4 Rapid growth of can-friendly wine and spirits packaging (under-reported)
- 4.2.5 E-commerce's need for dent-resistant primary packaging (under-reported)
- 4.3 Market Restraints
- 4.3.1 Competition from flexible PET and carton formats
- 4.3.2 Price and supply volatility of primary aluminum
- 4.3.3 Regional can-making capacity bottlenecks (under-reported)
- 4.3.4 Rising Scope-3 decarbonization compliance costs (under-reported)
- 4.4 Industry Supply Chain Analysis
- 4.5 Regulatory Landscape
- 4.6 Technological Outlook
- 4.7 Porter's Five Forces Analysis
- 4.7.1 Bargaining Power of Suppliers
- 4.7.2 Bargaining Power of Buyers
- 4.7.3 Threat of New Entrants
- 4.7.4 Threat of Substitutes
- 4.7.5 Intensity of Competitive Rivalry
5 MARKET SIZE AND GROWTH FORECASTS (VALUE)
- 5.1 By Type
- 5.1.1 Standard
- 5.1.2 Sleek
- 5.1.3 Slim
- 5.1.4 Other Types
- 5.2 By End-user Industry
- 5.2.1 Beverage
- 5.2.1.1 Alcoholic Beverages
- 5.2.1.2 Non-alcoholic Beverages
- 5.2.2 Food
- 5.2.2.1 Canned Food
- 5.2.2.2 Pet Food (Wet and Treats)
- 5.2.3 Aerosol
- 5.2.4 Other End-user Industries
- 5.2.1 Beverage
- 5.3 By Structure
- 5.3.1 2-piece
- 5.3.2 3-piece
- 5.4 By Capacity
- 5.4.1 Up to 250 ml
- 5.4.2 251 - 500 ml
- 5.4.3 More than 500 ml
- 5.5 By Geography
- 5.5.1 North America
- 5.5.1.1 United States
- 5.5.1.2 Canada
- 5.5.1.3 Mexico
- 5.5.2 South America
- 5.5.2.1 Brazil
- 5.5.2.2 Argentina
- 5.5.2.3 Chile
- 5.5.2.4 Rest of South America
- 5.5.3 Europe
- 5.5.3.1 United Kingdom
- 5.5.3.2 Germany
- 5.5.3.3 France
- 5.5.3.4 Italy
- 5.5.3.5 Spain
- 5.5.3.6 Russia
- 5.5.3.7 Rest of Europe
- 5.5.4 Asia Pacific
- 5.5.4.1 China
- 5.5.4.2 India
- 5.5.4.3 Japan
- 5.5.4.4 South Korea
- 5.5.4.5 Australia
- 5.5.4.6 Malaysia
- 5.5.4.7 Rest of Asia Pacific
- 5.5.5 Middle East and Africa
- 5.5.5.1 Middle East
- 5.5.5.1.1 Saudi Arabia
- 5.5.5.1.2 United Arab Emirates
- 5.5.5.1.3 Turkey
- 5.5.5.1.4 Rest of Middle East
- 5.5.5.2 Africa
- 5.5.5.2.1 South Africa
- 5.5.5.2.2 Nigeria
- 5.5.5.2.3 Rest of Africa
- 5.5.5.1 Middle East
- 5.5.1 North America
6 COMPETITIVE LANDSCAPE
- 6.1 Market Concentration
- 6.2 Strategic Moves
- 6.3 Market Share Analysis
- 6.4 Company Profiles (includes Global level Overview, Market level overview, Core Segments, Financials as available, Strategic Information, Market Rank/Share for key companies, Products and Services, and Recent Developments)
- 6.4.1 Ball Corporation
- 6.4.2 Crown Holdings Inc.
- 6.4.3 Ardagh Group S.A.
- 6.4.4 Silgan Holdings Inc.
- 6.4.5 CAN-PACK S.A.
- 6.4.6 Novelis Inc.
- 6.4.7 ORG Technology Co. Ltd.
- 6.4.8 Toyo Seikan Group Holdings Ltd.
- 6.4.9 CPMC Holdings Limited
- 6.4.10 Baosteel Packaging Co. Ltd.
- 6.4.11 Envases Universales
- 6.4.12 Tecnocap Group
- 6.4.13 CCL Container Inc.
- 6.4.14 Massilly Holding S.A.S
- 6.4.15 Nampak Ltd.
- 6.4.16 Saudi Arabia Packaging Industry (SAPIN)
- 6.4.17 Can-One Berhad
- 6.4.18 Alltub Deutschland GmbH
- 6.4.19 Baofeng Group Co. Ltd.
- 6.4.20 Trivium Packaging B.V.
7 MARKET OPPORTUNITIES AND FUTURE OUTLOOK
- 7.1 White-space and Unmet-Need Assessment
 铝罐市场报告:按应用和地区划分 2026-2034 年日本铝罐市场:规模、份额、趋势和预测:按应用、地区划分,2026-2034年
 罐装饮料支架市场:按支架类型、容量、材料、最终用途和分销管道划分,全球预测(2026-2032年)
 铝罐市场规模、份额及成长分析(按产品类型、销售、最终用途及地区划分)-2026-2033年产业预测
 铝製单体罐:全球市场份额和排名、总收入和需求预测(2025-2031 年)
 杯架市场:按产品类型、按材料、按最终用户、按分销管道、按地区
 全球铝製整体罐市场:2031 年预测
 2030 年罐架市场预测:按产品、材料、产能、设计风格、分销管道、最终用户和地区进行全球分析
 全球铝罐市场(2024-2028)