


 |
市场调查报告书
商品编码
1940686
美国智慧电视:市场占有率分析、产业趋势与统计、成长预测(2026-2031)US Smart TV - Market Share Analysis, Industry Trends & Statistics, Growth Forecasts (2026 - 2031) |
||||||
※ 本网页内容可能与最新版本有所差异。详细情况请与我们联繫。
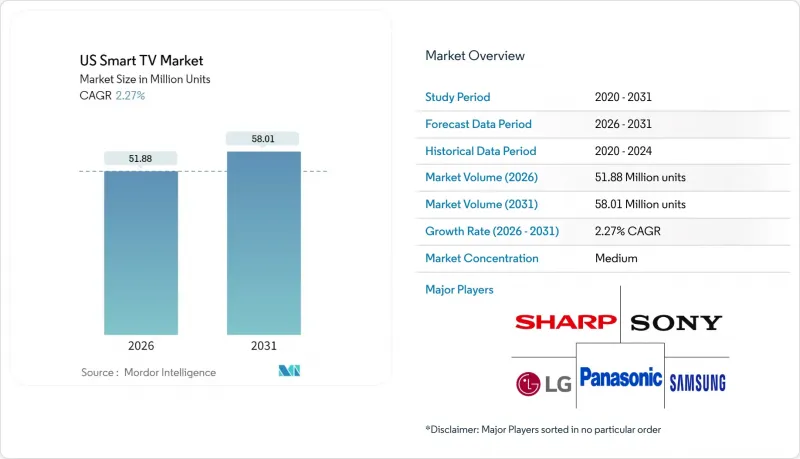
2025年美国智慧电视市场价值为5,073万台,预计2031年将达到5,801万台,高于2026年的5,188万台。
预计在预测期(2026-2031 年)内,复合年增长率将达到 2.27%。
儘管成熟消费性电子产品类别的整体成长放缓,但终端用户的需求正转向更高的影像品质、整合串流环境和游戏功能。虽然55-64吋的大尺寸电视仍然主导着主流市场,但超大萤幕(75吋以上)正成为消费者梦寐以求的购买选择。同时,面板技术创新週期的加速发展(层级构造OLED、mini-LED和新兴的RGB背光技术)正在缩短更换週期。透过联网电视(CTV)广告实现的平台获利正在抵消硬体价格上涨的影响,帮助品牌在面对来自中国新兴厂商的价格压力时保持市场份额。最后,各州层级的节能激励措施和日益严格的资料隐私法规正在推动产品研发的优先事项,凸显了美国智慧型电视市场复杂的法规环境。
美国智慧电视市场趋势与洞察
快速 4K/8K 升级週期
儘管4K超高清电视的出货量仍占一半以上,但製造商正透过推广支援8K的处理器和先进的背光技术来缩短技术週期。三星的2025年RGB Mini-LED原型机实现了OLED等级的对比度,同时保持了与LCD电视的成本竞争力。 LG的层级构造OLED架构将峰值亮度提升了40%,并克服了先前阻碍高阶机型普及的HDR限制。这些突破性进展可能会促使现有用户更快更换,尤其是在串流媒体服务和次世代游戏主机逐步提供原生8K内容的情况下。
内建串流媒体和应用生态系统
智慧型电视作业系统如今已能复製外部电视棒的功能,将应用程式商店、支付和定向广告整合到电视品牌之下。 Roku OS 仍占据最大的市场份额,但 Google TV 的成长速度最快,搜寻个人化功能显着提升了用户的观看时间。 LG 报告称,其 webOS 广告技术的收入将在 2024 年超过 1 兆韩元,这证明平台经济效益正在抵消硬体利润率下降的影响。
透过智慧型手机/平板电脑观看内容而导致的同类相食
行动装置萤幕日益占据白天的娱乐时间,限制了以往促使人们更换到更大萤幕的共用观看机会。美国联邦贸易委员会 (FTC) 2024 年的一项研究指出,串流平台过度优化其行动装置的 UI 设计,强化了单人观看的习惯。然而,游戏和优质电影内容仍然是电视的优势所在,在某种程度上缓解了这种蚕食效应。
细分市场分析
55-64吋尺寸段将保持领先地位,到2025年仍将占据34.02%的出货量份额,巩固其作为主流用户理想尺寸的地位。然而,75吋以上尺寸的电视市场将以2.69%的复合年增长率成长最快,超过美国智慧电视市场的整体成长速度。早期采用者之所以愿意以低于2000美元的促销价格购买更大尺寸的面板,是因为他们追求身临其境型的游戏体验和影院级串流媒体播放效果。三星凭藉其microLED供应链和积极的促销策略,已占据超大尺寸电视市场约三分之一的份额。同时,由于价格亲民的平板电脑和适合紧凑型住宅的窄边框中型电视的兴起,入门级45英寸以下尺寸的电视市场将持续萎缩。
安装人员报告称,无线分线盒可将安装时间缩短约 40%,从而加速现有住宅中 75 吋壁挂式萤幕的普及。能源之星 (ENERGY STAR) 的数据显示,每平方英吋的功耗下降速度快于面板面积的成长速度,这缓解了注重节能的消费者对电费的担忧。综上所述,这些趋势意味着大尺寸显示器将继续成为美国智慧型电视市场的关键驱动力。
4K 超高清已成为标配,预计到 2025 年出货量将达到 54.02%。新兴的 8K 市场预计将以 3.17% 的复合年增长率成长,这主要得益于人工智慧影像增强引擎弥补了片源不足的问题。微软的 Xbox Series X 和SONY的 PlayStation 5 Pro 将在 2025 年透过韧体更新支援 8K 输出,串流媒体服务供应商也已开始在部分市场试行 8K 视讯点播服务。为了抵消更高的价格,商家提升销售8K 面板与短期分期付款计划结合,鼓励早期采用者每三到四年更换。目前,全高清电视主要以特卖产品的形式出现在旅馆业和注重性价比的零售商处。
OLED 厂商声称,亮度提升将缩小 8K 相对于高品质 4K HDR 的优势,但调查数据显示,早期游戏玩家尤其倾向于选择 8K 电视,因为其拥有卓越的性能标竿。随着压缩转码器的成熟,8K 串流媒体的频宽开销将降低,从而消除大规模部署的最后一道技术障碍。
其他福利:
- Excel格式的市场预测(ME)表
- 分析师支持(3个月)
目录
第一章 引言
- 研究假设和市场定义
- 调查范围
第二章调查方法
第三章执行摘要
第四章 市场情势
- 市场概览
- 市场驱动因素
- 快速 4K/8K 升级週期
- 内建串流媒体和应用生态系统
- 65吋以上产品的销售量激增
- 与OEM厂商分享CTV广告收入
- 游戏优化电视功能(可变更新率、云端游戏中心)
- 符合「能源之星9.0」标准的节能产品可享税收优惠
- 市场限制
- 智慧型手机和平板电脑争夺观看时间
- 透过低成本的中国品牌降低价格
- 作业系统层面的资料隐私保护措施限制了遥测资料的价值
- 迷你LED背光灯供应链波动
- 价值链分析
- 监管环境
- 技术展望
- 波特五力模型
- 供应商的议价能力
- 买方的议价能力
- 新进入者的威胁
- 替代品的威胁
- 竞争对手之间的竞争
- 产业价值链图
第五章 市场规模与成长预测
- 按萤幕尺寸
- 小于 45 英寸
- 45 至 54 英寸
- 55 至 64 英寸
- 65 至 74 英寸
- 75吋或以上
- 按解析度类型
- HDTV
- 全高清
- 4K UHD
- 8K UHD
- 透过面板技术
- LCD/LED
- QLED
- OLED
- Mini-LED
- 按价格范围
- 低于 500 美元
- 500-999美元
- 1,000-1,999 美元
- 超过2000美元
- 按作业系统
- Roku OS
- Google/Android TV
- Tizen OS
- webOS
- Fire TV OS
- VIDAA U
第六章 竞争情势
- 市场集中度
- 策略趋势
- 市占率分析
- 供应商市场排名分析
- 公司简介
- Samsung Electronics Co., Ltd.
- LG Electronics Inc.
- Sony Group Corporation
- TCL Electronics Holdings Ltd.
- VIZIO Holding Corp.
- Hisense Group Co., Ltd.
- Panasonic Holdings Corporation
- Sharp Corporation
- Koninklijke Philips NV
- Skyworth Group Ltd.
- Xiaomi Corp.
- Amazon.com Inc.(Fire TV Devices)
- Apple Inc.(Apple TV & tvOS Integrations)
- Haier Smart Home Co., Ltd.
- Funai Electric Co., Ltd.(Magnavox/Sanyo)
- Westinghouse Electric Corp.
- Sceptre Inc.
- Insignia Systems Inc.(Insignia TV)
- JVC Kenwood Corp.
- Pioneer Corp.
- Seiki Digital Inc.
- Element Electronics LLC
- Hitachi Ltd.
- LeEco(LeTV)
- Metz Consumer Electronics GmbH
- B&O A/S(Bang & Olufsen)
第七章 市场机会与未来展望
The US Smart TV market was valued at 50.73 million units in 2025 and estimated to grow from 51.88 million units in 2026 to reach 58.01 million units by 2031, at a CAGR of 2.27% during the forecast period (2026-2031).
End-user demand is shifting toward premium picture quality, integrated streaming ecosystems, and gaming-ready features, even as overall growth moderates in a maturing consumer electronics category. The momentum behind large formats, notably 55-64 inch sets, continues to anchor mainstream volumes, while ultra-large 75-inch-plus screens turn into the primary aspirational purchase. At the same time, panel innovation cycles, 4-stack OLED, mini-LED, and emerging RGB backlighting, are shortening replacement timelines. Platform monetization through connected-TV (CTV) advertising now subsidizes hardware prices, helping brands defend unit share against aggressive price compression from new Chinese entrants. Finally, state-level energy incentives and tightening data-privacy rules both shape product development priorities, underlining the complex regulatory environment surrounding the US Smart TV market.
US Smart TV Market Trends and Insights
Rapid 4K/8K upgrade cycle
4K UHD already dominates more than half of shipments, yet manufacturers are shortening the technology cycle by mainstreaming 8K-ready processors and advanced backlighting. Samsung's RGB mini-LED prototypes shown in 2025 promise OLED-level contrast while holding LCD cost parity. LG's four-stack OLED architecture lifts peak brightness by 40%, solving HDR limitations that once slowed premium adoption. These step-changes jointly nudge existing owners toward earlier replacement, especially as streaming and next-gen consoles gradually expose 8K native content.
Built-in streaming and app ecosystems
Smart-TV operating systems now replicate the functionality of external sticks, bringing storefronts, payments, and targeted ads under the television brand. Roku OS still accounts for the largest footprint, but Google TV is the fastest riser as search personalization drives watch-time. LG reports that its webOS ad-tech revenue surpassed KRW 1 trillion in 2024, proof that platform economics increasingly offset hardware margin compression.
Smartphone/tablet viewing cannibalization
Mobile screens increasingly capture daytime entertainment minutes, limiting shared viewing occasions that traditionally justified large-screen upgrades. The Federal Trade Commission's 2024 study highlights how streaming platforms over-index their UI design for handheld devices, reinforcing single-user consumption habits. Yet gaming and premium cinematic content remain television strongholds, tempering the cannibalization effect.
Other drivers and restraints analyzed in the detailed report include:
- Surge in larger-than-65" purchases
- CTV advertising revenue sharing creates new business models
- Price compression from low-cost Chinese brands
For complete list of drivers and restraints, kindly check the Table Of Contents.
Segment Analysis
The 55-64 inch band retained a leading 34.02% shipment share in 2025, confirming its role as the mainstream sweet spot. However, the 75-inch-plus segment is set to grow fastest at 2.69% CAGR, outpacing overall US Smart TV market growth. Early adopters cite immersive gaming and theater-grade streaming as justification for purchasing panels that now cost under USD 2,000 at promotion. Samsung commands roughly one-third of ultra-large formats by leveraging its micro-LED supply chain and aggressive channel promotions. Entry-level sub-45-inch models continue sliding, squeezed by cheap tablets for personal viewing and by mid-sized sets that increasingly fit smaller apartments thanks to bezel minimization.
Installers report that wireless breakout boxes reduce setup time by almost 40%, accelerating acceptance of wall-mounted 75-inch screens in existing homes. ENERGY STAR data suggest power consumption per square inch is falling faster than panel area is rising, muting electricity-cost objections among energy-conscious buyers. Collectively, these trends mean that large-format displays will remain the headline growth driver inside the US Smart TV market.
4K UHD reached 54.02% shipment share in 2025, having already become table stakes. The nascent 8K segment is projected to post a 3.17% CAGR, aided by AI-upscaling engines that mask source-content scarcity. Microsoft's Xbox Series X and Sony's PlayStation 5 Pro both enabled 8K output in 2025 firmware updates, and streaming providers have begun test runs of 8K VOD in limited markets. Upsell tactics pair 8K panels with shorter finance plans to offset sticker shock, ensuring early adopters rotate into the pool every 3-4 years. Full-HD models now survive mainly in hospitality and price-first retail doorbusters.
OLED providers argue that brightness gains close the perceived advantage of 8K over high-quality 4K HDR, but survey data show that early gamers disproportionately choose 8K sets for their benchmarking bragging rights. As compression codecs mature, bandwidth overhead for 8K streams will fall, removing one of the last technical hurdles to mass deployment.
The US Smart TV Market Report is Segmented by Screen Size (Up To 45", 45-54", 55-64", 65-74", 75" & Above), Resolution Type (HDTV, Full HD, 4K UHD, 8K UHD), Panel Technology (LCD/LED, QLED, OLED, Mini-LED), Price Band (less Than USD 500, USD 500-999, and More), Operating System (Roku OS, Google/Android TV, and More), and Geography. The Market Forecasts are Provided in Terms of Volume (Units).
List of Companies Covered in this Report:
- Samsung Electronics Co., Ltd.
- LG Electronics Inc.
- Sony Group Corporation
- TCL Electronics Holdings Ltd.
- VIZIO Holding Corp.
- Hisense Group Co., Ltd.
- Panasonic Holdings Corporation
- Sharp Corporation
- Koninklijke Philips N.V.
- Skyworth Group Ltd.
- Xiaomi Corp.
- Amazon.com Inc. (Fire TV Devices)
- Apple Inc. (Apple TV & tvOS Integrations)
- Haier Smart Home Co., Ltd.
- Funai Electric Co., Ltd. (Magnavox/Sanyo)
- Westinghouse Electric Corp.
- Sceptre Inc.
- Insignia Systems Inc. (Insignia TV)
- JVC Kenwood Corp.
- Pioneer Corp.
- Seiki Digital Inc.
- Element Electronics LLC
- Hitachi Ltd.
- LeEco (LeTV)
- Metz Consumer Electronics GmbH
- B&O A/S (Bang & Olufsen)
Additional Benefits:
- The market estimate (ME) sheet in Excel format
- 3 months of analyst support
TABLE OF CONTENTS
1 INTRODUCTION
- 1.1 Study Assumptions and Market Definition
- 1.2 Scope of the Study
2 RESEARCH METHODOLOGY
3 EXECUTIVE SUMMARY
4 MARKET LANDSCAPE
- 4.1 Market Overview
- 4.2 Market Drivers
- 4.2.1 Rapid 4K/8K upgrade cycle
- 4.2.2 Built-in streaming and app ecosystems
- 4.2.3 Surge in larger-than-65" purchases
- 4.2.4 CTV advertising-revenue sharing with OEMs
- 4.2.5 Gaming-optimized TV features (VRR, cloud gaming hubs)
- 4.2.6 Energy-efficiency tax incentives for "ENERGY STAR 9.0" sets
- 4.3 Market Restraints
- 4.3.1 Smartphone/tablet viewing cannibalization
- 4.3.2 Price compression from low-cost Chinese brands
- 4.3.3 OS-level data-privacy pushback curbing telemetry value
- 4.3.4 Supply-chain volatility in mini-LED backlights
- 4.4 Value Chain Analysis
- 4.5 Regulatory Landscape
- 4.6 Technological Outlook
- 4.7 Porter's Five Forces
- 4.7.1 Bargaining Power of Suppliers
- 4.7.2 Bargaining Power of Buyers
- 4.7.3 Threat of New Entrants
- 4.7.4 Threat of Substitutes
- 4.7.5 Competitive Rivalry
- 4.8 Industry Value-Chain Mapping
5 MARKET SIZE AND GROWTH FORECASTS (VOLUME)
- 5.1 By Screen Size
- 5.1.1 Up to 45"
- 5.1.2 45-54"
- 5.1.3 55-64"
- 5.1.4 65-74"
- 5.1.5 75" and Above
- 5.2 By Resolution Type
- 5.2.1 HDTV
- 5.2.2 Full HD
- 5.2.3 4K UHD
- 5.2.4 8K UHD
- 5.3 By Panel Technology
- 5.3.1 LCD/LED
- 5.3.2 QLED
- 5.3.3 OLED
- 5.3.4 Mini-LED
- 5.4 By Price Band
- 5.4.1 less than USD 500
- 5.4.2 USD 500-999
- 5.4.3 USD 1,000-1,999
- 5.4.4 More than USD 2,000
- 5.5 By Operating System
- 5.5.1 Roku OS
- 5.5.2 Google/Android TV
- 5.5.3 Tizen OS
- 5.5.4 webOS
- 5.5.5 Fire TV OS
- 5.5.6 VIDAA U
6 COMPETITIVE LANDSCAPE
- 6.1 Market Concentration
- 6.2 Strategic Moves
- 6.3 Market Share Analysis
- 6.4 Vendor Market Ranking Analysis
- 6.5 Company Profiles (includes Global level Overview, Market level overview, Core Segments, Financials as available, Strategic Information, Market Rank/Share, Products and Services, Recent Developments)
- 6.5.1 Samsung Electronics Co., Ltd.
- 6.5.2 LG Electronics Inc.
- 6.5.3 Sony Group Corporation
- 6.5.4 TCL Electronics Holdings Ltd.
- 6.5.5 VIZIO Holding Corp.
- 6.5.6 Hisense Group Co., Ltd.
- 6.5.7 Panasonic Holdings Corporation
- 6.5.8 Sharp Corporation
- 6.5.9 Koninklijke Philips N.V.
- 6.5.10 Skyworth Group Ltd.
- 6.5.11 Xiaomi Corp.
- 6.5.12 Amazon.com Inc. (Fire TV Devices)
- 6.5.13 Apple Inc. (Apple TV & tvOS Integrations)
- 6.5.14 Haier Smart Home Co., Ltd.
- 6.5.15 Funai Electric Co., Ltd. (Magnavox/Sanyo)
- 6.5.16 Westinghouse Electric Corp.
- 6.5.17 Sceptre Inc.
- 6.5.18 Insignia Systems Inc. (Insignia TV)
- 6.5.19 JVC Kenwood Corp.
- 6.5.20 Pioneer Corp.
- 6.5.21 Seiki Digital Inc.
- 6.5.22 Element Electronics LLC
- 6.5.23 Hitachi Ltd.
- 6.5.24 LeEco (LeTV)
- 6.5.25 Metz Consumer Electronics GmbH
- 6.5.26 B&O A/S (Bang & Olufsen)
7 MARKET OPPORTUNITIES AND FUTURE OUTLOOK
- 7.1 White-Space and Unmet-Need Assessment
 智慧电视市场:2026-2032年全球市场预测(按显示技术、萤幕大小、解析度、销售管道和应用划分)网路电视市场:2026年至2032年全球预测(依显示技术、解析度、萤幕大小、作业系统和应用程式划分)
 2026年全球体育赛事线上影片市场报告
 智慧电视晶片市场:按类型、解析度、最终用户和地区划分
 智慧电视市场分析及预测(至2035年):依类型、产品类型、技术、组件、应用、功能、安装类型、最终用户及模式划分
 全球智慧电视市场规模、份额、趋势和成长分析报告(2026-2034)
 智慧型电视晶片市场:按类型、解析度、最终用户、国家和地区划分-全球产业分析、市场规模、市场份额及2025年至2032年预测
 智慧电视市场规模、份额、趋势和预测(按解析度类型、萤幕大小、萤幕类型、技术、平台、分销管道、应用和地区划分),2026-2034年
 智慧电视市场规模、份额和趋势分析报告:按解析度、萤幕尺寸、作业系统、分销管道、技术、地区和细分市场预测(2026-2033 年)2026年全球智慧电视市场报告