


 |
市场调查报告书
商品编码
1940694
巨量资料工程服务:市场占有率分析、产业趋势与统计、成长预测(2026-2031)Big Data Engineering Services - Market Share Analysis, Industry Trends & Statistics, Growth Forecasts (2026 - 2031) |
||||||
※ 本网页内容可能与最新版本有所差异。详细情况请与我们联繫。
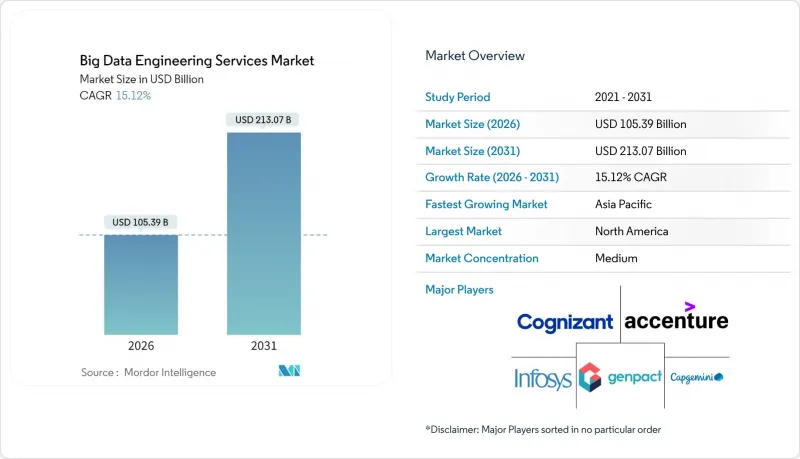
预计到 2026 年,巨量资料工程服务市场规模将达到 1,053.9 亿美元,高于 2025 年的 915.4 亿美元。
预计到 2031 年,该产业规模将达到 2,130.7 亿美元,2026 年至 2031 年的复合年增长率为 15.12%。
需求成长的驱动因素包括人工智慧驱动决策的持续普及、物联网终端的扩展,以及将原始数据和非结构化资讯转化为可信洞察的需求。企业正在将工作负载迁移到弹性平台,这些平台能够显着降低处理延迟,并透过基于结果的服务协议加快价值实现速度。同时,混合架构也越来越受欢迎,因为规避风险的企业希望避免被供应商锁定,并遵守日益严格的资料主权法规。此外,自动化资料管道工具透过减少手动编码和维护工作量,缓解了人才短缺的问题。
全球巨量资料工程服务市场趋势与洞察
非结构化物联网/社交数据的快速成长推动了对服务的需求
工业感测器、社交平臺和边缘设备会产生Petabyte的原始数据,而传统数据仓库无法在不呈指数级增加延迟的情况下处理这些数据。资产密集型工业企业以毫秒的速度传输振动、压力和环境测量数据,但由于数据模式柔软性,约70%的数据仍未被利用。服务供应商目前正在部署「读取时模式」湖仓,这些湖仓可以接收半结构化有效负载,执行在线连续分析,并将资料储存为与即时分析引擎相容的列式格式。预先建置的MQTT、OPC-UA和关键社交API连接器可以加快部署速度,而边缘网关则透过在本地处理事件来降低回程传输成本。这些功能集共同将不可控的资料成长转化为可执行的洞察,从而为预测性维护、客户情绪追踪和供应链预测提供支援。
以成本效益和结果为导向的服务合约改变了合约签订方式。
采购主管们越来越倾向于采用绩效目标,例如低于 100 毫秒的查询延迟和 99.9% 的管道运转率,而不是按小时计费的合约。绩效合约会针对未达到的关键绩效指标 (KPI) 触发惩罚条款,并为超出服务水准提供激励。这促使供应商实现测试自动化、实施自癒作业,并采用监控仪表板来检测异常情况,从而避免违反服务等级协定 (SLA)。财务长们支持这种模式,认为它可以控制支出波动,而供应商则乐于接受它,以加深策略一致性并提升销售持续优化工作流程。早期采用者报告称,与按工时和材料计费的合约相比,营运成本节省了 20-30%,并且透过将财务结果与数据平台性能直接挂钩,更快地获得了经营团队的认可。
数据工程人才严重短缺限制了成长。
精通流式架构、湖屋优化和机器学习驱动编配的专业人才需求仍然强劲。高级工程师的薪资比传统资料库管理员高出 40% 至 60%,这推高了供应商和客户的营运成本。为了弥补这一差距,供应商纷纷推出培训课程、认证海外团队,并引入自动化技术来减少人工工作量。然而,在金融服务和医疗保健等高度监管且复杂的部署环境中,仍需要自动化无法完全取代的实务经验,这会拖慢计划进度并限制并发性。
细分市场分析
截至2025年,资料整合和ETL服务将占据巨量资料工程服务市场31.21%的份额,主要由管理20多个资料来源且需要严格整合的公司占据。该领域的领先地位高度依赖即时串流架构,这些架构可将交易、感测器和点选流事件同步到湖屋储存库。供应商部署变更资料撷取(CDCU) 管道和模式演化策略,以维持分钟级的更新週期,满足追踪存货周转和诈欺讯号的仪表板需求。日益增长的管治要求推动了对扩展资料追踪、检验和异常修復例程的需求,这些例程直接建构在资料撷取作业中。
进阶分析和视觉化是成长最快的组件,复合年增长率高达 15.61%。在此领域,服务供应商将预先设定的笔记本、特定领域的特征库和响应式仪表板捆绑在一起,可在数天内将原始资料转换为预测性或指导性建议。自然语言查询层使洞察生成更加普及,业务部门人员无需具备 SQL 专业知识即可迭代验证假设。由于分析结果构成了按效果付费模式的基础,服务提供者正在积极改进配置方案,以确保数千同时上线用户都能获得亚秒级的渲染速度。整合和分析相辅相成:干净、统一的数据驱动着高级模型,而高级模型反过来又带来性能提升,证明了持续平台投资的合理性。
到2025年,财政部门的支出将占总支出的29.14%,反映出其在监管报告、流动性风险计算和收入预测方面的深入参与。其工作量包括多币种汇总、每日损益计算以及符合审核要求的压力测试引擎,因此,服务提供者强调确定性计算、不可篡改的帐簿以及与外部清算机构的自动对帐。然而,财政部门的范畴仍在不断扩展,延伸至持续智慧仪錶盘,以便及时向财政部门通报殖利率曲线的变动和资本充足率阈值。
行销和销售管道正以 15.49% 的复合年增长率成长,利用行为讯号近乎即时地部署高水平个人化的行销宣传活动。客户 360 度架构整合了网页浏览、POS 和客户服务记录,为最佳优惠引擎提供建议。智慧路由模型选择最佳频道、创新和投放时间,进而将转换率提升两位数百分比。服务公司正在实施实验框架,以 A/B 测试演算法调整,并将绩效指标纳入自动化预算分配。随着隐私法规对第三方 Cookie 的限制,第一方资料平台正成为策略性资产,进一步提升了市场推广功能的工程需求。
区域分析
到2025年,北美将以39.18%的收入占比领跑,这得益于其成熟的云端基础设施、人工智慧的早期应用以及要求先进管治的严格监管。金融服务公司正在即时完善反洗钱模型,医疗保健网路正在符合HIPAA标准的丛集上建立精准医疗工作流程。创业投资资金地流入资料平台Start-Ups,推动服务协议的签订,以强化其架构并拓展市场。
预计到2031年,亚太地区的年复合成长率将达到15.74%,远超其他地区。政府支持的智慧製造园区、5G网路部署以及数位银行牌照的审批,正推动资料量激增,并对先进工程技术提出了更高的要求。中国和印度的电商巨头每天处理数十亿次的点选流事件,推动建构Exabyte级资料湖的区域标准。製造中心正在对装配线维修,加装组装联网(IIoT)感测器,这需要边缘云管道来降低延迟并符合新的资料本地化法规。
在欧洲,GDPR 和即将推出的人工智慧管治法规促使各组织机构需要采用隐私设计控制措施,推动了相关技术的稳定应用。汽车和工业集团正在试行数位双胞胎项目,以整合遥测数据、维护记录和供应商数据,从而提高生产效率并减少停机时间。中东和非洲地区虽然是新兴市场,但正加大对油气现代化改造预算和智慧城市联盟基础资料层的投资。高频宽海底电缆和区域云平台正在降低准入门槛,预示着该地区具有选择性但可持续成长的潜力。
其他福利:
- Excel格式的市场预测(ME)表
- 分析师支持(3个月)
目录
第一章 引言
- 研究假设和市场定义
- 调查范围
第二章调查方法
第三章执行摘要
第四章 市场情势
- 市场概览
- 市场驱动因素
- 非结构化物联网/社交数据的激增
- 成本效益高、以结果为导向的服务合约
- 部署云端原生巨量资料栈
- 监理机关推动数据驱动决策
- 人工智慧自动化数据管道的崛起
- 产业专用的数据市场
- 市场限制
- 数据工程人才严重短缺
- 网路安全和隐私合规成本
- 旧有系统整合的复杂性
- 云端资料传输成本和供应商锁定带来的经济影响
- 产业价值链分析
- 监管环境
- 技术展望
- 波特五力分析
- 新进入者的威胁
- 买方的议价能力
- 供应商的议价能力
- 替代品的威胁
- 竞争对手之间的竞争
- 宏观经济影响评估
- 新兴科技趋势
第五章 市场规模与成长预测
- 按服务类型
- 资料建模与架构
- 资料整合和 ETL
- 数据品质与管治
- 进阶分析和视觉化
- 按业务职能
- 行销与销售
- 金融
- 营运和供应链
- 人力资源
- 按组织规模
- 中小企业
- 大公司
- 透过部署模式
- 云
- 本地部署
- 杂交种
- 按地区
- 北美洲
- 南美洲
- 欧洲
- 亚太地区
- 中东和非洲
第六章 竞争情势
- 市场集中度
- 策略趋势
- 市占率分析
- 公司简介
- Accenture plc
- International Business Machines Corporation
- Cognizant Technology Solutions Corporation
- Capgemini SE
- Infosys Limited
- Tata Consultancy Services Limited
- Wipro Limited
- Deloitte Touche Tohmatsu Limited
- Ernst and Young Global Limited
- KPMG International Limited
- Genpact Limited
- NTT Data Corporation
- LandT Technology Services Limited
- Hexaware Technologies Limited
- Mphasis Limited
- Tech Mahindra Limited
- Atos SE
- SAP SE
- Amazon Web Services, Inc.
- Microsoft Corporation
- Google LLC
- Snowflake Inc.
- Teradata Corporation
- Palantir Technologies Inc.
- ThoughtWorks Holdings, Inc.
- Slalom, LLC
第七章 市场机会与未来展望
big data engineering services market size in 2026 is estimated at USD 105.39 billion, growing from 2025 value of USD 91.54 billion with 2031 projections showing USD 213.07 billion, growing at 15.12% CAGR over 2026-2031.
Continued adoption of AI-driven decision making, expansion of IoT endpoints, and the need to convert raw, unstructured information into reliable intelligence all fuel demand. Enterprises migrate workloads to elastic platforms that slash processing latency, while outcome-based service contracts accelerate time-to-value. At the same time, hybrid architectures gain traction as risk-averse organizations hedge against vendor lock-in and comply with tightening data-sovereignty rules. Meanwhile, automated data-pipeline tools temper talent shortages by reducing manual coding and maintenance overhead.
Global Big Data Engineering Services Market Trends and Insights
Proliferation of Unstructured IoT/Social Data Drives Service Demand
Industrial sensors, social platforms, and edge devices generate petabytes of raw records that traditional warehouses cannot absorb without latency spikes. Organizations in heavy-asset industries stream vibration, pressure, and environmental readings at millisecond intervals, yet limited schema flexibility keeps roughly 70% of those records dark. Service providers now deploy schema-on-read lakehouses that accept semi-structured payloads, perform inline parsing, and store data in columnar formats compatible with real-time analytics engines. Pre-built connectors for MQTT, OPC-UA, and common social APIs compress rollout times, while edge gateways process events locally to cut backhaul costs. These capabilities collectively transform uncontrolled data growth into exploitable insights that sharpen predictive maintenance, customer sentiment tracking, and supply-chain forecasting.
Cost-Efficient, Outcome-Based Service Contracts Transform Engagement Models
Procurement leaders increasingly reject billable-hour engagements in favor of performance milestones such as sub-100 ms query latency or 99.9% pipeline uptime. Under outcome agreements, penalty clauses kick in if KPIs slip, and bonus pools reward above-baseline service levels. Providers therefore automate testing, implement self-healing jobs, and deploy observability dashboards that flag anomalies before SLA breaches occur. CFOs endorse the model because it caps spend volatility, while vendors embrace it to deepen strategic ties and upsell continuous optimization workstreams. Early adopters report 20-30% operating-expense reduction versus time-and-materials contracts and faster executive buy-in when financial results tie directly to data-platform performance.
Acute Shortage of Data-Engineering Talent Constrains Growth
Vacancy rates remain high for specialists versed in streaming architectures, lakehouse optimization, and ML-driven orchestration. Senior engineers command 40-60% premium salaries versus traditional DBAs, driving operating costs higher for both providers and clients. To bridge gaps, vendors roll out bootcamps, certify offshore teams, and embed automation that shrinks manual workload. Yet complex, regulated deployments, especially in financial services and healthcare, still require hands-on expertise that automation cannot fully replace, slowing project timelines and limiting concurrent engagement capacity.
Other drivers and restraints analyzed in the detailed report include:
- Cloud-Native Big-Data Stack Adoption Accelerates Market Growth
- Regulatory Push for Data-Driven Decision Making
- Cyber-Security and Privacy Compliance Costs Escalate Project Complexity
For complete list of drivers and restraints, kindly check the Table Of Contents.
Segment Analysis
In 2025, data integration and ETL services held 31.21% share of the big data engineering services market, a position secured by enterprises that manage upward of 20 data sources and require rigorous consolidation. The segment's dominance owes much to real-time streaming architectures that synchronize transactional, sensor, and clickstream events into lakehouse repositories. Vendors deploy change-data-capture pipelines and schema evolution policies that sustain minute-level refresh cycles, satisfying dashboards that track inventory turns and fraud signals. As governance mandates tighten, demand rises for extended lineage, validation, and anomaly-repair routines embedded directly in ingestion jobs.
Advanced analytics and visualization is the fastest-expanding component at a 15.61% CAGR. Here, service providers bundle pre-configured notebooks, domain-specific feature stores, and responsive dashboards that convert raw observations into predictive or prescriptive guidance within days. Natural-language query layers democratize insight generation, empowering line-of-business staff to iterate hypotheses without SQL proficiency. Because analytics outcomes anchor outcome-based contracts, providers iterate aggressively on deployment playbooks to ensure sub-second rendering speeds for thousands of concurrent users. Together, integration and analytics remain symbiotic: clean, unified data feeds advanced models that, in turn, surface performance gains justifying continual platform investment.
Finance offices accounted for 29.14% of 2025 spending, reflecting deep roots in regulatory reporting, liquidity risk computation, and revenue forecasting. Workloads include multi-currency aggregation, intraday P&L, and stress-testing engines that must remain audit-ready. Providers therefore emphasize deterministic calculations, immutable ledgers, and automated reconciliation against external clearinghouses. Even so, finance footprints increasingly extend to continuous intelligence dashboards that alert treasuries on shifting yield curves or capital-ratio thresholds.
Marketing and sales pipelines, growing at a 15.49% CAGR, tap behavioral signals to craft hyper-personalized campaigns delivered in near real time. Customer 360 architectures fuse web browsing, point-of-sale, and customer-service transcripts to advise next-best-offer engines. Intelligent routing models select optimal channels, creative, and timing, improving conversion by double-digit percentages. Service firms embed experimentation frameworks that A/B test algorithmic tweaks and feed uplift metrics into automated budget allocation. As privacy regulations restrict third-party cookies, first-party data platforms emerge as strategic assets, further amplifying engineering demand in go-to-market functions.
The Big Data Engineering Services Market Report is Segmented by Service Type (Data Modelling and Architecture, Data Integration and ETL, and More), Business Function (Marketing and Sales, Finance, and More), Organization Size (Small and Medium Enterprises and Large Enterprises), Deployment Mode (Cloud, On-Premises, and Hybrid), and Geography. The Market Forecasts are Provided in Terms of Value (USD).
Geography Analysis
North America led with 39.18% revenue in 2025, underpinned by established cloud infrastructure, early AI adoption, and stringent legislation that necessitates sophisticated governance. Financial-services firms refine anti-money-laundering models in real time, while healthcare networks orchestrate precision-medicine workflows on HIPAA-compliant clusters. Venture funding channels steady capital into data-platform startups, which in turn spur service engagements for architecture hardening and go-to-market scaling.
Asia Pacific is projected to outpace other regions at a 15.74% CAGR through 2031. Governments sponsor smart-manufacturing zones, 5G rollouts, and digital-banking licenses that spawn data volumes demanding advanced engineering. Chinese and Indian e-commerce giants ingest billions of clickstream events daily, catalyzing regional benchmarks for exabyte-scale lakehouses. Manufacturing hubs retrofit assembly lines with IIoT sensors, necessitating edge-cloud pipelines that compress latency while meeting nascent data-localization statutes.
Europe shows steady uptake as GDPR and forthcoming AI-governance acts compel organizations to embed privacy-by-design controls. Automotive and industrial conglomerates pilot digital-twin initiatives, integrating telemetry, maintenance logs, and supplier data to sharpen throughput and cut downtime. Middle East and Africa, while still emerging, channel oil-and-gas modernization budgets and smart-city consortiums into foundational data layers. High-bandwidth subsea cables and regional cloud zones lower entry barriers, signaling potential for sustained, if selective, growth.
- Accenture plc
- International Business Machines Corporation
- Cognizant Technology Solutions Corporation
- Capgemini SE
- Infosys Limited
- Tata Consultancy Services Limited
- Wipro Limited
- Deloitte Touche Tohmatsu Limited
- Ernst and Young Global Limited
- KPMG International Limited
- Genpact Limited
- NTT Data Corporation
- LandT Technology Services Limited
- Hexaware Technologies Limited
- Mphasis Limited
- Tech Mahindra Limited
- Atos SE
- SAP SE
- Amazon Web Services, Inc.
- Microsoft Corporation
- Google LLC
- Snowflake Inc.
- Teradata Corporation
- Palantir Technologies Inc.
- ThoughtWorks Holdings, Inc.
- Slalom, LLC
Additional Benefits:
- The market estimate (ME) sheet in Excel format
- 3 months of analyst support
TABLE OF CONTENTS
1 INTRODUCTION
- 1.1 Study Assumptions and Market Definition
- 1.2 Scope of the Study
2 RESEARCH METHODOLOGY
3 EXECUTIVE SUMMARY
4 MARKET LANDSCAPE
- 4.1 Market Overview
- 4.2 Market Drivers
- 4.2.1 Proliferation of unstructured IoT/social data
- 4.2.2 Cost-efficient, outcome-based service contracts
- 4.2.3 Cloud-native big-data stack adoption
- 4.2.4 Regulatory push for data-driven decision-making
- 4.2.5 Rise of AI-automated data-pipelines
- 4.2.6 Industry-specific data marketplaces
- 4.3 Market Restraints
- 4.3.1 Acute shortage of data-engineering talent
- 4.3.2 Cyber-security and privacy compliance costs
- 4.3.3 Legacy system integration complexity
- 4.3.4 Cloud-egress and vendor-lock-in economics
- 4.4 Industry Value Chain Analysis
- 4.5 Regulatory Landscape
- 4.6 Technological Outlook
- 4.7 Porter's Five Forces Analysis
- 4.7.1 Threat of New Entrants
- 4.7.2 Bargaining Power of Buyers
- 4.7.3 Bargaining Power of Suppliers
- 4.7.4 Threat of Substitutes
- 4.7.5 Competitive Rivalry
- 4.8 Macroeconomic Impact Assessment
- 4.9 Emerging Technology Trends
5 MARKET SIZE AND GROWTH FORECASTS (VALUE)
- 5.1 By Service Type
- 5.1.1 Data Modelling and Architecture
- 5.1.2 Data Integration and ETL
- 5.1.3 Data Quality and Governance
- 5.1.4 Advanced Analytics and Visualization
- 5.2 By Business Function
- 5.2.1 Marketing and Sales
- 5.2.2 Finance
- 5.2.3 Operations and Supply-Chain
- 5.2.4 Human Resources
- 5.3 By Organization Size
- 5.3.1 Small and Medium Enterprises (SMEs)
- 5.3.2 Large Enterprises
- 5.4 By Deployment Mode
- 5.4.1 Cloud
- 5.4.2 On-premises
- 5.4.3 Hybrid
- 5.5 By Geography
- 5.5.1 North America
- 5.5.2 South America
- 5.5.3 Europe
- 5.5.4 Asia Pacific
- 5.5.5 Middle East and Africa
6 COMPETITIVE LANDSCAPE
- 6.1 Market Concentration
- 6.2 Strategic Moves
- 6.3 Market Share Analysis
- 6.4 Company Profiles (includes Global-level Overview, Market-level Overview, Core Segments, Financials as available, Strategic Information, Market Rank/Share, Products and Services, Recent Developments)
- 6.4.1 Accenture plc
- 6.4.2 International Business Machines Corporation
- 6.4.3 Cognizant Technology Solutions Corporation
- 6.4.4 Capgemini SE
- 6.4.5 Infosys Limited
- 6.4.6 Tata Consultancy Services Limited
- 6.4.7 Wipro Limited
- 6.4.8 Deloitte Touche Tohmatsu Limited
- 6.4.9 Ernst and Young Global Limited
- 6.4.10 KPMG International Limited
- 6.4.11 Genpact Limited
- 6.4.12 NTT Data Corporation
- 6.4.13 LandT Technology Services Limited
- 6.4.14 Hexaware Technologies Limited
- 6.4.15 Mphasis Limited
- 6.4.16 Tech Mahindra Limited
- 6.4.17 Atos SE
- 6.4.18 SAP SE
- 6.4.19 Amazon Web Services, Inc.
- 6.4.20 Microsoft Corporation
- 6.4.21 Google LLC
- 6.4.22 Snowflake Inc.
- 6.4.23 Teradata Corporation
- 6.4.24 Palantir Technologies Inc.
- 6.4.25 ThoughtWorks Holdings, Inc.
- 6.4.26 Slalom, LLC
7 MARKET OPPORTUNITIES AND FUTURE OUTLOOK
- 7.1 White-space and Unmet-need Assessment
 2026年全球巨量资料专业服务市场报告
 行动数据消费趋势市场分析及预测(至2035年):按类型、产品类型、服务、技术、组件、应用、设备、部署类型、最终用户和功能划分
 巨量资料和人工智慧市场规模、份额和成长分析(按数据分析解决方案、人工智慧平台、巨量资料技术、产业应用和地区划分)—2026-2033年产业预测
 巨量资料全球市场规模、份额、趋势和成长分析报告(2026-2034)2026年全球石油天然气产业巨量资料市场报告
 2025-2029年全球油气市场人工智慧(AI)与机器学习(ML)发展趋势
 全球电信市场巨量资料与机器学习趋势(2025-2029)
 巨量资料和数据工程服务市场-全球产业规模、份额、趋势、机会及预测(按服务类型、组织规模、业务职能、最终用户、地区和竞争格局划分,2021-2031年)巨量资料市场-全球产业规模、份额、趋势、机会、预测:硬体、服务、终端用户、区域及竞争格局(2021-2031年)
 2026-2030年全球巨量资料基础设施市场