


 |
市场调查报告书
商品编码
1940714
美国快递、速递和小包裹(CEP):市场份额分析、行业趋势和统计数据、成长预测 (2026-2031)United States Courier, Express, And Parcel (CEP) - Market Share Analysis, Industry Trends & Statistics, Growth Forecasts (2026 - 2031) |
||||||
※ 本网页内容可能与最新版本有所差异。详细情况请与我们联繫。
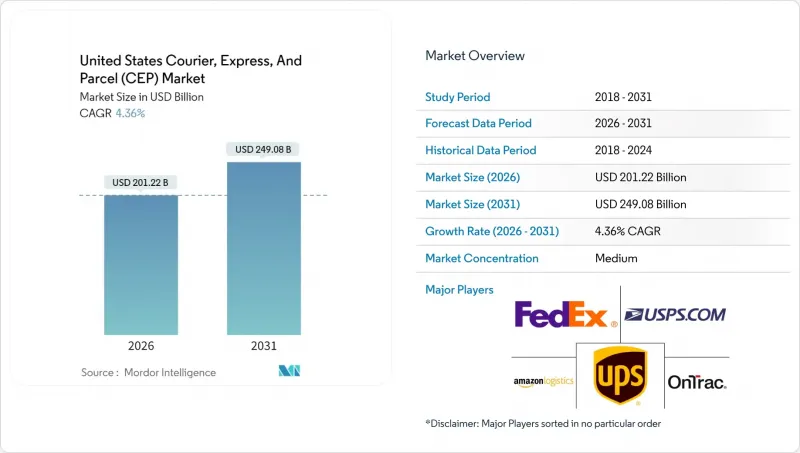
美国快递小包裹(CEP) 市场预计到 2026 年将达到 2,012.2 亿美元,高于 2025 年的 1,928.2 亿美元。
预计到 2031 年,该产业规模将达到 2,490.8 亿美元,2026 年至 2031 年的复合年增长率为 4.36%。
近期业务量成长主要得益于强劲的电子商务基础、全通路库存的正常化以及商业客户在2024年暂停非必要支出后的復苏。区域承运商的整合、美国邮政「地面优势」产品的重新定价以及整合商计画的运力扩张,限制了高峰期的价格竞争。从API驱动的视觉化工具到人工智慧辅助分类系统,技术创新不断提升网路速度,尤其是在高密度地区。然而,工会工资谈判、道路拥堵以及最低收货标准波动等不利因素持续推高营运成本,促使承运人转向更环保的车辆,并重新谈判合同,以更好地平衡价格和服务保障。
美国快递、快递与小包裹(CEP) 市场趋势与分析
疫情后电子商务订单量呈现爆炸性成长
持续的线上购物趋势使得订单量在2024年假期季节高峰过后依然居高不下。美国零售商的「黑色星期五」交易量比10月份的平均星期五增长了255%。高流量走廊已扩展到沿海大都会圈以外,52%的美国国内电商小包裹运输集中在仅九个州。这使得承运商能够提高每日配送密度并降低最后一公里配送成本。消费者越来越希望全面了解配送状态,这促使零售商整合承运商API,以自动发送主动通知、减少「包裹位置」查询并平衡配送工作量。不断增长的需求给分类中心带来了压力,促使整合商部署机器视觉扫描仪,以减少分类错误并在需求高峰期支援灵活的工作模式。预计这些结构性改进将在中期内推动美国快递、速递和小包裹(CEP)市场复合年增长率(CAGR)提高1.2个百分点。
当日达/按需配送生态系统的成长
当日达服务已从可选变为必需,26%的零售商提供两日达服务,12%的零售商提供隔日达服务,这些服务已成为标准配置。自动机器人、送货无人机和微型仓配中心正聚集在人口密集区域五英里范围内,将註册零售商的平均配送时间缩短至两小时以内。配送成本的下降以及都市区同样迫切的需求正在推动这项服务的普及。为此,45%的零售商计划部署人工智慧驱动的配送软体,以优化承运商组合併实现异常情况处理的自动化。 51%的零售商也拨出预算进行预测性退货分析,以降低逆向物流成本。然而,由于政府法规分散,需要付出高昂的成本来遵守特定地区的法规,这促使跨城市承运商试点使用模组化硬件,以适应不同的路边空间规定。预计未来两年,该生态系统将实现0.8个百分点的复合年增长率。
工会司机薪资和福利成本不断上涨
司机短缺问题将持续存在,预计到2025年将有8万个职缺,而人口结构变化可能使这一缺口在2030年翻倍以上。大型综合性公司面临超过90%的离职率,迫使它们提高薪资并提供留任奖金,而这种趋势也蔓延到了区域性竞争对手。集体谈判正在重塑行业标准,迫使非工会车队达到关键指标,否则将面临高峰期运力下降的风险。分类改革威胁到支撑小规模轻型包裹承包商的个体经营者商业模式,增加了遵循成本并缩小了净利率。从长远来看,透过提高运费将成本转嫁出去可能会抑制货运量的自愿成长,使承运商市场的复合年增长率下降0.7个百分点。
细分市场分析
到2025年,电子商务将占货运总量的42.10%,并将继续引领小包裹递送需求,指南是电商平台的促销活动、先享后付模式的兴起以及与社交电商的融合。高订单频率将使履约中心保持运作,而退货政策将扩大逆向物流环节的小包裹量。 2026年至2031年,医疗保健产业将以4.58%的复合年增长率成长,其成长主要得益于温控药品、家用诊断试剂盒和远端医疗设备等对管理系统要求严格的产品。
经认证的批发分销商承运商正在温控运输路线中占据越来越大的市场份额,他们利用配备感测器的包装,并维护路线层面的合规记录以应对FDA的审核。製造商依赖即时补货,而批发商和零售商则利用预测性库存分析来优化补货频率。这些产业共同巩固了其在美国宅配、快捷邮件和小包裹市场的份额,从而缓解了该行业特有的景气衰退,并拓展了其服务范围。
至2025年,美国国内快递、速递和小包裹(CEP)市场将占美国国内运输市场的76.15%。这得益于统一的法规、标准化的地址系统以及覆盖几乎所有邮递区号的密集型「最后一公里」配送网路。稳定的家庭消费、蓬勃发展的小型企业以及美国邮政服务(USPS)的普遍服务保障,使得绝大多数始发地和目的地仍为美国境内。虽然国际市场规模较小,但在2026年至2031年间,其复合年增长率将达到4.64%,这主要得益于美国经销商拓展全球市场以及加拿大和墨西哥消费者对美国产品日益增长的需求。
国际业务成长得益于简化的电子报关流程和与外国邮政营业单位改进的交接程序,但即将到来的最低限度税收改革引发了人们对文书工作和关税增加的担忧。承运商正透过投资即时分析产品分类的321条款引擎来规避风险。网路负责人也在美墨边境实施卡车和航空混合混合模式,以避免拉雷多和奥泰梅萨的交通拥堵,并满足尖峰时段的服务承诺。这种不断变化的跨境模式必将在未来十年推动美国快递、速递和小包裹(CEP)市场规模的绝对增长和相对增长,并与全球物流紧密相关。
其他福利:
- Excel格式的市场预测(ME)表
- 分析师支持(3个月)
目录
第一章 引言
- 研究假设和市场定义
- 调查范围
第二章调查方法
第三章执行摘要
第四章 市场情势
- 市场概览
- 人口统计数据
- 按经济活动分類的GDP分配
- 按经济活动分類的GDP成长
- 通货膨胀
- 经济表现及概况
- 电子商务产业的趋势
- 製造业趋势
- 运输和仓储业的GDP
- 出口趋势
- 进口趋势
- 燃油价格
- 物流绩效
- 基础设施
- 法律规范
- 价值炼和通路分析
- 市场驱动因素
- 疫情后电子商务订单量呈现爆炸性成长
- 当日达/按需配送生态系统的成长
- 零售商向全通路和门市履约
- 美国邮政「地面优势」计画重启,旨在扩大低成本运输能力
- 二手平台的C2C再交易小包裹数量激增
- 电动车队采购奖励可降低长期「最后一公里」营运成本。
- 市场限制
- 工会驾驶人;
- 道路和桥樑基础设施老化导致延误
- 都市区的路缘空间规定限制了厢型车的通行。
- 更严格的最低限度规则会增加跨境成本
- 市场创新
- 波特五力分析
- 新进入者的威胁
- 买方的议价能力
- 供应商的议价能力
- 替代品的威胁
- 竞争对手之间的竞争
第五章 市场规模与成长预测
- 目的地
- 国内的
- 国际的
- 配送速度
- 快递
- 非快递
- 模型
- B2B
- B2C
- C2C
- 运输重量
- 重型货物
- 轻型货物
- 中等重量货物
- 交通工具
- 航空邮件
- 陆上
- 其他的
- 终端用户产业
- 电子商务
- 金融服务(BFSI)
- 卫生保健
- 製造业
- 一级产业
- 批发零售(线下)
- 其他的
第六章 竞争情势
- 市场集中度
- 重大策略倡议
- 市占率分析
- 公司简介
- Amazon
- Aramex
- DHL Group
- Dropoff Inc.
- FedEx
- International Distributions Services(including GLS)
- OnTrac
- Spee-Dee Delivery Service, Inc.
- United Parcel Service(UPS)
- USA Couriers
- USPS
- WeDo Logistics Limited(including Lone Star Overnight Inc.)
第七章 市场机会与未来展望
United States courier, express, and parcel market size in 2026 is estimated at USD 201.22 billion, growing from 2025 value of USD 192.82 billion with 2031 projections showing USD 249.08 billion, growing at 4.36% CAGR over 2026-2031.
Recent volume gains stem from a resilient e-commerce base, normalization of omnichannel inventories, and the return of corporate mailers that paused discretionary spending in 2024. Consolidation among regional carriers, the U.S. Postal Service's re-priced Ground Advantage product, and disciplined capacity additions by integrators have tempered competitive pricing during peak seasons. Technology upgrades-ranging from API-driven visibility tools to AI-assisted sortation-continue to improve network velocity, especially in high-density corridors. At the same time, headwinds such as union wage settlements, road congestion, and shifting de-minimis thresholds keep operating costs elevated, nudging carriers toward greener fleets and contract renegotiations that better align pricing with service guarantees.
United States Courier, Express, And Parcel (CEP) Market Trends and Insights
Explosive E-commerce Order Volumes Post-Pandemic
A sustained shift toward online buying keeps the order book elevated well beyond the 2024 holiday peak, when U.S. retailers logged 255% more Black Friday transactions than average October Fridays. High-volume corridors now stretch beyond coastal megapolises, with 52% of national e-commerce parcels originating in only nine states, enabling carriers to raise daily stop density and lower last-mile unit costs. Consumers increasingly expect full shipment visibility; as a result, retailers integrate carrier APIs that push proactive alerts, minimizing "where-is-my-package" inquiries and smoothing courier workloads. Elevated demand pressures sortation hubs, prompting integrators to deploy machine-vision scanners that reduce mis-sorts and support flexible labor models during volume surges. These structural gains sustain the 1.2-point uplift to the United States courier, express, and parcel market CAGR over the medium term.
Growth of Same-Day / On-Demand Delivery Ecosystems
Same-day fulfillment has moved from optional to essential, with 26% of merchants targeting 2-day delivery and 12% pursuing next-day as their standard promise. Autonomous sidewalk robots, delivery drones, and micro-fulfillment nodes now cluster within five miles of dense consumer pockets, cutting average transit to below two hours for enrolled merchants. Suburban adoption accelerates as cost-per-delivery drops and consumers display parity in urgency preferences compared with urban peers. In response, 45% of retailers plan to embed AI-driven shipping software that optimizes carrier mix and automates exception handling, while 51% budget predictive analytics for returns to shrink reverse-logistics overhead. Fragmented municipal regulations, however, necessitate costly jurisdiction-specific compliance, nudging multi-city carriers to pilot modular hardware that meets varying curb-space mandates. The ecosystem's 0.8-point boost to CAGR is front-loaded into the next two years.
Escalating Union Wage and Benefit Costs for Drivers
The driver pool tightens as the shortage persists at 80,000 positions in 2025, and demographic shifts could more than double the gap by 2030. Large integrators confront turnover above 90%, forcing wage escalators and retention bonuses that ripple through regional peers. Collective-bargaining rounds reset industry baselines, compelling non-union fleets to match headline figures or risk capacity attrition during peak periods. Classification reforms threaten the owner-operator model that underpins smaller parcel contractors, potentially raising compliance outlays and narrowing net margins. Over the long term, escalating wages shave 0.7 points from the market CAGR as carriers pass along costs through general rate increases that may curb discretionary shipment growth.
Other drivers and restraints analyzed in the detailed report include:
- Retailers' Shift to Omnichannel and Store-Based Fulfillment
- USPS Ground Advantage Relaunch Expanding Low-Cost Capacity
- Aging Road and Bridge Infrastructure Causing Delays
For complete list of drivers and restraints, kindly check the Table Of Contents.
Segment Analysis
E-commerce contributed 42.10% of 2025 shipments and remains the lodestar for parcel demand, driven by marketplace promotions, buy-now-pay-later penetration, and social-commerce crossover events. High order frequency keeps fulfillment centers pulsing, while returns programs extend parcel counts into the reverse pipeline. Healthcare rises at a 4.58% CAGR between 2026-2031, fueled by controlled-temperature pharmaceuticals, at-home diagnostic kits, and telehealth devices subject to strict chain-of-custody regulations.
Carriers with Verified-Accredited Wholesale Distributor status win share in temperature-controlled lanes, leveraging sensor-equipped packaging that records lane-level compliance for FDA audits. The manufacturing sector leans on just-in-time parts replenishment, while wholesale and retail trade entities optimize replenishment frequency using predictive shelf-stock analytics. Together, these verticals fortify the United States courier, express, and parcel market share, cushioning it against sector-specific downturns and broadening the service blueprint.
Domestic shipments own a 76.15% slice of the United States courier, express, and parcel market in 2025, buoyed by unified regulations, standardized addressing, and dense last-mile coverage that reaches virtually every ZIP code. Stable household consumption, robust small-business formation, and USPS universal-service guarantees keep origin-and-destination pairs overwhelmingly domestic. The international leg, while smaller, expands at a 4.64% CAGR between 2026-2031 as U.S. sellers list on global marketplaces and Canadian and Mexican consumers tap U.S. assortment breadth.
International growth leans on simplified electronic customs declarations and improved hand-off protocols with foreign posts, but looming de-minimis revisions threaten to add paperwork and brokerage fees. Carriers hedge by investing in section-321 compliance engines that parse product classifications in real time. Network planners also deploy hybrid truck-air models across the US-Mexico border to sidestep congestion at Laredo and Otay Mesa, protecting service commitments during peak periods. The evolving cross-border mix ensures that the United States courier, express, and parcel market size linked to global flows grows in both absolute and relative terms over the decade.
The United States Courier, Express, and Parcel (CEP) Market Report is Segmented by Destination (Domestic and International), Speed of Delivery (Express and Non-Express), Model (Business-To-Business (B2B) and More), Shipment Weight (Heavy Weight Shipment, Light Weight Shipment, and More), Mode of Transport (Air, Road, and Others), and End User Industry (E-Commerce and More). The Market Forecasts are Provided in Terms of Value (USD).
List of Companies Covered in this Report:
- Amazon
- Aramex
- DHL Group
- Dropoff Inc.
- FedEx
- International Distributions Services (including GLS)
- OnTrac
- Spee-Dee Delivery Service, Inc.
- United Parcel Service (UPS)
- USA Couriers
- USPS
- WeDo Logistics Limited (including Lone Star Overnight Inc.)
Additional Benefits:
- The market estimate (ME) sheet in Excel format
- 3 months of analyst support
TABLE OF CONTENTS
1 Introduction
- 1.1 Study Assumptions and Market Definition
- 1.2 Scope of the Study
2 Research Methodology
3 Executive Summary
4 Market Landscape
- 4.1 Market Overview
- 4.2 Demographics
- 4.3 GDP Distribution by Economic Activity
- 4.4 GDP Growth by Economic Activity
- 4.5 Inflation
- 4.6 Economic Performance and Profile
- 4.6.1 Trends in E-Commerce Industry
- 4.6.2 Trends in Manufacturing Industry
- 4.7 Transport and Storage Sector GDP
- 4.8 Export Trends
- 4.9 Import Trends
- 4.10 Fuel Price
- 4.11 Logistics Performance
- 4.12 Infrastructure
- 4.13 Regulatory Framework
- 4.14 Value Chain and Distribution Channel Analysis
- 4.15 Market Drivers
- 4.15.1 Explosive E-Commerce Order Volumes Post-Pandemic
- 4.15.2 Growth of Same-Day / On-demand Delivery Ecosystems
- 4.15.3 Retailers' Shift To Omnichannel and Store-Based Fulfilment
- 4.15.4 USPS "Ground Advantage" Relaunch Expanding Low-Cost Capacity
- 4.15.5 Surge in C2C Recommerce Parcels from Second-Hand Platforms
- 4.15.6 Ev-Fleet Purchase Incentives Lowering Long-Term Last-Mile OPEX
- 4.16 Market Restraints
- 4.16.1 Escalating Union Wage and Benefit Costs for Drivers
- 4.16.2 Ageing Road and Bridge Infrastructure Causing Delays
- 4.16.3 Urban Curb-Space Regulations Limiting Van Access
- 4.16.4 Stricter De-Minimis Rules Raising Cross-Border Costs
- 4.17 Technology Innovations in the Market
- 4.18 Porter's Five Forces Analysis
- 4.18.1 Threat of New Entrants
- 4.18.2 Bargaining Power of Buyers
- 4.18.3 Bargaining Power of Suppliers
- 4.18.4 Threat of Substitutes
- 4.18.5 Competitive Rivalry
5 Market Size and Growth Forecasts (Value, USD)
- 5.1 Destination
- 5.1.1 Domestic
- 5.1.2 International
- 5.2 Speed of Delivery
- 5.2.1 Express
- 5.2.2 Non-Express
- 5.3 Model
- 5.3.1 Business-to-Business (B2B)
- 5.3.2 Business-to-Consumer (B2C)
- 5.3.3 Consumer-to-Consumer (C2C)
- 5.4 Shipment Weight
- 5.4.1 Heavy Weight Shipments
- 5.4.2 Light Weight Shipments
- 5.4.3 Medium Weight Shipments
- 5.5 Mode of Transport
- 5.5.1 Air
- 5.5.2 Road
- 5.5.3 Others
- 5.6 End User Industry
- 5.6.1 E-Commerce
- 5.6.2 Financial Services (BFSI)
- 5.6.3 Healthcare
- 5.6.4 Manufacturing
- 5.6.5 Primary Industry
- 5.6.6 Wholesale and Retail Trade (Offline)
- 5.6.7 Others
6 Competitive Landscape
- 6.1 Market Concentration
- 6.2 Key Strategic Moves
- 6.3 Market Share Analysis
- 6.4 Company Profiles (Includes Global Level Overview, Market Level Overview, Core Segments, Financials as Available, Strategic Information, Market Rank/Share for Key Companies, Products and Services, and Recent Developments)
- 6.4.1 Amazon
- 6.4.2 Aramex
- 6.4.3 DHL Group
- 6.4.4 Dropoff Inc.
- 6.4.5 FedEx
- 6.4.6 International Distributions Services (including GLS)
- 6.4.7 OnTrac
- 6.4.8 Spee-Dee Delivery Service, Inc.
- 6.4.9 United Parcel Service (UPS)
- 6.4.10 USA Couriers
- 6.4.11 USPS
- 6.4.12 WeDo Logistics Limited (including Lone Star Overnight Inc.)
7 Market Opportunities and Future Outlook
- 7.1 White-Space and Unmet-Need Assessment
 全球宅配、包裹及小包裹市场:2026-2032年市场预测(按类型、服务类型、货物类型、目的地、配送速度、货量、运输方式及最终用户划分)
 2026年全球包裹递送服务市场报告2026年全球宅配与小包裹递送市场报告2026年全球宅配服务市场报告2026年全球快递与信差市场报告2026年全球宅配市场报告2026年全球当日配送服务市场报告2026年全球超当地语系化配送应用市场报告
 2026-2030年全球宅配包裹(CEP)市场
 宅配、快递和小包裹市场规模、份额和趋势分析报告:按服务、经营模式、目的地、运输方式、最终用途、地区和细分市场预测(2026-2033 年)