


 |
市场调查报告书
商品编码
1940776
美国工程服务:市场份额分析、行业趋势和统计数据、成长预测(2026-2031 年)United States Engineering Services - Market Share Analysis, Industry Trends & Statistics, Growth Forecasts (2026 - 2031) |
||||||
※ 本网页内容可能与最新版本有所差异。详细情况请与我们联繫。
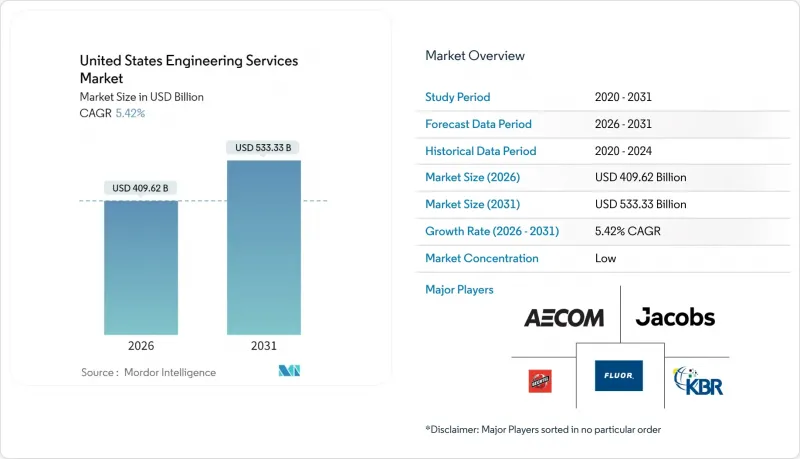
2025年美国工程服务市值为3,885.6亿美元,预计到2031年将达到5,333.3亿美元,高于2026年的4,096.2亿美元。
预计在预测期(2026-2031 年)内,复合年增长率将达到 5.42%。
《基础设施投资与就业创造法案》加速了联邦基础设施支出,《晶片/科学法案》为半导体产业提供激励,持续的国防现代化预算也为一系列需要先进工程技术的复杂计划提供了支持,这些项目将持续多年。製造业的復苏、电网现代化改造的需求,以及数位双胞胎工作流程的快速商业化(旨在减少返工并扩大资产管理收入),也在重塑市场需求模式。竞争态势正转向收购,尤其是在清洁能源系统、先进製造和人工智慧设计等专业能力方面。同时,客户的成本压力正在推动整合工程、采购、施工和管理(EPCM)模式的发展。区域需求集中在加州、德克萨斯州、五大湖走廊以及快速发展的东南部都会区,这些地区的财政奖励、低廉的土地成本和有利于商业发展的法规鼓励了持续的资本注入。
美国工程服务市场趋势与洞察
根据2021年《基础设施和基础设施发展法案》(IIJA),联邦基础设施资金大幅增加。
1.2兆美元的《基础设施基础设施和投资法案》(IIJA)是联邦政府自州际公路时代以来对实体资产最积极的投资,迫使各机构聘请外部专家进行广泛的工作,包括岩土工程勘察、抗灾供水系统和智慧交通网络。自2022年以来,各州交通部门的咨询支出增加了35%,而「购买美国货」条款则强制要求重新设计供应链、检验国产化率并编制详细的文檔,这导致工程咨询费用增加。资金筹措指南中嵌入的气候适应性要求推动了对数位双胞胎的需求,以支援风险建模、生命週期成本分析和资产加固。这些新的合规措施延长了专案週期,同时增加了每个计划的收入,并将美国工程服务市场扩展到所有50个州。
加速半导体製造厂和电池超级工厂的建设
巨型晶圆厂的平均单价在150亿至400亿美元之间,需要超高纯度公用设施、10级至1级洁净室以及小于2微米的隔振精度。这使得其单价比传统工业计划高出20%至30%。英特尔位于俄亥俄州的园区和台积电位于亚利桑那州的园区都签订了为期三至五年的工程合同,随后是长期的营运支援协议。联邦政府520亿美元的《晶片法案》(CHIPS Act)激励措施降低了这些资本计划的风险,并为电气、机械、製程和污染控制专家创造了多周期订单基础。特斯拉、通用汽车和福特汽车同时建造的电池工厂扩大了温度控管、高压设计和消防系统工程的市场机会,从而增加了美国工程服务市场的潜在总收入。
钢材和混凝土投入成本波动的风险
2023年至2025年,钢材价格年波动幅度达25%至40%,而水泥和预拌混凝土价格上涨15%至20%,这对计划预算造成压力,并增加了工程范围缩减的风险。固定价格合约正在降低公司利润率,并导致公共部门客户推迟竞标,从而抑制了美国工程服务市场的短期计费工时。成本加成合约虽然可以降低风险,但面临采购障碍。儘管价格上涨条款和材料指数化定价机制日益普及,但不确定性仍抑制资本支出,导致复合年增长率预测下调。
细分市场分析
2025年,土木工程将占总收入的34.88%,凸显其在桥樑维修、公路拓宽以及由《基础设施投资与就业法案》(IIJA)资助的抗灾供水系统建设中的核心作用。加州高速铁路和门户隧道等计划正在推动对抗震加固、岩土建模和隧道开挖监理的需求,从而确保美国工程服务市场拥有稳定的订单。该领域将受益于设计寿命要求的提高和气候适应性标准的加强,预计这将增加设计范围和计费复杂性。
机械工程是成长最快的领域,其成长主要得益于对无尘室空调、高密度温度控管以及半导体製造厂、电池工厂和超大规模资料中心中机器人整合等方面的需求。电气工程的需求同样强劲,电网现代化和电动车充电走廊的建设推动了对继电器、中压设计和智慧电錶分析服务的需求。环境工程正从修復技术扩展到气候风险建模、碳捕获系统和ESG合规,在标准土木工程范围之外提供加值服务。化学工程是一个小众但盈利的领域,涵盖半导体蚀刻製程、先进製药生产线和特殊材料,正在推高美国整体工程服务市场的平均时薪。
到2025年,顾问和设计产业将占市场收入的17.76%,这主要得益于市场对BIM协调、供应链在地化和韧性规划等前端专业知识的需求不断增长。数位化优先交付模式,包括云端託管的通用资料环境和人工智慧辅助的程式码检查,透过减少返工和上游工程转移价值,正在巩固该领域在美国工程服务市场的主导地位。
製程和工厂工程服务实现了显着成长,这主要得益于需要超纯水系统、惰性气体系统和机器人生产线平衡等先进技术的巨型晶圆厂和超级工厂计划。自动化和数位化工程服务预计将成为该领域中复合年增长率最高的服务,其特点是透过整合感测器、边缘分析数位双胞胎技术,实现试运行后优化的商业化。资产管理服务正在向基于绩效的数据订阅模式转型,从而产生持续的现金流,并有助于稳定美国工程服务业的收入。
其他福利:
- Excel格式的市场预测(ME)表
- 分析师支持(3个月)
目录
第一章 引言
- 研究假设和市场定义
- 调查范围
第二章调查方法
第三章执行摘要
第四章 市场情势
- 市场概览
- 市场驱动因素
- 根据2021年《基础设施和基础设施发展法案》(IIJA Act of 2021),联邦基础设施资金大幅增加。
- 加速半导体製造厂和电池超级工厂的建设
- 将生产线转移到美国
- 大型太阳能和风能发电计画的併网排队人数创历史新高
- 国防现代化(AUKUS,下一代防空系统)推动专家设计
- 透过引入人工智慧驱动的数位双胞胎技术减少返工
- 市场限制
- 将钢材和混凝土原料成本波动转嫁给消费者的风险
- 由于《国家环境政策法案》(NEPA) 环境审查时间过长,工程开工延后。
- 由于技术纯熟劳工短缺,导致计费成本上升
- 各州许可证制度的差异阻碍了扩张。
- 价值/供应链分析
- 监理与技术展望
- 波特五力模型
- 买方和消费者的议价能力
- 供应商的议价能力
- 新进入者的威胁
- 替代品的威胁
- 竞争对手之间的竞争
- 比较分析:内部工程与外包工程
- 供应商服务创新趋势
第五章 市场规模与成长预测
- 透过使用
- 土木工程
- 机器
- 电
- 环境
- 化学
- 按服务类型
- 咨询与设计
- 製程和工厂工程
- 产品工程与原型製作
- 自动化/数位工程
- 资产管理和维运(营运和维护)
- 按最终用户行业划分
- 建筑和基础设施
- 石油和天然气
- 製造业
- 公共产业(电力/水)
- 交通运输(铁路、机场、港口)
- 电讯和资料中心
- 医疗设施
- 按合约类型
- 内部
- 外包/工程总承包管理
第六章 竞争情势
- 市场集中度
- 策略趋势
- 市占率分析
- 公司简介
- AECOM
- Jacobs Engineering Group
- Bechtel Corporation
- Fluor Corporation
- KBR Inc.
- HDR Inc.
- Terracon
- Black and Veatch
- Jensen Hughes
- ECS Group of Companies
- WSP USA
- Tetra Tech
- STV Group
- Arup(US)
- Gannett Fleming
- Burns and McDonnell
- HNTB Corporation
- Parsons Corporation
- Louis Berger(WSP)
- AtkinsRealis(US)
第七章 市场机会与未来展望
The U.S. engineering services market was valued at USD 388.56 billion in 2025 and estimated to grow from USD 409.62 billion in 2026 to reach USD 533.33 billion by 2031, at a CAGR of 5.42% during the forecast period (2026-2031).
Accelerated federal infrastructure outlays under the Infrastructure Investment and Jobs Act, the CHIPS and Science Act's semiconductor incentives, and persistent defense-modernization budgets are sustaining a multi-year pipeline of complex projects that require deeper engineering expertise. Demand patterns are also being reshaped by manufacturing reshoring, grid-modernization imperatives, and the rapid commercialization of digital-twin workflows that cut rework and expand lifetime asset-management revenues. Competitive behavior is shifting toward acquisitions aimed at specialty capabilities-especially in clean-energy systems, advanced manufacturing, and AI-enabled design-while clients' cost pressures are encouraging integrated EPCM models. Regional demand is clustering around California, Texas, the Great Lakes corridor, and fast-growing Southeast metros where fiscal incentives, lower land costs, and pro-business regulation encourage sustained capital deployment.
United States Engineering Services Market Trends and Insights
Federal Infrastructure-Funding Boom Under 2021 IIJA
The USD 1.2 trillion IIJA marks the most aggressive federal commitment to physical assets since the Interstate Highway era, forcing agencies to hire external specialists for multi-disciplinary tasks that span geotechnical studies, resilient water systems, and intelligent-transportation networks. State DOTs have lifted consulting outlays by 35% since 2022, and Buy America clauses are compelling redesigns of supply chains, validation of domestic inputs, and extensive documentation, which add incremental fee layers for engineering consultants. Climate-resilience mandates embedded in funding guidelines are intensifying demand for risk-modeling, life-cycle cost analysis, and digital-twins that support asset hardening. These new compliance steps elongate schedules but expand revenue-per-project, expanding the U.S. engineering services market across all 50 states.
Accelerating Chip-Fab and Battery-Gigafactory Build-outs
Mega-fabs average USD 15-40 billion each, require ultra-pure utilities, class-10 to class-1 cleanrooms, and incorporate vibration isolation tolerances below two microns, driving premium bill rates that exceed traditional industrial projects by 20-30%. Intel's Ohio campus and TSMC's Arizona complex embed three-to-five-year engineering engagements, followed by long-term operations support contracts. Federal CHIPS incentives worth USD 52 billion de-risk these capital projects and underpin a multi-cycle orderbook for electrical, mechanical, process, and contamination-control specialists. Parallel battery-cell facilities from Tesla, GM, and Ford elevate opportunities in thermal-management, high-voltage design, and fire-suppression engineering, broadening total addressable revenues inside the U.S. engineering services market.
Volatile Steel and Concrete Input-Cost Pass-Through Risks
Steel prices fluctuated 25-40% annually during 2023-2025, while cement and ready-mix concrete rose 15-20%, squeezing project budgets and elevating risk of scope reduction. Fixed-price contracts thus expose firms to margin erosion and cause public-sector owners to delay bids, suppressing near-term billable hours in the U.S. engineering services market. Cost-plus agreements mitigate exposure yet face procurement hurdles. Escalation clauses and material indexes are gaining traction, but uncertainty still dampens CAPEX confidence, trimming the CAGR projection.
Other drivers and restraints analyzed in the detailed report include:
- Near-shoring of Manufacturing Lines to the U.S.
- Record-High Utility-Scale Solar and Wind Interconnection Queues
- Lengthy NEPA Environmental Reviews Delaying Starts
For complete list of drivers and restraints, kindly check the Table Of Contents.
Segment Analysis
Civil engineering captured 34.88% of 2025 revenue, underscoring its pivotal role in the bridge rehabilitation, highway expansion, and resilient water systems funded by the IIJA. Projects such as California's high-speed rail and the Gateway Tunnel boosted demand for seismic retrofits, geotechnical modeling, and tunnel-boring oversight, ensuring a steady backlog that underpins the U.S. engineering services market. The segment benefits from increasing design-life requirements and climate-resilience standards that extend scoping phases and raise billable complexity.
Mechanical engineering is the fastest-advancing discipline due to semiconductor fabs, battery plants, and hyperscale data centers that require cleanroom HVAC, high-density thermal-management, and robotics integration. Electrical engineering demand is equally brisk, spurred by grid-modernization and EV charging corridors, pulling in relay-protection, medium-voltage design, and smart-meter analytics services. Environmental engineering has expanded beyond remediation into climate-risk modeling, carbon-capture systems, and ESG compliance, adding premium services that tack onto standard civil scopes. Chemical engineering remains a niche yet lucrative field for semiconductor etching processes, advanced pharmaceutical lines, and specialty materials, lifting average hourly rates across the U.S. engineering services market.
Consulting and design captured 17.76% of market revenue in 2025, driven by owners' desire for front-end expertise in BIM coordination, supply-chain localization, and resiliency planning. Digital-first delivery, including cloud-hosted common data environments and AI-assisted code checks, is reducing rework and shifting value upstream, reinforcing the segment's lead position in the U.S. engineering services market.
Process-and-plant engineering recorded outsized growth through mega-fab and gigafactory projects, where ultra-pure water, inert-gas systems, and robotic line-balancing demand deep specialty knowledge. Automation and digital-engineering services represent the highest CAGR outlook in the segment, linking sensor integration, edge analytics, and digital-twins that monetize post-commissioning optimization. Asset-management services are evolving into performance-based, data-subscription models that generate recurring cash flows, stabilizing top-line trajectories across the U.S. engineering services industry.
The United States Engineering Services Market Report is Segmented by Application (Civil, Mechanical, and More), Service Type (Consulting and Design, Process and Plant Engineering, and More), End-User Industry (Construction and Infrastructure, Oil and Gas, and More), Engagement Model (In-House, Outsourced / EPCM). The Market Forecasts are Provided in Terms of Value (USD).
List of Companies Covered in this Report:
- AECOM
- Jacobs Engineering Group
- Bechtel Corporation
- Fluor Corporation
- KBR Inc.
- HDR Inc.
- Terracon
- Black and Veatch
- Jensen Hughes
- ECS Group of Companies
- WSP USA
- Tetra Tech
- STV Group
- Arup (US)
- Gannett Fleming
- Burns and McDonnell
- HNTB Corporation
- Parsons Corporation
- Louis Berger (WSP)
- AtkinsRealis (U.S.)
Additional Benefits:
- The market estimate (ME) sheet in Excel format
- 3 months of analyst support
TABLE OF CONTENTS
1 INTRODUCTION
- 1.1 Study Assumptions and Market Definition
- 1.2 Scope of the Study
2 RESEARCH METHODOLOGY
3 EXECUTIVE SUMMARY
4 MARKET LANDSCAPE
- 4.1 Market Overview
- 4.2 Market Drivers
- 4.2.1 Federal Infrastructure-Funding Boom under 2021 IIJA
- 4.2.2 Accelerating Chip Fabs and Battery Gigafactory Build-outs
- 4.2.3 Near-shoring of Manufacturing Lines to the U.S.
- 4.2.4 Record-High Utility-Scale Solar and Wind Interconnection Queues
- 4.2.5 Defense Modernization (AUKUS, NGAD) Driving Specialized Design
- 4.2.6 AI-Enabled Digital-Twin Adoption Cutting Re-work
- 4.3 Market Restraints
- 4.3.1 Volatile Steel and Concrete Input-Cost Pass-Through Risks
- 4.3.2 Lengthy NEPA Environmental Reviews Delaying Starts
- 4.3.3 Skilled-Labor Shortages Inflating Billing Rates
- 4.3.4 State-by-State Licensing Variances Hindering Scale
- 4.4 Value / Supply-Chain Analysis
- 4.5 Regulatory and Technological Outlook
- 4.6 Porter's Five Forces
- 4.6.1 Bargaining Power of Buyers/Consumers
- 4.6.2 Bargaining Power of Suppliers
- 4.6.3 Threat of New Entrants
- 4.6.4 Threat of Substitute Products
- 4.6.5 Intensity of Competitive Rivalry
- 4.7 Comparative Analysis: In-house vs Outsourced Engineering
- 4.8 Vendor Service Innovation Trends
5 MARKET SIZE AND GROWTH FORECASTS (VALUE)
- 5.1 By Application
- 5.1.1 Civil
- 5.1.2 Mechanical
- 5.1.3 Electrical
- 5.1.4 Environmental
- 5.1.5 Chemical
- 5.2 By Service Type
- 5.2.1 Consulting and Design
- 5.2.2 Process and Plant Engineering
- 5.2.3 Product Engineering and Prototyping
- 5.2.4 Automation / Digital Engineering
- 5.2.5 Asset Management and OandM
- 5.3 By End-user Industry
- 5.3.1 Construction and Infrastructure
- 5.3.2 Oil and Gas
- 5.3.3 Manufacturing
- 5.3.4 Utilities (Power, Water)
- 5.3.5 Transportation (Rail, Airports, Ports)
- 5.3.6 Telecommunications and Data Centers
- 5.3.7 Healthcare Facilities
- 5.4 By Engagement Model
- 5.4.1 In-house
- 5.4.2 Outsourced / EPCM
6 COMPETITIVE LANDSCAPE
- 6.1 Market Concentration
- 6.2 Strategic Moves
- 6.3 Market Share Analysis
- 6.4 Company Profiles
- 6.4.1 AECOM
- 6.4.2 Jacobs Engineering Group
- 6.4.3 Bechtel Corporation
- 6.4.4 Fluor Corporation
- 6.4.5 KBR Inc.
- 6.4.6 HDR Inc.
- 6.4.7 Terracon
- 6.4.8 Black and Veatch
- 6.4.9 Jensen Hughes
- 6.4.10 ECS Group of Companies
- 6.4.11 WSP USA
- 6.4.12 Tetra Tech
- 6.4.13 STV Group
- 6.4.14 Arup (US)
- 6.4.15 Gannett Fleming
- 6.4.16 Burns and McDonnell
- 6.4.17 HNTB Corporation
- 6.4.18 Parsons Corporation
- 6.4.19 Louis Berger (WSP)
- 6.4.20 AtkinsRealis (U.S.)
7 MARKET OPPORTUNITIES AND FUTURE OUTLOOK
- 7.1 White-space and Unmet-Need Assessment
 工程服务市场:2026-2032年全球市场预测(依服务类型、经营模式、交付模式、服务期限、产业及客户类型划分)绘图服务市场:全球市场按产品类型、价格范围、应用和最终用户分類的预测 - 2026-2032 年
 2026年全球人工智慧(AI)工程市场报告2026年全球工程服务市场报告2026年全球工程研发外包市场报告2026年全球物理、工程与生命科学市场报告
 2026-2030年全球工程服务市场冷弯型钢工程服务市场按服务类型、型材类型、最终用途、通路和应用划分,全球预测(2026-2032年)水族馆工程服务市场按产品类型、服务类型、水质和应用划分-2026-2032年全球预测重型起重工程计划服务市场(按服务、技术、计划规模和最终用途产业划分),全球预测(2026-2032)