


 |
市场调查报告书
商品编码
1940783
美国光电:市场份额分析、行业趋势和统计数据、成长预测(2026-2031)United States Photonics - Market Share Analysis, Industry Trends & Statistics, Growth Forecasts (2026 - 2031) |
||||||
※ 本网页内容可能与最新版本有所差异。详细情况请与我们联繫。
美国光电市场预计将从 2025 年的 1,596.9 亿美元成长到 2026 年的 1,671.2 亿美元,预计到 2031 年将达到 2098.4 亿美元,2026 年至 2031 年的复合年增长率为 4.65%。
超大规模设施中人工智慧工作负载的激增、联邦政府对国内製造业的重新推动以及定向能源计划的实施,共同构建了一个比传统电信中心模式更为广泛的需求结构。硅光电平台正蓬勃发展,因为它们可以在现有的CMOS生产线上製造;而化合物半导体晶圆厂则受益于《晶片工业与资讯技术法案》(CHIPS Act)的津贴,从而抵消了高昂的资本成本。同时,微创成像和光生物调节疗法在医疗领域的应用,确保了持续的第二大成长引擎。稀土元素和III-V族材料的供应安全仍然存在不确定性,因为锗和镓的出口限制推高了原材料成本,并引发了国内的替代需求。
美国光电市场趋势与洞察
人工智慧主导的资料中心光I/O激增
2024年光收发器出货量成长创纪录的60%,反映出超大规模业者正从400G连结向800G连结过渡。 1.6T模组的试验也在进行中。硅光电占出货量的35%,因为整合电光晶粒降低了每位元功耗并简化了共封装光学元件。英特尔和Ayar Labs展示了到2026年实现单封装3.2T的蓝图,这证实了市场对积体光子电路的多年需求。美国能源部的百亿亿百万兆级计画进一步强化了这一趋势,因为超级电脑正在向光连接模组过渡,以实现节能扩展。
《CHIPS法案》国内製造业奖励措施
《晶片/科学法案》确保了2024年2.8亿美元的资金用于光电计划。连贯)获得了1.12亿美元用于扩大其磷化铟/碳化硅产能,而格罗方德公司(GlobalFoundries)获得了7500万美元用于硅光电开发。 AIM 光电的多计划晶圆服务透过共用掩模组和晶圆製造时间降低了Start-Ups的准入门槛,并促进了强大的国内供应商基础的形成。这些奖励有助于缩短前置作业时间,确保可靠的供应商,并降低海外供应链中断的风险。
资本密集型光电製造基础设施
被动元件需要10级洁净室,主动元件需要1级洁净室,这意味着其建造成本远高于传统半导体生产线。 AIM Photonics估计,一座满载运转的光电工厂造价在1亿至5亿美元之间,其中计量设备的成本是电子工具的两到三倍。国内晶圆厂数量有限,而此时市场对磷化铟和氮化硅平台的需求却激增,造成了产能瓶颈。
细分市场分析
医疗科技产业预计将以5.83%的复合年增长率成长,这反映出监管核准后,一旦临床疗效得到证实,采购预算就会随之稳定下来。资料通讯通讯仍是最大的细分市场,占美国光电市场份额的28.35%,这主要得益于超大规模流量向800G光纤通讯的迁移。雷射雷达在自动驾驶汽车和智慧基础设施监控领域的应用,正使测绘和感测技术获得日益增长的关注。同时,生产技术领域正利用高功率雷射开发积层製造生产线。
影像导引手术和动态疗法的强劲发展势头维持了其对宏观经济波动较为稳健的需求结构。照明和显示器产业趋于成熟,但园艺照明和紫外线消毒等细分市场仍蕴藏成长机会。量子运算、环境感测和空间平台等新兴领域为能够将成熟技术应用于新领域的供应商创造了价值选择。
集成光子电路预计将以6.05%的复合年增长率成长,这主要得益于市场对集成光源、调製器和检测器于单晶粒上的晶片级模组的需求不断增长。雷射和光源目前占据24.05%的市场份额,但其产品正逐渐趋于同质化,供应商需要将其与控制电子设备和软体捆绑销售。检测器和感测器则受益于汽车ADAS(进阶驾驶辅助系统)和照护现场诊断需求的成长,而崩光二极体和单光子计数器灵敏度的不断提高正是推动这一成长的主要因素。
光纤和波导等基础设施的需求持续成长,主要得益于遍远地区宽频部署的推动;而调变器的需求则因云骨干网中动态波长切换需求的不断增长而增加。无源光元件供应商正将业务重心转向严苛环境的太空船和海底系统,因为这些领域拥有更强的定价权。随着客户越来越倾向于选择提供完整子系统而非单一组件的供应商,供应商名单也不断精简。
其他福利:
- Excel格式的市场预测(ME)表
- 分析师支持(3个月)
目录
第一章 引言
- 研究假设和市场定义
- 调查范围
第二章调查方法
第三章执行摘要
第四章 市场情势
- 市场概览
- 市场驱动因素
- 人工智慧驱动型资料中心的光I/O快速成长
- 《晶片製造和生产法案》(CHIPS Act)鼓励国内製造业
- 国防雷射和定向能技术的资金投入正在增加
- 微创生物医学影像诊断技术的推广
- 自动驾驶汽车光达整合竞赛
- 量子光电研发投资
- 市场限制
- 资本密集型光子製造基础设施
- 熟练光电人员短缺
- 稀土元素/III-V族半导体供应链风险
- 标准与生态系互通性差距
- 产业供应链分析
- 宏观经济因素的影响
- 监管环境
- 技术展望
- 波特五力分析
- 供应商的议价能力
- 买方和消费者的议价能力
- 新进入者的威胁
- 替代品的威胁
- 竞争对手之间的竞争
第五章 市场规模与成长预测
- 透过使用
- 勘测与探测
- 生产技术
- 资料通讯
- 影像撷取与显示
- 医疗技术
- 照明
- 其他用途
- 依组件类型
- 雷射和光源
- 检测器和感测器
- 光纤和波导管
- 调製器和开关元件
- 积体光子电路
- 被动式光学元件(透镜、滤光片等)
- 按最终用户行业划分
- 电信和资料中心
- 工业製造
- 医学与生命科学
- 国防/航太
- 家用电子电器
- 能源与环境
- 透过技术
- 硅光电
- 光纤光子光电
- 自由空间与衍射光学
- 量子与非线性光电
第六章 竞争情势
- 市场集中度
- 策略趋势
- 市占率分析
- 公司简介
- Intel Corporation
- Lumentum Holdings Inc.
- Infinera Corporation
- Molex LLC(Koch Industries)
- Hamamatsu Photonics KK
- IPG Photonics Corporation
- Coherent Corp.
- Vescent Photonics Inc.
- Photonic Systems Inc.
- Thorlabs Inc.
- NEC Corporation
- ams OSRAM AG
- TRUMPF SE+Co. KG
- Polatis Ltd.(Huber+Suhner AG)
- Nokia Corporation
- Rockley Photonics Holdings Ltd.
- Lumibird SA
- Acacia Communications Inc.(Cisco)
- GlobalFoundries Inc.
- Analog Photonics LLC
第七章 市场机会与未来展望
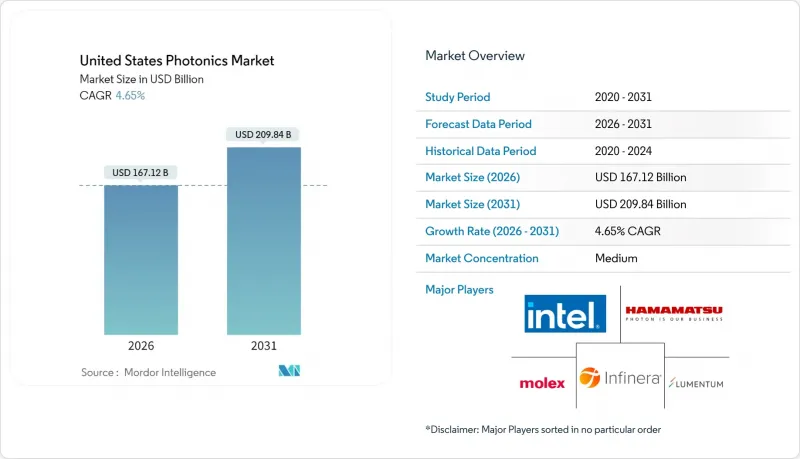
The United States photonics market is expected to grow from USD 159.69 billion in 2025 to USD 167.12 billion in 2026 and is forecast to reach USD 209.84 billion by 2031 at 4.65% CAGR over 2026-2031.
Surging artificial-intelligence workloads inside hyperscale facilities, a renewed federal push for on-shore manufacturing, and directed-energy programs together shape a demand profile that is broader than prior telecom-centric cycles. Silicon photonics platforms gain momentum because they can be produced on existing CMOS lines, while compound-semiconductor plants benefit from CHIPS Act grants that offset high capital costs. At the same time, healthcare adoption of minimally invasive imaging and photobiomodulation therapies secures a durable second growth engine. Supply security for rare-earths and III-V materials remains a swing factor as germanium and gallium export curbs inflate input costs and trigger domestic substitution efforts.
United States Photonics Market Trends and Insights
AI-driven datacenter optical-I/O boom
A record 60% jump in optical-transceiver shipments in 2024 reflected hyperscale operators' shift from 400 G to 800 G links, and trials for 1.6 T modules are underway. Silicon photonics captured 35% of those volumes because integrated electro-optical dies reduce power per bit and simplify co-packaged optics. Intel and Ayar Labs demonstrated roadmaps toward 3.2 T per package by 2026, ensuring a multi-year pull for integrated photonic circuits. Department of Energy exascale programs reinforce the trend as supercomputers pivot to optical interconnects for energy-efficient scaling.
CHIPS Act domestic manufacturing incentives
The CHIPS and Science Act reserved USD 280 million for photonics projects in 2024, with Coherent receiving USD 112 million to expand indium-phosphide and silicon-carbide capacity and GlobalFoundries gaining USD 75 million for silicon photonics. AIM Photonics' multi-project wafer service lowers entry costs for start-ups by sharing mask sets and fab time, catalyzing a richer domestic supplier base. These incentives shorten lead times, support trusted-supplier mandates, and mitigate exposure to overseas supply disruptions.
Cap-intensive photonic-fab infrastructure
Clean-room requirements of Class 10 for passive and Class 1 for active devices elevate construction outlays well above traditional semiconductor lines. AIM Photonics estimates USD 100-500 million for a full-capacity photonic fab, while metrology tools can cost 2-3X electronic counterparts. Limited domestic fab count forms a capacity bottleneck when demand surges for indium-phosphide or silicon-nitride platforms.
Other drivers and restraints analyzed in the detailed report include:
- Defense laser and directed-energy funding upswing
- Minimally invasive biomedical imaging adoption
- Rare-earth and III-V supply-chain risks
For complete list of drivers and restraints, kindly check the Table Of Contents.
Segment Analysis
Medical Technology captured a 5.83% CAGR outlook, reflecting regulatory approvals that anchor procurement budgets once clinical efficacy is proven. Data Communication still represents the largest slice at 28.35% of the United States photonics market share, propelled by hyperscale traffic migration to 800 G optics. Surveying and Detection gains incremental traction from autonomous-vehicle LiDAR and smart-infrastructure monitoring, while Production Technology leverages high-power lasers for additive manufacturing lines.
Momentum in image-guided surgery and photodynamic therapy sustains a demand profile resilient to macro-economic swings. Lighting and display sub-segments mature, yet horticultural and UV-sterilization niches provide targeted growth. Emerging areas, quantum computing, environmental sensing, and space platforms, create option value for suppliers positioned to spin off proven technologies into new verticals.
Integrated Photonic Circuits are slated for a 6.05% CAGR as customers gravitate toward chip-scale modules that embed sources, modulators, and detectors on a single die. Lasers and Sources hold a 24.05% share, but steady commoditization presses suppliers to bundle control electronics and software. Detectors and Sensors benefit from rising automotive ADAS and point-of-care diagnostics, underscoring sensitivity advances in avalanche photodiodes and single-photon counters.
Optical Fibers and Waveguides maintain baseline demand from rural broadband rollouts, whereas modulators experience a lift from dynamic wavelength switching in cloud backbones. Passive optics suppliers reposition toward harsh-environment spacecraft and subsea systems where pricing power is stronger. Customers increasingly favor vendors offering full subsystems over discrete parts, consolidating the vendor list.
The United States Photonics Market Report is Segmented by Application (Surveying and Detection, Production Technology, and More), Component Type (Lasers and Sources, Detectors and Sensors, and More), End-User Industry (Telecom and Datacenters, Industrial Manufacturing, and More), and Technology (Silicon Photonics, Optical Fiber Photonics, and More). The Market Forecasts are Provided in Terms of Value (USD).
List of Companies Covered in this Report:
- Intel Corporation
- Lumentum Holdings Inc.
- Infinera Corporation
- Molex LLC (Koch Industries)
- Hamamatsu Photonics K.K.
- IPG Photonics Corporation
- Coherent Corp.
- Vescent Photonics Inc.
- Photonic Systems Inc.
- Thorlabs Inc.
- NEC Corporation
- ams OSRAM AG
- TRUMPF SE + Co. KG
- Polatis Ltd. (Huber+Suhner AG)
- Nokia Corporation
- Rockley Photonics Holdings Ltd.
- Lumibird SA
- Acacia Communications Inc. (Cisco)
- GlobalFoundries Inc.
- Analog Photonics LLC
Additional Benefits:
- The market estimate (ME) sheet in Excel format
- 3 months of analyst support
TABLE OF CONTENTS
1 INTRODUCTION
- 1.1 Study Assumptions and Market Definition
- 1.2 Scope of the Study
2 RESEARCH METHODOLOGY
3 EXECUTIVE SUMMARY
4 MARKET LANDSCAPE
- 4.1 Market Overview
- 4.2 Market Drivers
- 4.2.1 AI-driven datacenter optical-I/O boom
- 4.2.2 CHIPS Act domestic manufacturing incentives
- 4.2.3 Defense laser and directed-energy funding upswing
- 4.2.4 Minimally-invasive biomedical imaging adoption
- 4.2.5 Autonomous-vehicle LiDAR integration race
- 4.2.6 Quantum-photonics R&D investments
- 4.3 Market Restraints
- 4.3.1 Cap-intensive photonic-fab infrastructure
- 4.3.2 Photonics-skilled talent shortage
- 4.3.3 Rare-earth / III-V supply-chain risks
- 4.3.4 Standards and ecosystem interoperability gaps
- 4.4 Industry Supply-Chain Analysis
- 4.5 Impact of Macroeconomic Factors
- 4.6 Regulatory Landscape
- 4.7 Technological Outlook
- 4.8 Porter's Five Forces Analysis
- 4.8.1 Bargaining Power of Suppliers
- 4.8.2 Bargaining Power of Buyers/Consumers
- 4.8.3 Threat of New Entrants
- 4.8.4 Threat of Substitutes
- 4.8.5 Intensity of Competitive Rivalry
5 MARKET SIZE AND GROWTH FORECASTS (VALUE)
- 5.1 By Application
- 5.1.1 Surveying and Detection
- 5.1.2 Production Technology
- 5.1.3 Data Communication
- 5.1.4 Image Capture and Display
- 5.1.5 Medical Technology
- 5.1.6 Lighting
- 5.1.7 Other Applications
- 5.2 By Component Type
- 5.2.1 Lasers and Sources
- 5.2.2 Detectors and Sensors
- 5.2.3 Optical Fibers and Waveguides
- 5.2.4 Modulators and Switched Devices
- 5.2.5 Integrated Photonic Circuits
- 5.2.6 Passive Optics (Lenses, Filters, etc.)
- 5.3 By End-User Industry
- 5.3.1 Telecom and Datacenters
- 5.3.2 Industrial Manufacturing
- 5.3.3 Healthcare and Life Sciences
- 5.3.4 Defense and Aerospace
- 5.3.5 Consumer Electronics
- 5.3.6 Energy and Environment
- 5.4 By Technology
- 5.4.1 Silicon Photonics
- 5.4.2 Optical Fiber Photonics
- 5.4.3 Free-space and Diffractive Optics
- 5.4.4 Quantum and Non-linear Photonics
6 COMPETITIVE LANDSCAPE
- 6.1 Market Concentration
- 6.2 Strategic Moves
- 6.3 Market Share Analysis
- 6.4 Company Profiles (includes Global level Overview, Market level overview, Core Segments, Financials as available, Strategic Information, Market Rank/Share for key companies, Products and Services, and Recent Developments)
- 6.4.1 Intel Corporation
- 6.4.2 Lumentum Holdings Inc.
- 6.4.3 Infinera Corporation
- 6.4.4 Molex LLC (Koch Industries)
- 6.4.5 Hamamatsu Photonics K.K.
- 6.4.6 IPG Photonics Corporation
- 6.4.7 Coherent Corp.
- 6.4.8 Vescent Photonics Inc.
- 6.4.9 Photonic Systems Inc.
- 6.4.10 Thorlabs Inc.
- 6.4.11 NEC Corporation
- 6.4.12 ams OSRAM AG
- 6.4.13 TRUMPF SE + Co. KG
- 6.4.14 Polatis Ltd. (Huber+Suhner AG)
- 6.4.15 Nokia Corporation
- 6.4.16 Rockley Photonics Holdings Ltd.
- 6.4.17 Lumibird SA
- 6.4.18 Acacia Communications Inc. (Cisco)
- 6.4.19 GlobalFoundries Inc.
- 6.4.20 Analog Photonics LLC
7 MARKET OPPORTUNITIES AND FUTURE OUTLOOK
- 7.1 White-space and Unmet-Need Assessment
 2026年全球光电市场报告
 先进光电市场预测至2034年—按产品、技术、应用、最终用户和地区分類的全球分析
 光电研究评论:2025
 光电市场报告:按类型、应用、最终用户和地区划分(2026-2034 年)
 光电市场:按产品类型、技术和应用分類的全球市场预测 - 2026-2032 年
 光电晶片市场分析及预测(至2035年):类型、产品类型、技术、组件、应用、材料类型、装置、最终用户、功能
 光子学市场:依产品类型、应用和终端用户产业划分 - 至2036年的全球预测光电市场分析及预测(至2035年):依类型、产品类型、服务、技术、组件、应用、材料类型、装置、最终用户、功能划分
 光电市场-全球产业规模、份额、趋势、机会及预测(依产品类型、应用、最终用户、地区及竞争格局划分,2021-2031年)光电装置市场-全球产业规模、份额、趋势、预测及机会(按产品、应用、产业、地区及竞争格局划分),2021-2031年