


 |
市场调查报告书
商品编码
1940796
美国设施管理:市场份额分析、行业趋势和统计数据、成长预测(2026-2031 年)United States Facility Management - Market Share Analysis, Industry Trends & Statistics, Growth Forecasts (2026 - 2031) |
||||||
※ 本网页内容可能与最新版本有所差异。详细情况请与我们联繫。
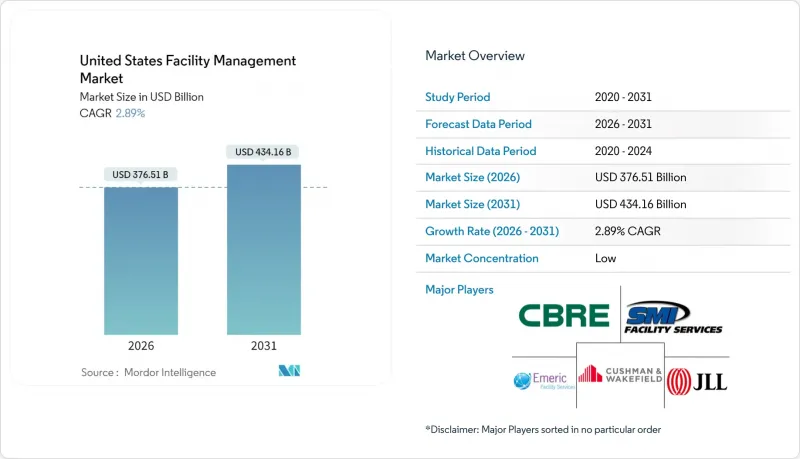
2025年美国设施管理市场价值为3,659.3亿美元,预计到2031年将达到4,341.6亿美元,而2026年为3,765.1亿美元。
预计在预测期(2026-2031 年)内,复合年增长率将达到 2.89%。
办公物业的商业房地产空置率高达14.1%,而工业地产则呈现强劲的吸纳势头,导致服务需求分化。硬性服务需求主导,因为企业无法推迟暖通空调、消防和基础设施维护;同时,随着后疫情时代职场对安全和健康通讯协定的要求不断提高,软性服务的需求也在增长。监管同样至关重要,《通膨控制法案》拨款9.75亿美元用于联邦建筑维修,加速了节能维修的需求。从物联网感测器到基于人工智慧的预测性维护,技术整合正在透过减少停机时间和优化公用设施来改变营运模式。
美国设施管理市场趋势与洞察
主要都会区的都市化和人口成长
奥斯汀和凤凰城等阳光地带的中心城市持续吸引企业和居住者,推动了对采用智慧建筑平台的新建和维修项目的需求。这些市场的设施管理人员必须在多元化的资产组合中平衡先进的自动化技术和传统的基础设施。知识经济时代的租户优先考虑弹性办公空间,迫使服务供应商提供即时入住率分析。在一系列极端天气事件之后,气候适应能力变得至关重要,这也增加了对紧急维护计画的要求。这些因素共同作用,提高了服务的复杂性和成本。
美国基础设施法案中产业投资的优先事项
联邦政府已拨款9.75亿美元用于维修4000万平方英尺的公共建筑,这引发了各州层级类似标准的连锁反应。 「美国製造」和「现行工资」条款推高了人事费用,迫使设施管理人员改善筹资策略和劳动力策略。电网现代化支出增加了维护电动车充电桩和整合能源储存系统係统的责任。由于业主寻求获得补贴合格的保证,合规性追踪已成为设施管理合约中的关键要素。由此可见,公共支出正在影响私人服务的模式。
主要设施管理业者的盈利指标
2024年,营运支出成长超过收入成长,导致利润率收窄,并限制了技术投资。 ABM Industries的收入增加了3.3%,但工资和公用事业成本的上涨侵蚀了利润率。分散的竞争环境限制了其定价权,尤其是在高成本的网路安全和合规服务领域。电费占公用事业成本的比例上升至58.9%,迫使企业将成本转嫁给消费者或降低服务品质。这种压力迫使小规模的营运商进行整合或专注于特定领域。
细分市场分析
到2025年,硬性服务将占美国设施管理市场58.45%的份额,因为客户将非自主性资产维护放在首位。预测性维护工具和物联网感测器正在将传统的机电工程营运转变为数据驱动的例行程序,从而减少非计划性停机时间。日益严格的消防和节能标准在成本压力下支撑了市场需求。法规主导的设备更新预计将继续推动美国设施管理市场硬性服务规模的温和成长。软性服务将以3.74%的复合年增长率成长,如今,人工智慧监控系统、感染控制清洁和适应混合办公模式的灵活餐饮模式已成为其重要组成部分。
软性服务供应商正透过提供符合环境、社会和治理(ESG)标准的清洁化学品以及即时入住率数据来优化人员配置,从而实现差异化竞争。安保合约也越来越多地纳入对门禁控制设备的网实整合监控。随着企业在后疫情时代持续改善员工体验,职场支援服务的重要性日益凸显。然而,劳动力短缺导致的薪资上涨正给盈利带来压力。在此背景下,美国设施管理市场正围绕着整合硬资产健康状况与居住者健康指标的平台,建构一个全新的生态系统。
其他福利:
- Excel格式的市场预测(ME)表
- 3个月的分析师支持
目录
第一章 引言
- 研究假设和市场定义
- 调查范围
第二章调查方法
第三章执行摘要
第四章 市场情势
- 市场概览
- 目前运转率
- 主要FM业者的盈利能力
- 劳动指标 - 劳动参与率
- 按服务类型分類的设施管理市场占有率(%)
- 以硬性服务分類的设施管理市场占有率(%)
- 软服务设施管理市场占有率(%)
- 主要都会区的都市化和人口成长
- 美国基础设施法案中产业投资的优先事项
- 与劳动和安全标准相关的监管驱动因素
- 司机
- 主要都会区的都市化和人口成长
- 美国基础设施法案中产业投资的优先事项
- 与劳动和安全标准相关的监管驱动因素
- 技术主导整合设施管理(物联网、楼宇管理系统、基于人工智慧的预测性维护)
- 强制性建筑性能标准推动性能验证服务
- 《通货膨胀控制法案》下的税收优惠将加速脱碳维修的需求。
- 抑制因素
- 主要FM业者的盈利能力
- 劳动指标 - 劳动参与率
- 城市中心商业不动产空置率上升
- 互联建筑系统网路安全责任风险增加
- 价值链分析
- PESTEL 分析
- 新参与企业的监管和立法框架
- 宏观经济指标对FM需求的影响
- 波特五力分析
- 供应商的议价能力
- 买方的议价能力
- 新进入者的威胁
- 替代品的威胁
- 竞争对手之间的竞争
- 投资与资金筹措分析
第五章 市场规模与成长预测
- 按服务类型
- 硬服务
- 资产管理
- 机电及暖通空调服务
- 消防设备和安全措施
- 其他硬体维修服务
- 软服务
- 办公室支援与安全
- 清洁服务
- 餐饮服务
- 其他软性调频服务
- 硬服务
- 以规定形式
- 内部管理
- 外包
- 单频调频
- 综合调频
- 整合调频
- 按最终用户行业划分
- 商业设施(IT/通讯、零售/仓储等)
- 餐饮服务业(饭店、餐厅、大型餐厅)
- 公共及公共基础设施(政府机构、教育机构、交通运输)
- 医疗保健(公立和私立机构)
- 工业和流程(製造业、能源业、采矿业)
- 其他终端用户产业(多用户住宅、娱乐、运动和休閒)
第六章 竞争情势
- 市场集中度
- 策略发展与伙伴关係
- 市占率分析
- 公司简介
- ABM Industries
- Emcor Group Inc.
- CBRE Group Inc.
- Jones Lang LaSalle IP, Inc.
- Cushman & Wakefield PLC
- Sodexo Inc.
- ISS Facility Services Inc.
- GDI Integrated Facility Services
- Kellermeyer Bergensons Services
- Guardian Service Industries Inc.
- AHI Facility Services Inc.
- Emeric Facility Services
- SMI Facility Services
- Shine Management and Facility Services
- Haworth Inc.
- Servicon Systems Inc.
- UG2 Facility Services
- Alpine Building Maintenance
- Aramark
- Broadway Building Services
第七章 市场机会与未来展望
The United States facility management market was valued at USD 365.93 billion in 2025 and estimated to grow from USD 376.51 billion in 2026 to reach USD 434.16 billion by 2031, at a CAGR of 2.89% during the forecast period (2026-2031).
Commercial real-estate vacancy at 14.1% in office assets contrasts with robust industrial absorption, shaping divergent demand for services. Hard services hold sway because organizations cannot postpone HVAC, fire-safety or infrastructure upkeep, yet soft services gain ground as post-pandemic workplaces demand heightened security and wellness protocols. Regulation is equally decisive; the Inflation Reduction Act allocates USD 975 million to federal building upgrades, accelerating demand for energy-efficient retrofits. Technology integration-from IoT sensors to AI-based predictive maintenance-reshapes operating models by cutting downtime and optimizing utilities.
United States Facility Management Market Trends and Insights
Urbanization and Population Growth in Major Metros
Sun Belt hubs such as Austin and Phoenix continue to attract businesses and residents, increasing demand for both new facilities and retrofits that incorporate smart-building platforms. Facility managers in these markets must juggle advanced automation with legacy infrastructure across mixed portfolios. Knowledge-economy tenants emphasize flexible spaces, pushing service providers to offer real-time occupancy analytics. Climate resilience has become integral after successive extreme-weather events, intensifying requirements for emergency maintenance planning. These combined pressures elevate service complexity and costs.
Sector Investment Priorities in United States Infrastructure Bills
Federal outlays direct USD 975 million to upgrade 40 million sq ft of public buildings, anchoring a spill-over of similar standards at state level. Buy-American and prevailing-wage clauses inflate labor costs, compelling facility managers to refine procurement and workforce strategies. Grid-modernization spending adds responsibilities for EV-charger upkeep and energy-storage integration. Compliance tracking now factors prominently into FM contracts as owners seek assurance of bill eligibility. Thus, public spending shapes private service design.
Profitability Rates of Major FM Players
Operating expenses exceeded revenue growth in 2024, shrinking margins and constraining tech investment. ABM Industries posted 3.3% revenue expansion but faced wage and utility inflation that eroded gains. Fragmented competition limits pricing power, especially for costly cyber-security and regulatory services. Elevated electricity now equals 58.9% of utility spend, forcing either pass-through pricing or service downgrades. The squeeze pushes small providers toward consolidation or niche specialization.
Other drivers and restraints analyzed in the detailed report include:
- Regulatory Drivers Specific to Labour and Safety Standards
- Technology-Led Integrated FM (IoT, BMS, AI-Based Predictive Maintenance)
- Workforce Indicators - Labor Participation
For complete list of drivers and restraints, kindly check the Table Of Contents.
Segment Analysis
Hard services controlled 58.45% of the United States facility management market in 2025 as clients prioritized non-discretionary asset upkeep. Predictive maintenance tools and IoT sensors are turning legacy MEP tasks into data-driven routines that curb unplanned downtime. Compliance with ever-tighter fire-safety and energy codes bolsters demand even amid cost pressures. The United States facility management market size for hard services will continue to edge upward given regulation-driven upgrades. Soft services, expanding at a 3.74% CAGR, now bundle AI-enabled surveillance, infection-control cleaning, and flexible catering models aligning with hybrid work.
Soft-service providers differentiate through ESG-aligned cleaning chemicals and real-time occupancy data that right-size staffing. Security contracts increasingly incorporate cyber-physical monitoring of access-control devices. As post-pandemic employee-experience initiatives endure, workplace support offerings gain relevance. However, labour shortages inflate wages, challenging profitability. The ecosystem thus evolves around integrated platforms that merge hard-asset health with occupant wellness metrics across the broader United States facility management market.
The United States Facility Management Market Report is Segmented by Service Type (Hard Services, Soft Services), Offering Type (In-House, Outsourced), End-User Industry (Commercial, Hospitality, Institutional and Public Infrastructure, Healthcare, Industrial and Process, and More), and Geography (Northeast, Southeast, Midwest, Southwest, West). The Market Forecasts are Provided in Terms of Value (USD).
List of Companies Covered in this Report:
- ABM Industries
- Emcor Group Inc.
- CBRE Group Inc.
- Jones Lang LaSalle IP, Inc.
- Cushman & Wakefield PLC
- Sodexo Inc.
- ISS Facility Services Inc.
- GDI Integrated Facility Services
- Kellermeyer Bergensons Services
- Guardian Service Industries Inc.
- AHI Facility Services Inc.
- Emeric Facility Services
- SMI Facility Services
- Shine Management and Facility Services
- Haworth Inc.
- Servicon Systems Inc.
- UG2 Facility Services
- Alpine Building Maintenance
- Aramark
- Broadway Building Services
Additional Benefits:
- The market estimate (ME) sheet in Excel format
- 3 months of analyst support
TABLE OF CONTENTS
1 INTRODUCTION
- 1.1 Study Assumptions and Market Definition
- 1.2 Scope of the Study
2 RESEARCH METHODOLOGY
3 EXECUTIVE SUMMARY
4 MARKET LANDSCAPE
- 4.1 Market Overview
- 4.1.1 Current Occupancy Rates
- 4.1.2 Profitability Rates of Major FM Players
- 4.1.3 Workforce Indicators - Labor Participation
- 4.1.4 Facility Management Market Share (%) - by Service Type
- 4.1.5 Facility Management Market Share (%) - by Hard Services
- 4.1.6 Facility Management Market Share (%) - by Soft Services
- 4.1.7 Urbanization and Population Growth in Major Metros
- 4.1.8 Sector Investment Priorities in US Infrastructure Bills
- 4.1.9 Regulatory Drivers Specific to Labour and Safety Standards
- 4.2 Drivers
- 4.2.1 Urbanization and Population Growth in Major Metros
- 4.2.2 Sector Investment Priorities in US Infrastructure Bills
- 4.2.3 Regulatory Drivers Specific to Labour and Safety Standards
- 4.2.4 Technology-Led Integrated FM (IoT, BMS, AI-Based Predictive Maintenance)
- 4.2.5 Building Performance Standards Mandates Driving Retro-Commissioning Services
- 4.2.6 Inflation Reduction Act Tax Incentives Accelerating Decarbonization Retrofit Demand
- 4.3 Restraints
- 4.3.1 Profitability Rates of Major FM Players
- 4.3.2 Workforce Indicators - Labor Participation
- 4.3.3 Rising Commercial Real Estate Vacancies in Urban Cores
- 4.3.4 Increasing Cybersecurity Liability Exposure in Connected Building Systems
- 4.4 Value Chain Analysis
- 4.5 PESTEL Analysis
- 4.6 Regulatory and Legislative Framework for Market Entrants
- 4.7 Impact of Macroeconomic Indicators on FM Demand
- 4.8 Porter's Five Forces Analysis
- 4.8.1 Bargaining Power of Suppliers
- 4.8.2 Bargaining Power of Buyers
- 4.8.3 Threat of New Entrants
- 4.8.4 Threat of Substitute Services
- 4.8.5 Intensity of Competitive Rivalry
- 4.9 Investment and Funding Analysis
5 MARKET SIZE AND GROWTH FORECASTS (VALUE)
- 5.1 By Service Type
- 5.1.1 Hard Services
- 5.1.1.1 Asset Management
- 5.1.1.2 MEP and HVAC Services
- 5.1.1.3 Fire Systems and Safety
- 5.1.1.4 Other Hard FM Services
- 5.1.2 Soft Services
- 5.1.2.1 Office Support and Security
- 5.1.2.2 Cleaning Services
- 5.1.2.3 Catering Services
- 5.1.2.4 Other Soft FM Services
- 5.1.1 Hard Services
- 5.2 By Offering Type
- 5.2.1 In-house
- 5.2.2 Outsourced
- 5.2.2.1 Single FM
- 5.2.2.2 Bundled FM
- 5.2.2.3 Integrated FM
- 5.3 By End-user Industry
- 5.3.1 Commercial (IT and Telecom, Retail and Warehouses, etc.)
- 5.3.2 Hospitality (Hotels, Eateries, Large-scale Restaurants)
- 5.3.3 Institutional and Public Infrastructure (Govt, Education, Transportation)
- 5.3.4 Healthcare (Public and Private Facilities)
- 5.3.5 Industrial and Process (Manufacturing, Energy, Mining)
- 5.3.6 Other End-user Industries (Multi-housing, Entertainment, Sports and Leisure)
6 COMPETITIVE LANDSCAPE
- 6.1 Market Concentration
- 6.2 Strategic Moves and Partnerships
- 6.3 Market Share Analysis
- 6.4 Company Profiles (Includes Global level Overview, Market level overview, Core Segments, Financials as available, Strategic Information, Market Rank/Share for key companies, Products and Services, and Recent Developments)
- 6.4.1 ABM Industries
- 6.4.2 Emcor Group Inc.
- 6.4.3 CBRE Group Inc.
- 6.4.4 Jones Lang LaSalle IP, Inc.
- 6.4.5 Cushman & Wakefield PLC
- 6.4.6 Sodexo Inc.
- 6.4.7 ISS Facility Services Inc.
- 6.4.8 GDI Integrated Facility Services
- 6.4.9 Kellermeyer Bergensons Services
- 6.4.10 Guardian Service Industries Inc.
- 6.4.11 AHI Facility Services Inc.
- 6.4.12 Emeric Facility Services
- 6.4.13 SMI Facility Services
- 6.4.14 Shine Management and Facility Services
- 6.4.15 Haworth Inc.
- 6.4.16 Servicon Systems Inc.
- 6.4.17 UG2 Facility Services
- 6.4.18 Alpine Building Maintenance
- 6.4.19 Aramark
- 6.4.20 Broadway Building Services
7 MARKET OPPORTUNITIES AND FUTURE OUTLOOK
- 7.1 White-space and Unmet-Need Assessment
- 7.2 Technology-led Integrated FM (IoT, BMS, AI-based Predictive Maintenance)
- 7.3 ESG-compliant FM Solutions Demand
- 7.4 Future Service-Model Shifts (Outcome-based Contracts)
 设施管理市场:2026-2032年全球市场预测(依产品、产品模式、部署类型、公司规模及最终用途划分)
 设施管理市场规模、份额、趋势和预测:按解决方案、服务、部署类型、组织规模、行业和地区划分,2026-2034 年设施管理服务市场:2026-2032年全球市场预测(依服务类型、合约类型、服务交付方式、最终用户和组织规模划分)
 2026年全球地下设施维护与管理市场报告2026年全球硬性服务设施管理市场报告2026年全球设施支援服务市场报告2026年全球设施管理服务市场报告2026年全球软性服务设施管理市场报告
 设施管理市场规模、份额、成长及全球产业分析:按类型、应用和地区分類的洞察,2026-2034 年预测硬设施管理市场:依服务类型、合约类型、所有权类型和最终用户产业划分-2026-2032年全球市场预测