


 |
市场调查报告书
商品编码
1940799
冷却器:市场占有率分析、产业趋势与统计、成长预测(2026-2031)Chiller - Market Share Analysis, Industry Trends & Statistics, Growth Forecasts (2026 - 2031) |
||||||
※ 本网页内容可能与最新版本有所差异。详细情况请与我们联繫。
预计到 2026 年,冷却器市场规模将达到 132.1 亿美元,高于 2025 年的 125.6 亿美元。
预计到 2031 年,该市场规模将达到 169.6 亿美元,2026 年至 2031 年的复合年增长率为 5.14%。
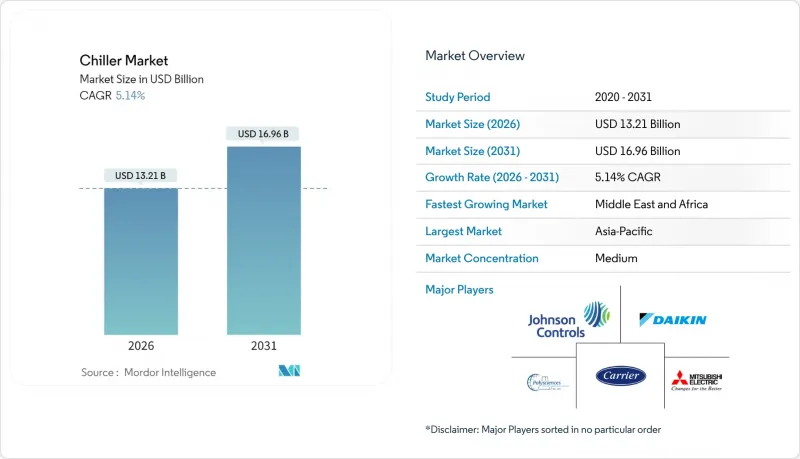
由于资料中心营运商、食品加工商和製造商追求精确的温度控制、能源效率和合规性,市场需求仍然强劲。快速的数位化,特别是每机架超过 100kW 的工作负载成长,正推动着温度控管从传统的风冷系统转向液冷平台的转变。同时,政策主导的HFC 淘汰加速了低全球暖化潜势 (GWP) 技术的应用,而铜价波动和技能短缺则影响资本投资决策。亚太地区仍然是销量成长的主要驱动力,而中东和非洲地区的成长速度最快,基础设施项目和恶劣的气候条件推高了製冷需求。技术差异化(变速压缩机、人工智慧分析、节水设计)仍是供应商竞争力的核心,支撑着冷却器市场的持续投资。
全球冷却器市场趋势与洞察
资料中心对精密冷却的需求日益增长
新一代超大规模资料中心和託管机房正在部署功率超过 100kW 的机架,这使得传统风冷系统的效能接近极限。微软展示了完全无水冷却方案,每年每个机房可节省 1.25 亿公升水,显示水资源管理与散热效能同样重要。製造商正积极回应,推出承包液冷式冷却器、远端监控系统和冗余设计,以确保设定温度偏差小于 1°C。加值服务合约包含预测性维护,从而确保人工智慧工作负载的运作,满足其对每一毫秒运算资源的货币化需求。这些趋势正在为冷却设备市场一个利润丰厚的成长领域奠定基础。
商业建筑中暖通空调冷却器的应用日益广泛
电气化强制措施加速了业主用变速、低全球暖化潜值(GWP)冷却器机组取代老旧瓦斯机组的进程。与ASHRAE 90.1基准值相比,后者可节能高达50%。美国法规要求到2026年,新的商业系统必须使用低GWP冷媒,这导致冷水机组的更换週期提前,并增加了对先进冷却器的订单。三菱电机在肯塔基州投资1.435亿美元兴建压缩机工厂,显示对当地持续需求的信心。建筑物业主将高效能冷却器视为应对能源成本波动的有效手段,儘管初始成本较高,但投资回收期更短。这些因素共同推动了冷却器市场规模的扩大。
高初始资本支出
整合人工智慧分析和低全球暖化潜值(GWP)冷媒的先进冷却器比传统机型贵15-20%,导致对价格敏感的买家投资回收期延长。铜价飙升至每磅4.88美元以上,推高了热交换器成本,挤压了原始设备製造商(OEM)的利润空间。新兴市场进口商面临货币贬值,进一步推高了到岸价格。因此,许多设施管理人员推迟了升级计划,限制了冷却器市场近期的成长。
细分市场分析
预计到2025年,水冷式冷水机组将占据冷却器市场55.80%的份额,凭藉水卓越的热容量,能够高效处理500冷吨以上的负载。对于拥有冷却塔和储水系统的资本密集设施而言,其目标是在长达数十年的使用寿命内最大限度地降低营运成本。然而,随着维修计划优先考虑安装速度和基础设施的精简,空冷式冷水机组的年复合成长率(CAGR)仍维持在8.62%。
製造商透过微通道冷凝器和变速风扇缩小了性能差距,提高了部分负荷效率。中东和非洲缺水地区以及美国西南部部分地区已采用空气冷却来降低能耗并规避监管风险。超大规模资料中心供应商进行的零水冷却试验表明,市场策略正在转变,长期需求将转向空气冷却,从而重塑冷却器市场格局。
由于螺桿压缩机拥有宽广的製冷量范围和可靠的负载追踪能力,预计到2025年将占据冷却器市场37.95%的份额,继续保持其在化工、塑胶行业和中型商业设施中的主力地位。同时,离心式压缩机凭藉其磁浮轴承和无油设计(可减少维护)以及一流的满载效率,以7.28%的复合年增长率增长。
两种配置均标配变频驱动装置,能耗降低高达 30%。涡旋式冷冻机在小规模商业建筑中依然广受欢迎,而往復式冷冻机则服务于一些精密应用领域。吸收式冷却器在废热驱动冷却效果显着的领域中保持着相当大的市场份额。这使得供应商的产品线更加丰富,涵盖了多种压缩机技术,从而涵盖了冷却器市场的各个领域。
冷却器市场依散热方式(水冷式、气冷式)、压缩机型式(螺桿式、涡卷式、往復式等)、容量范围(小于 50KW、50-350KW、350-700KW、700-1200KW、大于 1200KW)、冷媒类型(HFCKW等)、终端用户产业(化学和石化、食品和饮料等)以及地区(北美、南美、欧洲、亚太、中东和非洲)进行细分。
区域分析
到2025年,亚太地区将占据冷却器市场42.05%的份额,这主要得益于中国电子组装线的扩张、印度製药业的蓬勃发展以及东南亚地区的契约製造。大金等区域供应商正在推动零件本地化采购,以缩短前置作业时间并降低成本。政府推行的「印度製造」等宣传活动旨在使製造业占GDP的比重达到25%,从而支撑未来多年的冷冻需求。
预计到2031年,中东和非洲地区将以9.05%的复合年增长率实现最快增长,这主要受严酷的气候条件以及NEOM和卢赛尔等大型企划(这些项目需要大规模的暖通空调和区域冷暖气空调製冷系统)的推动。水资源短缺促使空气冷却技术广泛应用,而油气加工厂则引进了适用于沙漠环境的耐腐蚀冷却器。 CVC和Tabreed等私募股权公司收购阿联酋一家区域供冷企业的案例,也凸显了该地区的高盈利。
北美和欧洲保持了其技术领先地位,重点关注资料中心、生物技术和性能再检验的机会。开利2025年第一季的销售额激增表明,儘管销售成长仅为个位数,但高价值应用仍蕴藏着巨大的成长潜力。欧洲的氟碳化合物监管蓝图加速了新型冷媒的引入,但宏观经济疲软抑制了销售成长。拉丁美洲迎来了新的成长机会,对工业园区和冷库的投资逐步提升了热力基础设施的专业化水平,并推动了全球冷却器市场的扩张。
其他福利:
- Excel格式的市场预测(ME)表
- 3个月的分析师支持
目录
第一章 引言
- 研究假设和市场定义
- 调查范围
第二章调查方法
第三章执行摘要
第四章 市场情势
- 市场概览
- 市场驱动因素
- 资料中心对精密冷却的需求日益增长
- 商业建筑中暖通空调冷却器的应用日益广泛
- 加工食品和饮料消费量增加
- 新兴经济体的快速工业化
- 引进低全球暖化潜势冷媒冷却器(CBAM效应)
- 人工智慧驱动的预测性维护可提高投资报酬率
- 市场限制
- 高初始资本支出
- 加强对氢氟碳化合物(HFCs)的环境监管
- 铜价波动推高了热交换器成本。
- 熟练的冷却器维修技术人员短缺
- 价值链分析
- 监管环境
- 技术展望
- 波特五力分析
- 供应商的议价能力
- 买方的议价能力
- 新进入者的威胁
- 替代品的威胁
- 竞争对手之间的竞争
- 宏观经济因素的影响
第五章 市场规模与成长预测
- 透过热排气法(冷却型)
- 水冷
- 空冷式
- 按压缩机类型
- 螺桿式冷却器
- 涡卷式冷却器
- 往復式冷却器
- 离心式冷却器
- 吸收式冷却器
- 按容量范围
- 小于50千瓦
- 50-350 kW
- 350~700 kW
- 700~1,200 kW
- 超过1200千瓦
- 依冷媒类型
- 氢氟碳化合物(HFCs)
- 氢氟烯烃(HFOs)
- 天然气(二氧化碳、氨气、丙烷)
- 氟烃塑胶(HCFCs - 已逐步淘汰)
- 水基/磁力轴承
- 按最终用户行业划分
- 化学品和石油化工
- 食品/饮料
- 医疗和药品
- 塑胶和橡胶
- 资料中心和IT
- 商业建筑
- 其他的
- 按地区
- 北美洲
- 我们
- 加拿大
- 墨西哥
- 南美洲
- 巴西
- 阿根廷
- 南美洲其他地区
- 欧洲
- 德国
- 英国
- 法国
- 义大利
- 西班牙
- 俄罗斯
- 其他欧洲地区
- 亚太地区
- 中国
- 日本
- 印度
- 韩国
- 东南亚
- 亚太其他地区
- 中东和非洲
- 中东
- 沙乌地阿拉伯
- 阿拉伯聯合大公国
- 土耳其
- 其他中东地区
- 非洲
- 南非
- 奈及利亚
- 埃及
- 其他非洲地区
- 中东
- 北美洲
第六章 竞争情势
- 市场集中度
- 策略趋势
- 市占率分析
- 公司简介
- Carrier Global Corporation
- Mitsubishi Electric Corporation
- Daikin Industries, Ltd.
- Trane Technologies plc
- Johnson Controls International plc
- LG Electronics Inc.
- GEA Group Aktiengesellschaft
- Danfoss A/S
- Climaveneta SpA
- Thermax Limited
- Smardt Chiller Group Inc.
- Dimplex Thermal Solutions
- Polyscience Inc.
- Shuangliang Eco-Energy Systems Co., Ltd.
- Hitachi, Ltd.
- Midea Group Co., Ltd.
- Haier Smart Home Co., Ltd.
- Baltimore Aircoil Company, Inc.
- ENGIE Refrigeration GmbH
- Bosch Thermotechnology Ltd.
- Dunham-Bush Holding Bhd.
- Hisense HVAC Equipment Co., Ltd.
- Arctic Chiller Group Ltd.
- KKT Kraus GmbH
- Frigel Firenze SpA
第七章 市场机会与未来展望
The chillers market size in 2026 is estimated at USD 13.21 billion, growing from 2025 value of USD 12.56 billion with 2031 projections showing USD 16.96 billion, growing at 5.14% CAGR over 2026-2031.
Demand has remained resilient as data-center operators, food processors, and manufacturers pursue precise temperature control, energy efficiency, and regulatory compliance. Rapid digitization, especially workloads exceeding 100 kW per rack, has moved thermal management beyond conventional air systems toward liquid-ready platforms. In parallel, policy-driven HFC phase-downs are accelerating low-GWP adoption, while volatile copper prices and technician shortages influence capital decisions. Asia-Pacific continued to anchor volume growth, but the Middle East and Africa delivered the fastest gains as infrastructure programs and extreme climates intensified cooling needs. Technology differentiation-variable-speed compressors, AI analytics, and water-saving designs-remains central to supplier competitiveness, underpinning sustained investment across the chillers market.
Global Chiller Market Trends and Insights
Rising demand for precision cooling in data centres
Next-generation hyperscale and colocation sites deployed racks that exceeded 100 kW, pushing legacy air systems to their thermal limits. Microsoft validated fully water-free cooling concepts that conserve 125 million liters per facility annually, highlighting water stewardship alongside thermal performance. Manufacturers responded with turnkey liquid-ready chillers, remote monitoring packages, and redundant designs that guarantee sub-1 °C set-point deviation. Premium service contracts now bundle predictive maintenance, ensuring uptime for AI workloads that monetize every millisecond of compute. These dynamics underpin a high-margin growth pocket within the chillers market.
Growing adoption of HVAC chillers in commercial buildings
Electrification mandates drove owners to swap aging gas units for variable-speed, low-GWP chillers that cut energy use up to 50% versus ASHRAE 90.1 baselines. U.S. regulations requiring low-GWP refrigerants in new commercial systems by 2026 triggered an early replacement cycle, lifting order books for advanced chillers. Mitsubishi Electric committed USD 143.5 million to a Kentucky compressor plant, signalling confidence in sustained regional demand. Building owners viewed higher-efficiency chillers as a hedge against volatile utility prices, accelerating payback even as upfront costs rose. These factors collectively widen the addressable chiller market.
High initial capital expenditure
Advanced chillers that integrate AI analytics and low-GWP refrigerants cost 15-20% more than legacy units, prolonging payback for price-sensitive buyers. Recent spikes in copper above USD 4.88 per lb raised heat-exchanger costs and pressured OEM margins. Emerging-market importers faced currency devaluation, further inflating landed prices. Consequently, many facility managers deferred replacements, tempering short-term expansion in the chillers market.
Other drivers and restraints analyzed in the detailed report include:
- Increasing consumption of processed food and beverages
- Rapid industrialization in emerging economies
- Stricter environmental regulations on HFCs
For complete list of drivers and restraints, kindly check the Table Of Contents.
Segment Analysis
Water-cooled units controlled 55.80% of the chillers market share in 2025, leveraging water's superior heat capacity to serve loads above 500 tons efficiently. Capital-intensive facilities with existing cooling towers and retained water systems to minimize operating costs over multi-decade lifecycles. Nevertheless, air-cooled systems advanced at 8.62% CAGR as retrofit projects prioritized installation speed and reduced infrastructure.
Manufacturers narrowed historical performance gaps through micro-channel condensers and variable-speed fans that improve part-load efficiency. Water-scarce regions, Middle East, Africa, parts of the U.S. Southwest, favored air-cooled adoption to cut consumption and regulatory risk. Hyperscale providers piloted zero-water cooling, underscoring a strategic pivot that could redirect long-term demand toward air variants, reshaping the chillers market.
Screw compressors captured 37.95% of the chillers market in 2025 thanks to broad capacity coverage and load-following reliability. They remained the workhorse for chemical, plastics, and medium-sized commercial installations. Centrifugal models, however, expanded at 7.28% CAGR as magnetic bearings and oil-free designs cut maintenance and delivered best-in-class full-load efficiency.
Variable-speed drives became standard across both architectures, slicing energy bills up to 30%. Scroll units retained traction in small commercial buildings, while reciprocating machines addressed niche precision applications. Absorption chillers held a modest share where waste-heat sources justified thermally driven cooling. Supplier portfolios thus spanned multiple compressor technologies to service the full spectrum of the chillers market.
Chillers Market is Segmented by Heat Rejection Method (Water-Cooled, and Air-Cooled), Compressor Type (Screw, Scroll, Reciprocating, and More), Capacity Range (<50 KW, 50-350 KW, 350-700 KW, 700-1200 KW, and >1200 KW), Refrigerant Type (HFC, HFO, and More), End-User Industry (Chemicals and Petrochemicals, Food and Beverage, and More), and Geography (North America, South America, Europe, Asia-Pacific, and Middle East and Africa).
Geography Analysis
Asia-Pacific held 42.05% of the chillers market in 2025, driven by China's electronics assembly lines, India's expanding pharma hubs, and Southeast Asian contract manufacturing. Regional suppliers such as Daikin are localizing component sourcing, shortening lead times, and cutting costs. Government campaigns like "Make in India" targeted a 25% manufacturing GDP share, anchoring multi-year cooling demand.
Middle East and Africa posted the quickest 9.05% CAGR through 2031 as extreme climates and mega-projects, NEOM, Lusail, required large-scale HVAC and district systems. Water scarcity spurred air-cooled adoption, while oil-and-gas processing plants ordered corrosion-resistant chillers for desert duty. Private-equity deals, like CVC and Tabreed's UAE district cooling acquisition, underscored the region's attractive returns.
North America and Europe remained technology leaders, focusing on data-center, biotech, and retro-commissioning opportunities. Carrier's Q1 2025 sales jump illustrated upside tied to high-value applications despite low single-digit unit growth. Europe's F-gas roadmap accelerated novel refrigerant uptake, though macroeconomic softness tempered volume expansion. Latin America offered emerging upside where industrial parks and cold-storage investments slowly professionalized thermal infrastructure, extending the global reach of the chillers market.
- Carrier Global Corporation
- Mitsubishi Electric Corporation
- Daikin Industries, Ltd.
- Trane Technologies plc
- Johnson Controls International plc
- LG Electronics Inc.
- GEA Group Aktiengesellschaft
- Danfoss A/S
- Climaveneta S.p.A.
- Thermax Limited
- Smardt Chiller Group Inc.
- Dimplex Thermal Solutions
- Polyscience Inc.
- Shuangliang Eco-Energy Systems Co., Ltd.
- Hitachi, Ltd.
- Midea Group Co., Ltd.
- Haier Smart Home Co., Ltd.
- Baltimore Aircoil Company, Inc.
- ENGIE Refrigeration GmbH
- Bosch Thermotechnology Ltd.
- Dunham-Bush Holding Bhd.
- Hisense HVAC Equipment Co., Ltd.
- Arctic Chiller Group Ltd.
- KKT Kraus GmbH
- Frigel Firenze S.p.A.
Additional Benefits:
- The market estimate (ME) sheet in Excel format
- 3 months of analyst support
TABLE OF CONTENTS
1 INTRODUCTION
- 1.1 Study Assumptions and Market Definition
- 1.2 Scope of the Study
2 RESEARCH METHODOLOGY
3 EXECUTIVE SUMMARY
4 MARKET LANDSCAPE
- 4.1 Market Overview
- 4.2 Market Drivers
- 4.2.1 Rising demand for precision cooling in data centres
- 4.2.2 Growing adoption of HVAC chillers in commercial buildings
- 4.2.3 Increasing consumption of processed food and beverages
- 4.2.4 Rapid industrialisation in emerging economies
- 4.2.5 Uptake of low-GWP refrigerant chillers (CBAM effect)
- 4.2.6 AI-based predictive maintenance improves ROI
- 4.3 Market Restraints
- 4.3.1 High initial capital expenditure
- 4.3.2 Stricter environmental regulation on HFCs
- 4.3.3 Volatile copper prices raising heat-exchanger costs
- 4.3.4 Shortage of skilled chiller service technicians
- 4.4 Value Chain Analysis
- 4.5 Regulatory Landscape
- 4.6 Technological Outlook
- 4.7 Porter's Five Forces Analysis
- 4.7.1 Bargaining Power of Suppliers
- 4.7.2 Bargaining Power of Buyers
- 4.7.3 Threat of New Entrants
- 4.7.4 Threat of Substitutes
- 4.7.5 Intensity of Competitive Rivalry
- 4.8 Impact of Macroeconomic Factors
5 MARKET SIZE AND GROWTH FORECASTS (VALUE)
- 5.1 By Heat Rejection Method (Type of Cooling)
- 5.1.1 Water-Cooled
- 5.1.2 Air-Cooled
- 5.2 By Compressor Type
- 5.2.1 Screw Chillers
- 5.2.2 Scroll Chillers
- 5.2.3 Reciprocating Chillers
- 5.2.4 Centrifugal Chillers
- 5.2.5 Absorption Chillers
- 5.3 By Capacity Range
- 5.3.1 < 50 kW
- 5.3.2 50 - 350 kW
- 5.3.3 350 - 700 kW
- 5.3.4 700 - 1 200 kW
- 5.3.5 > 1 200 kW
- 5.4 By Refrigerant Type
- 5.4.1 Hydrofluorocarbon (HFC)
- 5.4.2 Hydrofluoro-olefin (HFO)
- 5.4.3 Natural (CO2, NH3, Propane)
- 5.4.4 Hydrochlorofluorocarbon (HCFC - phase-out)
- 5.4.5 Water-based / Magnetic-bearing
- 5.5 By End-User Industry
- 5.5.1 Chemicals and Petrochemicals
- 5.5.2 Food and Beverage
- 5.5.3 Medical and Pharmaceutical
- 5.5.4 Plastics and Rubber
- 5.5.5 Data Centres and IT
- 5.5.6 Commercial Buildings
- 5.5.7 Others
- 5.6 By Geography
- 5.6.1 North America
- 5.6.1.1 United States
- 5.6.1.2 Canada
- 5.6.1.3 Mexico
- 5.6.2 South America
- 5.6.2.1 Brazil
- 5.6.2.2 Argentina
- 5.6.2.3 Rest of South America
- 5.6.3 Europe
- 5.6.3.1 Germany
- 5.6.3.2 United Kingdom
- 5.6.3.3 France
- 5.6.3.4 Italy
- 5.6.3.5 Spain
- 5.6.3.6 Russia
- 5.6.3.7 Rest of Europe
- 5.6.4 Asia-Pacific
- 5.6.4.1 China
- 5.6.4.2 Japan
- 5.6.4.3 India
- 5.6.4.4 South Korea
- 5.6.4.5 Southeast Asia
- 5.6.4.6 Rest of Asia-Pacific
- 5.6.5 Middle East and Africa
- 5.6.5.1 Middle East
- 5.6.5.1.1 Saudi Arabia
- 5.6.5.1.2 United Arab Emirates
- 5.6.5.1.3 Turkey
- 5.6.5.1.4 Rest of Middle East
- 5.6.5.2 Africa
- 5.6.5.2.1 South Africa
- 5.6.5.2.2 Nigeria
- 5.6.5.2.3 Egypt
- 5.6.5.2.4 Rest of Africa
- 5.6.5.1 Middle East
- 5.6.1 North America
6 COMPETITIVE LANDSCAPE
- 6.1 Market Concentration
- 6.2 Strategic Moves
- 6.3 Market Share Analysis
- 6.4 Company Profiles (includes Global Level Overview, Market Level Overview, Core Segments, Financials as available, Strategic Information, Market Rank/Share, Products and Services, Recent Developments)
- 6.4.1 Carrier Global Corporation
- 6.4.2 Mitsubishi Electric Corporation
- 6.4.3 Daikin Industries, Ltd.
- 6.4.4 Trane Technologies plc
- 6.4.5 Johnson Controls International plc
- 6.4.6 LG Electronics Inc.
- 6.4.7 GEA Group Aktiengesellschaft
- 6.4.8 Danfoss A/S
- 6.4.9 Climaveneta S.p.A.
- 6.4.10 Thermax Limited
- 6.4.11 Smardt Chiller Group Inc.
- 6.4.12 Dimplex Thermal Solutions
- 6.4.13 Polyscience Inc.
- 6.4.14 Shuangliang Eco-Energy Systems Co., Ltd.
- 6.4.15 Hitachi, Ltd.
- 6.4.16 Midea Group Co., Ltd.
- 6.4.17 Haier Smart Home Co., Ltd.
- 6.4.18 Baltimore Aircoil Company, Inc.
- 6.4.19 ENGIE Refrigeration GmbH
- 6.4.20 Bosch Thermotechnology Ltd.
- 6.4.21 Dunham-Bush Holding Bhd.
- 6.4.22 Hisense HVAC Equipment Co., Ltd.
- 6.4.23 Arctic Chiller Group Ltd.
- 6.4.24 KKT Kraus GmbH
- 6.4.25 Frigel Firenze S.p.A.
7 MARKET OPPORTUNITIES AND FUTURE OUTLOOK
- 7.1 White-space and Unmet-Need Assessment
 半导体冷却技术市场预测至2034年-全球分析(按冷却方式、组件、冷却介质、封装等级、技术、部署模式、应用、最终用户和地区划分)
 半导体冷却器市场:按类型、应用和地区划分(2026-2034 年)
 冷却器市场:依功能、压缩机技术、功率范围、应用及最终用途划分-2026-2032年全球市场预测盐水冷却器市场:按类型、冷却能力、应用、循环方式、终端用户产业和分销管道划分-2026-2032年全球市场预测桌上型液体冷却器市场:按类型、冷却能力、流体类型、应用、最终用户和分销管道划分 - 全球预测,2026-2032 年
 半导体温度控製冷却器:全球市场份额和排名、总收入和需求预测(2026-2032 年)
 先进半导体冷却系统市场分析及预测(至2035年):依类型、产品类型、服务、技术、组件、应用、材质、装置、最终用户及功能划分
 2026-2034年全球冷却器市场规模、份额、趋势和成长分析报告涡轮冷水机市场规模、占有率、成长及全球产业分析:依类型、应用和地区划分的洞察与预测(2026-2034 年)
 2026年全球冷却器市场报告