


 |
市场调查报告书
商品编码
1940837
非洲化肥市场:市场占有率分析、产业趋势与统计、成长预测(2026-2031年)Africa Fertilizers - Market Share Analysis, Industry Trends & Statistics, Growth Forecasts (2026 - 2031) |
||||||
※ 本网页内容可能与最新版本有所差异。详细情况请与我们联繫。
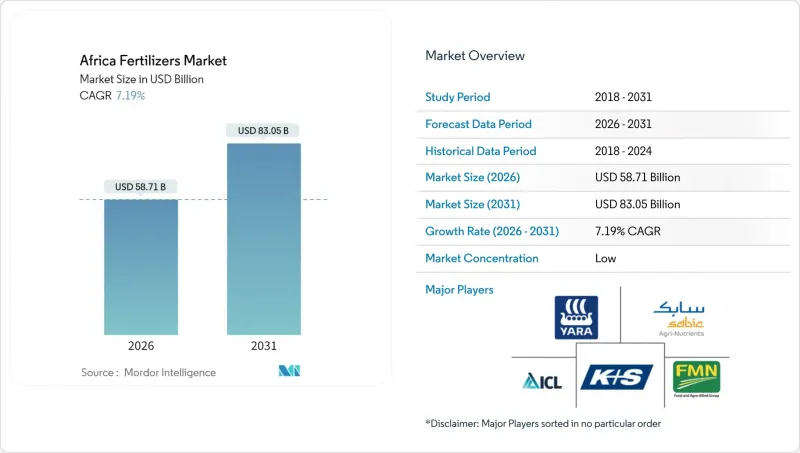
2025年非洲化肥市场价值547.7亿美元,预计2031年将达到830.5亿美元,高于2026年的587.1亿美元。
预计在预测期(2026-2031 年)内,复合年增长率将达到 7.19%。
非洲大陆各国政府优先考虑投入品自给自足和粮食安全,政策协调的改善和国内生产能力的提升正在推动这一成长。复合肥料因其均衡的营养成分而展现出规模优势,非常适合精密农业计画;而单质尿素则受益于尼日利亚新建工厂带来的成本优势。对数位农业技术、绿色氨和定向补贴计画的投资,扩大了小规模农户的取得管道,并鼓励私人资本流入以改善分销网络。儘管持续的物流挑战和反覆出现的全球价格上涨仍然是不利因素,但对营养主粮生产的持续需求支撑着非洲化肥市场的强劲成长前景。
非洲化肥市场趋势与洞察
非洲粮食安全面临日益增长的压力
预计到2030年,非洲人口将达到14亿,而人均耕地面积却在减少,这导致对化肥的需求持续增加。尼日利亚于2024年4月启动的锌强化米计画就是一个典型的例子,该计画将粮食安全与微量营养素密度而非单纯的热量摄取联繫起来,从而推动了对除传统NPK复合肥料之外的专用肥料配方的需求。这种向营养丰富的作物生产模式的转变需要更高的施肥量和更精细的养分管理。具体而言,在尼日利亚中部地区的玉米种植系统中进行的试验表明,与NPK复合肥相比,分次施用单一肥料可使产量提高22%至46%。由于粮食进口支出加剧了外汇存底的压力,经济发展日益严峻,提高国内生产效率已成为国家安全的首要任务。透过强化施肥来提高农业生产力是实现粮食自给自足的关键途径,能够在价格週期波动中保持需求的持续成长。
补贴改革是阿布加-内罗毕政策背后的驱动力
2024年《内罗毕宣言》为非洲联盟成员国设定了每公顷50公斤的化肥施用目标,创造了超越传统市场动态的政策主导需求。肯亚2025年财政法案看似矛盾地取消了化肥的增值税,同时拨款100亿肯亚先令(约合774亿美元)用于化肥补贴,显示政府致力于在财政压力下确保民众获得化肥。尼日利亚的《国家农业技术与创新政策(2022-2027)》展现了非洲大陆范围内的协调一致,不断将补贴计画针对特定作物和地区,以最大限度地提高粮食安全效益。这项政策势头创造了可预测的需求模式,并使私营部门能够投资于分销网络和本地化肥混合设施。政策实施效果差异显着,加纳和奈及利亚的补贴覆盖率高于面临物流限制的内陆萨赫勒国家。
化肥价格承受能力衝击
2025年7月,全球化肥价格在2025年上半年上涨了15%。其中,磷酸二铵(DAP)价格上涨了23%,过磷酸钙(TSP)价格上涨了43%。这些上涨主要受亚洲强劲需求、中国出口限制以及硫磺原料成本上升的影响。价格飙升影响了小规模农户维持投入品的能力,世界银行的磷酸二铵供应指数在2025年6月达到1.72,超过了2022年初危机期间的高峰。肯亚2025年财政法案进一步加重了农民的购买负担,对先前免税的化肥征收16%的增值税(VAT)。预计这将使每50公斤化肥的价格增加480肯亚先令(约3.71美元),小规模农户的总生产成本可能因此增加15%。各国的价格传导机制差异显着。尼日利亚2024年免除大米进口关税的政策压低了农场收购价,削弱了农民为下一季作物购买化肥的能力。货币贬值加剧了进口成本压力,而信贷市场准入受限则使农民无法在价格週期波动中平滑投入品的购买。补贴计画虽然能提供部分缓解,但时间上的延迟和目标定位不准等问题往往限制了其在价格突然飙升时的有效性。
细分市场分析
复合肥将继续保持主导地位,预计2025年将占据58.02%的市场。这主要得益于复合肥料能够在一次施用中提供均衡的养分,帮助小规模农户降低劳动成本并提高养分同步性。到2031年,复合肥料市场将以8.27%的复合年增长率成长,这反映了作物养分管理技术的日益成熟,尤其是在农业推广服务机构大力推广综合养分管理方法的情况下。尿素的价格优势和客製化施用方案的柔软性使得复合肥依然占据重要地位。同时,微量元素在尼日利亚、加纳和肯亚的生物强化计画中正迅速普及。
非洲复合肥市场的成长主要得益于其一次施用即可提供作物生长所需的多种营养元素,包括主要营养元素、次要营养元素和微量营养元素。农民对均衡作物营养益处以及复合肥环境优势的认识不断提高,推动了这一领域的扩张。复合肥不仅能减少施用量,还能最大限度地减少对环境和土壤的影响。此外,缓释肥和控释肥等先进肥料类型的出现,也进一步促进了复合肥料在该地区的应用,尤其是在高价值作物和现代农业实践中。
预计到2025年,传统肥料将占据90.76%的市场份额,并在2031年之前以7.14%的复合年增长率成长。这种主导地位反映了小规模农户对价格的敏感性,他们更注重价格实惠而非先进配方。人们对高效耕作方式的认识不断提高,以及对高价值作物需求的成长,推动了该领域的强劲成长潜力。在集约化农业系统和园艺作物中,传统肥料的使用率很高,因为精准养分管理在这些领域至关重要。商业农业中现代灌溉系统的应用以及全部区域耕作方式的推广,也为此成长提供了支持。
传统肥料之所以占据市场主导地位,是因为其供应广泛、分销网络完善,且价格低于特种肥料。这些肥料在田间作物施用中占据主导地位,占肥料总消耗量的96%。大规模农业生产和农民使用传统肥料的经验进一步巩固了这一地位。广泛的零售网络和便利的供应,尤其是在农村地区,进一步强化了其市场主导地位。在非洲,成本是肥料选择的主要考虑因素,因此传统肥料的价值提案仍然强劲。
非洲肥料市场报告按类型(复合肥、单质肥)、形态(常规肥、特种肥)、施用方法(灌溉施肥、叶面喷布、土壤施用)、作物类型(田间作物、园艺作物、草坪及观赏植物)和国家(尼日利亚、南非、非洲其他地区)进行细分。市场预测以价值(美元)和数量(公吨)为单位。
其他福利:
- Excel格式的市场预测(ME)表
- 3个月的分析师支持
目录
第一章执行摘要主要发现
第二章 报告
第三章 引言
- 研究假设和市场定义
- 调查范围
- 调查方法
第四章 主要产业趋势
- 主要农作物种植面积
- 田间作物
- 园艺作物
- 平均施肥量
- 微量营养素
- 田间作物
- 园艺作物
- 宏量营养素
- 田间作物
- 园艺作物
- 次发性大量营养元素
- 田间作物
- 园艺作物
- 微量营养素
- 具有灌溉设施的农田
- 法律规范
- 价值炼和通路分析
- 市场驱动因素
- 非洲粮食安全面临越来越大的压力
- 补贴改革是阿布加-内罗毕政策背后的驱动力
- 国内生产能力快速扩张
- 透过数位农业平台促进优化利用
- 投资低碳(绿色)氨
- 微量营养素主导的生物强化需求
- 市场限制
- 化肥价格承受能力衝击
- 物流与零售分销网络薄弱
- 生态学政策面临合成肥料的阻力
- 非洲绿色计划资金高成本
第五章 市场规模及成长预测(数量与价值)
- 类型
- 合成的
- 单一成分
- 微量营养素
- 硼
- 铜
- 铁
- 锰
- 钼
- 锌
- 其他的
- 氮基
- 硝酸铵
- 尿素
- 其他的
- 磷酸盐
- DAP
- MAP
- SSP
- TSP
- 钾
- MoP
- SoP
- 次要大量营养素
- 钙
- 镁
- 硫
- 微量营养素
- 形式
- 传统的
- 特别的
- CRF
- 液体肥料
- SRF
- 水溶性
- 应用方法
- 施肥和灌溉
- 叶面喷布
- 土壤
- 作物类型
- 田间作物
- 园艺作物
- 草坪和观赏植物
- 国家
- 奈及利亚
- 南非
- 其他非洲地区
第六章 竞争情势
- 关键策略倡议
- 市占率分析
- 公司概况
- 公司简介。
- Yara International ASA
- SABIC Agri-Nutrients Co.
- ICL Group Ltd
- K+S Aktiengesellschaft
- Golden Fertilizer Company Limited
- OCP SA
- Dangote Fertiliser Limited
- Indorama Eleme Fertilizer & Chemicals Limited
- Foskor(Pty)Ltd.
- Haifa Chemicals Ltd.
- Omnia Fertilizer(Pty)Ltd.
- CF Industries Holdings, Inc
- Nutrien Ltd.
- UPL Limited
- Olam Agri Holdings Pte Ltd.
第七章:CEO们需要思考的关键策略问题
The Africa fertilizer market was valued at USD 54.77 billion in 2025 and estimated to grow from USD 58.71 billion in 2026 to reach USD 83.05 billion by 2031, at a CAGR of 7.19% during the forecast period (2026-2031).
Steady policy alignment across the continent and domestic capacity expansions support this advance as governments prioritize input self-sufficiency and food security. Complex fertilizers dominate volumes by offering balanced nutrient packages that fit precision programs, while straight urea gains cost tailwinds from new Nigerian plants. Digital agronomy, green ammonia investments, and targeted subsidies are broadening smallholder access and stimulating private capital flows toward distribution upgrades. Persistent logistics gaps and recurring global price spikes remain headwinds, but sustained demand for nutrient-dense staple production underpins a resilient growth outlook for the Africa fertilizer market.
Africa Fertilizers Market Trends and Insights
Rising Food-Security Pressure in Africa
Africa's growing population, projected to reach 1.4 billion by 2030, combined with declining arable land per capita, creates sustained demand for increased fertilizer use. Nigeria's zinc-biofortified rice program, launched in April 2024, exemplifies how governments are linking food security to micronutrient density rather than just caloric sufficiency, driving demand for specialized formulations beyond traditional NPK blends. This shift toward nutrient-dense crop production requires higher fertilizer application rates and more sophisticated nutrient management, particularly in maize systems where split applications of straight fertilizers increased yields 22-46% over NPK blends in Nigeria's Middle-Belt trials. The economic imperative intensifies as food import bills strain foreign exchange reserves, making domestic production efficiency a national security priority. Agricultural productivity gains through fertilizer intensification become the primary pathway to food self-sufficiency, creating sustained demand growth even during price volatility cycles.
Subsidy Reforms & Abuja Nairobi Policy Momentum
The Nairobi Declaration 2024 establishes binding fertilizer application targets of 50 kilograms per hectare across African Union member states, creating policy-driven demand that transcends traditional market dynamics. Kenya's Finance Bill 2025 paradoxically removes VAT exemptions on fertilizers while allocating KES 10 billion (USD 77.4 billion) for fertilizer subsidies, indicating the government's commitment to maintaining input access despite fiscal pressures. Nigeria's National Agricultural Technology and Innovation Policy (2022-2027) demonstrates coordinated continental approaches, with subsidy programs increasingly targeting specific crops and regions to maximize food security outcomes. The policy momentum creates predictable demand patterns that enable private sector investment in distribution networks and local blending facilities. Implementation effectiveness varies significantly, with Ghana and Nigeria achieving higher subsidy delivery rates than landlocked Sahel countries facing logistics constraints.
Fertilizer Price-Affordability Shocks
In July 2025, global fertilizer prices increased by 15% in the first half of 2025. Diammonium phosphate (DAP) prices rose by 23%, while triple superphosphate (TSP) prices increased by 43%. These increases resulted from strong Asian demand, China's export restrictions, and high sulfur input costs. The price surge affected smallholder farmers' ability to maintain input intensity levels, as the World Bank's DAP accessibility index reached 1.72 in June 2025, surpassing the early-2022 crisis peaks. Kenya's Finance Bill 2025 compounds affordability pressures by imposing 16% VAT on previously exempt fertilizers, potentially increasing costs by KES 480 (USD 3.71) per 50-kilogram bag and raising total production costs by 15% for smallholders. The price transmission mechanism varies significantly across countries, with Nigeria's rice import duty waivers in 2024 depressing farm-gate prices and reducing farmers' capacity to invest in fertilizers for subsequent seasons. Currency devaluations amplify import cost pressures, while limited access to credit markets prevents farmers from smoothing input purchases across price cycles. Subsidy programs provide partial relief but often suffer from timing delays and targeting inefficiencies that limit their effectiveness during acute price spikes.
Other drivers and restraints analyzed in the detailed report include:
- Rapid Scale-Up of Domestic Production Capacity
- Digital Agronomy Platforms Driving Optimized Use
- Weak Logistics and Retail Distribution Networks
For complete list of drivers and restraints, kindly check the Table Of Contents.
Segment Analysis
Complex fertilizers dominate with 58.02% market share in 2025, driven by their ability to deliver balanced nutrition in single applications that reduce labor costs and improve nutrient synchronization for smallholder farmers. The 8.27% CAGR growth rate through 2031 reflects increasing sophistication in crop nutrition management, particularly as extension services promote integrated nutrient management practices. Complex fertilizers maintain a significant presence through urea's affordability advantage and flexibility in customized application programs, while micronutrients experience rapid adoption in biofortification programs across Nigeria, Ghana, and Kenya.
In Africa, complex fertilizer market growth is driven by their ability to provide multiple plant nutrients necessary for crop growth in a single application, including primary nutrients, secondary nutrients, and micronutrients. The segment's expansion is supported by increasing awareness among farmers about the benefits of balanced crop nutrition and the environmental advantages of complex fertilizers, which allow for reduced application rates while minimizing both environmental and soil impacts. The emergence of advanced fertilizer types, such as controlled-release and slow-release variants, is further bolstering the adoption of complex fertilizers in the region, particularly in high-value crops and modern farming operations.
Conventional fertilizers hold a 90.76% market share in 2025 and are expected to grow at a 7.14% CAGR through 2031. This dominance reflects the cost sensitivity of smallholder farmers who prioritize affordability over advanced formulations. The segment shows strong growth potential due to increasing awareness of efficient agricultural practices and rising demand for high-value crops. Conventional fertilizers see high adoption rates in intensive farming systems and horticultural crops, where precise nutrient management is essential. The growth is supported by modern irrigation system adoption in commercial farming operations and expanding agricultural practices across the region.
The market leadership of conventional fertilizers stems from their widespread availability, established distribution networks, and lower prices compared to specialty alternatives. These fertilizers dominate field crop applications, accounting for 96% of total fertilizer consumption. Large-scale farming operations and farmers' experience with traditional fertilizer applications strengthen this position. The extensive retail network and accessibility of conventional fertilizers, particularly in rural areas, reinforce their market dominance. In Africa, where cost is a primary factor in fertilizer selection, the conventional segment's value proposition remains strong.
The Africa Fertilizers Market Report is Segmented by Type (Complex, Straight), by Form (Conventional, Specialty), by Application Mode (Fertigation, Foliar, Soil), by Crop Type (Field Crops, Horticultural Crops, Turf & Ornamental), and by Country (Nigeria, South Africa, Rest of Africa). The Market Forecasts are Provided in Terms of Value (USD) and Volume (Metric Tons)
List of Companies Covered in this Report:
- Yara International ASA
- SABIC Agri-Nutrients Co.
- ICL Group Ltd
- K+S Aktiengesellschaft
- Golden Fertilizer Company Limited
- OCP S.A.
- Dangote Fertiliser Limited
- Indorama Eleme Fertilizer & Chemicals Limited
- Foskor (Pty) Ltd.
- Haifa Chemicals Ltd.
- Omnia Fertilizer (Pty) Ltd.
- CF Industries Holdings, Inc
- Nutrien Ltd.
- UPL Limited
- Olam Agri Holdings Pte Ltd.
Additional Benefits:
- The market estimate (ME) sheet in Excel format
- 3 months of analyst support
TABLE OF CONTENTS
1 EXECUTIVE SUMMARY & KEY FINDINGS
2 REPORT OFFERS
3 INTRODUCTION
- 3.1 Study Assumptions & Market Definition
- 3.2 Scope of the Study
- 3.3 Research Methodology
4 KEY INDUSTRY TRENDS
- 4.1 Acreage Of Major Crop Types
- 4.1.1 Field Crops
- 4.1.2 Horticultural Crops
- 4.2 Average Nutrient Application Rates
- 4.2.1 Micronutrients
- 4.2.1.1 Field Crops
- 4.2.1.2 Horticultural Crops
- 4.2.2 Primary Nutrients
- 4.2.2.1 Field Crops
- 4.2.2.2 Horticultural Crops
- 4.2.3 Secondary Macronutrients
- 4.2.3.1 Field Crops
- 4.2.3.2 Horticultural Crops
- 4.2.1 Micronutrients
- 4.3 Agricultural Land Equipped For Irrigation
- 4.4 Regulatory Framework
- 4.5 Value Chain & Distribution Channel Analysis
- 4.6 Market Drivers
- 4.6.1 Rising food-security pressure in Africa
- 4.6.2 Subsidy reforms & Abuja+ Nairobi policy momentum
- 4.6.3 Rapid scale-up of domestic production capacity
- 4.6.4 Digital agronomy platforms driving optimized use
- 4.6.5 Low-carbon (green) ammonia investments
- 4.6.6 Micronutrient-led bio-fortification demand
- 4.7 Market Restraints
- 4.7.1 Fertilizer price affordability shocks
- 4.7.2 Weak logistics & retail distribution networks
- 4.7.3 Agro-ecology policy headwinds on synthetics
- 4.7.4 High cost of capital for African green projects
5 MARKET SIZE AND GROWTH FORECASTS (VALUE AND VOLUME)
- 5.1 Type
- 5.1.1 Complex
- 5.1.2 Straight
- 5.1.2.1 Micronutrients
- 5.1.2.1.1 Boron
- 5.1.2.1.2 Copper
- 5.1.2.1.3 Iron
- 5.1.2.1.4 Manganese
- 5.1.2.1.5 Molybdenum
- 5.1.2.1.6 Zinc
- 5.1.2.1.7 Others
- 5.1.2.2 Nitrogenous
- 5.1.2.2.1 Ammonium Nitrate
- 5.1.2.2.2 Urea
- 5.1.2.2.3 Others
- 5.1.2.3 Phosphatic
- 5.1.2.3.1 DAP
- 5.1.2.3.2 MAP
- 5.1.2.3.3 SSP
- 5.1.2.3.4 TSP
- 5.1.2.4 Potassic
- 5.1.2.4.1 MoP
- 5.1.2.4.2 SoP
- 5.1.2.5 Secondary Macronutrients
- 5.1.2.5.1 Calcium
- 5.1.2.5.2 Magnesium
- 5.1.2.5.3 Sulfur
- 5.1.2.1 Micronutrients
- 5.2 Form
- 5.2.1 Conventional
- 5.2.2 Speciality
- 5.2.2.1 CRF
- 5.2.2.2 Liquid Fertilizer
- 5.2.2.3 SRF
- 5.2.2.4 Water Soluble
- 5.3 Application Mode
- 5.3.1 Fertigation
- 5.3.2 Foliar
- 5.3.3 Soil
- 5.4 Crop Type
- 5.4.1 Field Crops
- 5.4.2 Horticultural Crops
- 5.4.3 Turf & Ornamental
- 5.5 Country
- 5.5.1 Nigeria
- 5.5.2 South Africa
- 5.5.3 Rest of Africa
6 COMPETITIVE LANDSCAPE
- 6.1 Key Strategic Moves
- 6.2 Market Share Analysis
- 6.3 Company Landscape
- 6.4 Company Profiles (includes Global Level Overview, Market Level Overview, Core Business Segments, Financials, Key Information, Market Rank, Market Share, Products and Services, and Analysis of Recent Developments).
- 6.4.1 Yara International ASA
- 6.4.2 SABIC Agri-Nutrients Co.
- 6.4.3 ICL Group Ltd
- 6.4.4 K+S Aktiengesellschaft
- 6.4.5 Golden Fertilizer Company Limited
- 6.4.6 OCP S.A.
- 6.4.7 Dangote Fertiliser Limited
- 6.4.8 Indorama Eleme Fertilizer & Chemicals Limited
- 6.4.9 Foskor (Pty) Ltd.
- 6.4.10 Haifa Chemicals Ltd.
- 6.4.11 Omnia Fertilizer (Pty) Ltd.
- 6.4.12 CF Industries Holdings, Inc
- 6.4.13 Nutrien Ltd.
- 6.4.14 UPL Limited
- 6.4.15 Olam Agri Holdings Pte Ltd.
7 KEY STRATEGIC QUESTIONS FOR FEED ADDITIVE CEOS
 缓释肥料市场:2026-2032年全球市场预测(以包膜类型、作物类型、释放週期、养分类型、施用方法、最终用途和销售管道)
 2026年全球生物炭肥料市场报告几丁质肥料市场:2026-2032年全球市场预测(按应用、类型、原料、配方和分销管道划分)肥料包膜市场:2026-2032年全球市场预测(以包膜化学、释放机制、包膜养分类型、外形规格、製造流程、最终用途及通路划分)化肥市场:2026-2032年全球市场预测(依产品类型、作物类型、包装、施用方法、最终用户和分销管道划分)复合肥料市场:按产品类型、作物类型、物理形态和应用分類的全球市场预测,2026-2032年
 海藻土壤改良剂市场预测至 2034 年—按产品类型、海藻种类、形态、应用、养殖方法、通路和地区进行全球分析。藻类肥料市场:2026-2032年全球市场预测(依原料、产品类型、通路及应用划分)
 全球缓释肥料市场规模、份额、趋势和成长分析报告(2026-2034)全球肥料造粒助剂市场规模、份额、趋势和成长分析报告(2026-2034年)