


 |
市场调查报告书
商品编码
1940874
泰国资料中心市场占有率分析、产业趋势与统计、成长预测(2026-2031)Thailand Data Center - Market Share Analysis, Industry Trends & Statistics, Growth Forecasts (2026 - 2031) |
||||||
※ 本网页内容可能与最新版本有所差异。详细情况请与我们联繫。
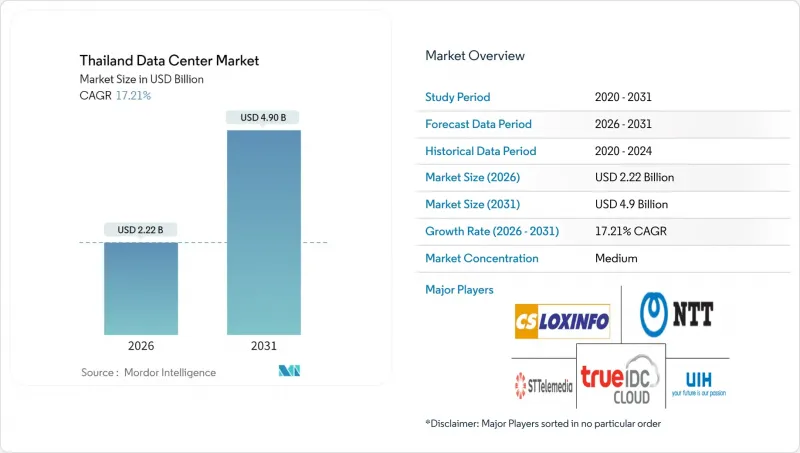
预计到 2025 年,泰国资料中心市场价值将达到 18.9 亿美元,从 2026 年的 22.2 亿美元成长到 2031 年的 49 亿美元。
预测期(2026-2031 年)的复合年增长率预计为 17.21%。
预计在预测期(2025-2030年)内,市场规模将以30.60%的复合年增长率成长,从2025年的770兆瓦成长到2030年的2930兆瓦。市场占有率和估计值均以兆瓦(MW)为单位计算和报告。超大规模资料中心业者营运商的资本注入、泰国4.0政策下的激励措施以及积极的海底电缆建设正在推动市场扩张,而电网现代化和逐步实施的可再生能源采购规则则增强了营运商的信心。企业云端迁移正在加速人工智慧的普及应用,而东部经济走廊(EEC)边缘运算的建造进一步强化了市场需求。全球平台公司的进入加剧了竞争,并推动了机架密度、液冷和营运商中立互连等方面的设施升级。
泰国资料中心市场趋势与洞察
泰国企业正日益推行云端优先的数位转型。
随着政府主导的数位化政策不断推进,企业被要求在国内託管受监管的工作负载。泰国投资促进委员会 (BOI) 已对价值超过 7.5 亿泰铢(约 2,170 万美元)的本地运算能力扩展计划给予长达 13 年的所得税豁免,有效降低了总体拥有成本 (TCO)。美的等製造商正在东部经济走廊 (EEC) 地区运营支援 5G 的智慧工厂,并依靠附近的边缘节点进行即时品管。固定宽频领域的整合(尤其是 AIS 和 3BB 的合併)正在提高存取速度并加速企业云端的采用。因此,即使价格更高,拥有高密度接入点的营运商中立站点也能赢得长期合约。
积极投资海底电缆,以加强国际互联互通
新的跨亚洲系统将往返新加坡、香港和东京的延迟降低至10毫秒以内,使内容、金融科技和SaaS公司能够将区域工作负载集中到曼谷。超大规模资料中心业者将频宽作为开放自主云端区域的先决条件,从而引发对批发託管设施的连锁需求,这需要三路径光纤和暗纤的多样性。吞吐量的提升也使泰国通讯业者能够从国内枢纽服务邻近的湄公河市场,从而释放批发收入来源。
曼谷土地短缺和房地产成本上涨
曼谷商业区和中央商务区黄金地段的地价飙升至历史新高,给拥有扩张预算的多租户营运商带来了巨大压力。随着超大规模资料中心业者利用其雄厚的财力领先整个工业园区,託管业者被迫进行垂直维修,并将部分容量迁移到郊区。这导致选址计划前置作业时间至数月,并促使营运商采用高机架密度策略来提高每平方公尺收益。
细分市场分析
中型资料中心在泰国资料中心市场占据相当大的份额,年复合成长率达17.95%,这主要得益于企业和营运商优先考虑靠近用户的低延迟区域。大型资料中心园区具有规模经济优势,预计到2025年将占泰国资料中心市场份额的26.35%,但城市地区的土地资源限制了其进一步扩张。
营运商正在区域工业园区内复製标准化的 6-12MW 设计,并结合 Advanced Info Service 的 5G 边缘运算部署,将专用网路核心部署在製造群附近。这种模式降低了工厂自动化的传输延迟,并推动了曼谷以外地区多元化的需求。
截至2025年,Tier 3规格的资料中心将占据泰国资料中心市场85.62%的份额,运转率高达99.982%,且价格比Tier 4更实惠,能够满足企业需求。由于需要升级以适应高密度人工智慧机架,预计2026年至2031年间,Tier 3设施的建设将以18.88%的复合年增长率成长。
託管服务提供者透过增加模组化电源和热插拔冷却的冗余性来控制资本支出,而不是完全升级到 Tier 4。 STT GDC 的 Frost & Sullivan 奖旨在表彰 Tier 3 设施中针对液冷需求进行优化的卓越营运。
泰国资料中心市场报告按资料中心规模(大型、超大型、中型、巨型、小规模)、层级(Tier 1-2、Tier 3、Tier 4)、资料中心类型(超大规模/自建、企业/边缘、託管)、最终用户(银行、金融服务和保险 (BFSI)、IT 和 ITES、电子商务、政府、电信製造业、媒体和娱乐、娱乐、金融服务和热点等。市场预测以 IT 负载容量(兆瓦,MW)为单位。
其他福利:
- Excel格式的市场预测(ME)表
- 3个月的分析师支持
目录
第一章 引言
- 研究假设和市场定义
- 调查范围
第二章调查方法
第三章执行摘要
第四章 市场情势
- 市场概览
- 市场驱动因素
- 泰国企业正日益拥抱云端优先的数位转型
- 透过积极投资海底电缆来加强国际互联互通
- 泰国4.0计画下的政府奖励措施促进资料本地化
- 人工智慧和密集运算工作负载的激增需要超大规模容量
- 东部经济走廊工业4.0边缘配置
- 盈利的绿色能源电价推动永续资料中心建设
- 市场限制
- 曼谷土地短缺和房价上涨
- 主要都会区以外地区长期存在的电网稳定问题
- 冗长的许可和环境核准流程
- 日益激烈的竞争缩小了託管价格的利润空间。
- 市场展望
- IT负载能力
- 高架地板面积
- 託管收入
- 预装机架
- 机架空间利用率
- 海底电缆
- 主要行业趋势
- 智慧型手机用户数量
- 每部智慧型手机的数据流量
- 行动资料通讯速度
- 宽频资料通讯速度
- 光纤连接网路
- 法律规范
- 价值炼和通路分析
- 波特五力分析
- 新进入者的威胁
- 买方的议价能力
- 供应商的议价能力
- 替代品的威胁
- 竞争对手之间的竞争
第五章 市场规模及成长预测(兆瓦)
- 按资料中心规模
- 大规模
- 巨大的
- 中号
- 百万
- 小规模
- 依层级类型
- 一级和二级
- 三级
- 第四级
- 依资料中心类型
- 超大规模/内部建设
- 企业/边缘运算
- 搭配
- 未使用的
- 使用
- 零售共址
- 批发託管
- 最终用户
- BFSI
- 资讯科技与资讯科技服务
- 电子商务
- 政府
- 製造业
- 媒体与娱乐
- 沟通
- 其他最终用户
- 透过热点
- 曼谷
- 泰国其他地区
第六章 竞争情势
- 市场集中度
- 策略趋势
- 市占率分析
- 公司简介
- Huawei Cloud Computing Technologies Co., Ltd.
- True Internet Data Center Co., Ltd.
- China Mobile Limited(SUPERNAP Thailand)
- Advanced Info Service PLC(CS LoxInfo)
- STT GDC Pte Ltd.
- Alibaba Cloud
- OneAsia Network Ltd.
- Internet Thailand Public Company Ltd.
- National Telecom Public Company Ltd.
- Telehouse International Corporation of Europe Ltd.
- United Information Highway Co., Ltd.
- TCC Technology Co., Ltd.
- Bridge Data Centres(Chindata Group)
- KT Corporation with Jasmine Group
- Etix Everywhere
- NTT Global Data Centers(Thailand)Ltd.
- Equinix Inc.
- Digital Realty Trust Inc.
- EdgeConneX Inc.
- Global Switch Holdings Ltd.
第七章 市场机会与未来展望
The Thailand Data Center Market was valued at USD 1.89 billion in 2025 and estimated to grow from USD 2.22 billion in 2026 to reach USD 4.9 billion by 2031, at a CAGR of 17.21% during the forecast period (2026-2031).
In terms of market size, the market is expected to grow from 0.77 thousand megawatt in 2025 to 2.93 thousand megawatt by 2030, at a CAGR of 30.60% during the forecast period (2025-2030). The market segment shares and estimates are calculated and reported in terms of MW. Hyperscaler capital commitments, Thailand 4.0 policy incentives, and aggressive submarine-cable builds underpin the expansion, while grid modernization and progressive renewable-energy purchase rules sustain operator confidence. Enterprise cloud migration accelerated AI adoption, and edge buildouts in the Eastern Economic Corridor (EEC) further strengthen demand. Competition intensifies as global platforms enter, spurring facility upgrades in rack density, liquid cooling, and carrier-neutral interconnection.
Thailand Data Center Market Trends and Insights
Rising Cloud-First Digital Transformation Mandates Among Thai Enterprises
Continuous state-backed digital policies now oblige corporations to host regulated workloads in-country. The Board of Investment grants up to 13-year income-tax holidays on projects above THB 750 million (USD 21.7 million) that add local compute, lowering the effective total cost of ownership. Manufacturers such as Midea run 5G-enabled smart factories in the EEC that depend on proximate edge nodes for real-time quality control. Mergers in fixed broadband, notably AIS-3BB, lift access speeds and hasten enterprise cloud adoption. Carrier-neutral sites with dense on-ramps therefore secure long-term contracts despite premium pricing.
Aggressive Submarine-Cable Investments Enhancing International Connectivity
New trans-Asian systems shorten round-trip latency to Singapore, Hong Kong, and Tokyo below 10 milliseconds, enabling content, fintech, and SaaS firms to anchor regional workloads inside Bangkok. Hyperscalers cite bandwidth gains as the precondition for launching sovereign cloud regions, which cascade demand into wholesale colocation halls requiring triple-path fiber and dark-fiber diversity. Better throughput also lets Thai operators serve neighbouring Mekong markets from domestic hubs, opening wholesale revenue streams.
Land Scarcity and Soaring Bangkok Real-Estate Costs
Prime plots inside Bangkok's carrier hotels and CBD corridors command record premiums that squeeze multi-tenant operators on expansion budgets. Hyperscalers leverage deeper balance sheets to pre-empt entire industrial parks, leaving colocators to retrofit vertical extensions or migrate capacity to outer provinces. Resultant site hunts add months to project lead-times and compel higher rack-density strategies to lift revenue per square meter.
Other drivers and restraints analyzed in the detailed report include:
- Government Incentives Under Thailand 4.0 Driving Data Localization
- Surge in AI and High-Density Computing Workloads Requiring Hyperscale Capacity
- Chronic Grid Stability Issues Outside Primary Metro Areas
For complete list of drivers and restraints, kindly check the Table Of Contents.
Segment Analysis
Medium facilities accounted for a notable slice of the Thailand data center market size, growing at 17.95% CAGR as enterprises and telecom carriers prioritize low-latency zones closer to users. Large campuses hold economies of scale and captured 26.35% of Thailand data center market share in 2025, but their downtown land constraints limit additional expansion.
Operators replicate standardized 6-12 MW blueprints in provincial industrial estates, aligning with 5G edge computing rollouts by Advanced Info Service that anchor private network cores near manufacturing clusters. The pattern lowers transport latency for factory automation and drives diverse demand beyond Bangkok.
Tier 3 specifications represented 85.62% of Thailand data center market share in 2025, demonstrating enterprise comfort with 99.982% uptime at more practical price points than Tier 4. Upgrades to support high-density AI racks fuel a 18.88% CAGR for Tier 3 builds over 2026-2031.
Colocation providers enhance redundancy via modular power trains and hot-swap chillers rather than shifting to full Tier 4, preserving capex discipline. STT GDC's Frost and Sullivan award spotlights operational excellence inside Tier 3 footprints optimized for liquid immersion cooling demand.
The Thailand Data Center Market Report is Segmented by Data Center Size (Large, Massive, Medium, Mega, and Small), Tier Type (Tier 1 and 2, Tier 3, and Tier 4), Data Center Type (Hyperscale/Self-built, Enterprise/Edge, and Colocation), End User (BFSI, IT and ITES, E-Commerce, Government, Manufacturing, Media and Entertainment, Telecom, and More), and Hotspot. The Market Forecasts are Provided in Terms of IT Load Capacity (MW).
List of Companies Covered in this Report:
- Huawei Cloud Computing Technologies Co., Ltd.
- True Internet Data Center Co., Ltd.
- China Mobile Limited (SUPERNAP Thailand)
- Advanced Info Service PLC (CS LoxInfo)
- STT GDC Pte Ltd.
- Alibaba Cloud
- OneAsia Network Ltd.
- Internet Thailand Public Company Ltd.
- National Telecom Public Company Ltd.
- Telehouse International Corporation of Europe Ltd.
- United Information Highway Co., Ltd.
- TCC Technology Co., Ltd.
- Bridge Data Centres (Chindata Group)
- KT Corporation with Jasmine Group
- Etix Everywhere
- NTT Global Data Centers (Thailand) Ltd.
- Equinix Inc.
- Digital Realty Trust Inc.
- EdgeConneX Inc.
- Global Switch Holdings Ltd.
Additional Benefits:
- The market estimate (ME) sheet in Excel format
- 3 months of analyst support
TABLE OF CONTENTS
1 INTRODUCTION
- 1.1 Study Assumptions and Market Definition
- 1.2 Scope of the Study
2 RESEARCH METHODOLOGY
3 EXECUTIVE SUMMARY
4 MARKET LANDSCAPE
- 4.1 Market Overview
- 4.2 Market Drivers
- 4.2.1 Rising cloud-first digital transformation mandates among Thai enterprises
- 4.2.2 Aggressive submarine cable investments enhancing international connectivity
- 4.2.3 Government incentives under Thailand 4.0 driving data localization
- 4.2.4 Surge in AI and high-density computing workloads requiring hyperscale capacity
- 4.2.5 Edge deployments for Industry 4.0 corridors in Eastern Economic Corridor
- 4.2.6 Lucrative green-energy tariffs encouraging sustainable data center builds
- 4.3 Market Restraints
- 4.3.1 Land scarcity and soaring Bangkok real-estate costs
- 4.3.2 Chronic grid stability issues outside primary metro areas
- 4.3.3 Lengthy permitting and environmental approval cycles
- 4.3.4 Intensifying competition compressing colocation pricing margins
- 4.4 Market Outlook
- 4.4.1 IT Load Capacity
- 4.4.2 Raised Floor Space
- 4.4.3 Colocation Revenue
- 4.4.4 Installed Racks
- 4.4.5 Rack Space Utilization
- 4.4.6 Submarine Cable
- 4.5 Key Industry Trends
- 4.5.1 Smartphone Users
- 4.5.2 Data Traffic Per Smartphone
- 4.5.3 Mobile Data Speed
- 4.5.4 Broadband Data Speed
- 4.5.5 Fiber Connectivity Network
- 4.5.6 Regulatory Framework
- 4.6 Value Chain and Distribution Channel Analysis
- 4.7 Porter's Five Forces Analysis
- 4.7.1 Threat of New Entrants
- 4.7.2 Bargaining Power of Buyers
- 4.7.3 Bargaining Power of Suppliers
- 4.7.4 Threat of Substitutes
- 4.7.5 Intensity of Competitive Rivalry
5 MARKET SIZE AND GROWTH FORECASTS (MEGAWATT)
- 5.1 By Data Center Size
- 5.1.1 Large
- 5.1.2 Massive
- 5.1.3 Medium
- 5.1.4 Mega
- 5.1.5 Small
- 5.2 By Tier Type
- 5.2.1 Tier 1 and 2
- 5.2.2 Tier 3
- 5.2.3 Tier 4
- 5.3 By Data Center Type
- 5.3.1 Hyperscale/Self-built
- 5.3.2 Enterprise/Edge
- 5.3.3 Colocation
- 5.3.3.1 Non-Utilized
- 5.3.3.2 Utilized
- 5.3.3.2.1 Retail Colocation
- 5.3.3.2.2 Wholesale Colocation
- 5.4 By End User
- 5.4.1 BFSI
- 5.4.2 IT and ITES
- 5.4.3 E-Commerce
- 5.4.4 Government
- 5.4.5 Manufacturing
- 5.4.6 Media and Entertainment
- 5.4.7 Telecom
- 5.4.8 Other End Users
- 5.5 By Hotspot
- 5.5.1 Bangkok
- 5.5.2 Rest of Thailand
6 COMPETITIVE LANDSCAPE
- 6.1 Market Concentration
- 6.2 Strategic Moves
- 6.3 Market Share Analysis
- 6.4 Company Profiles (includes Global level Overview, Market level overview, Core Segments, Financials as available, Strategic Information, Market Rank/Share for key companies, Products and Services, and Recent Developments)
- 6.4.1 Huawei Cloud Computing Technologies Co., Ltd.
- 6.4.2 True Internet Data Center Co., Ltd.
- 6.4.3 China Mobile Limited (SUPERNAP Thailand)
- 6.4.4 Advanced Info Service PLC (CS LoxInfo)
- 6.4.5 STT GDC Pte Ltd.
- 6.4.6 Alibaba Cloud
- 6.4.7 OneAsia Network Ltd.
- 6.4.8 Internet Thailand Public Company Ltd.
- 6.4.9 National Telecom Public Company Ltd.
- 6.4.10 Telehouse International Corporation of Europe Ltd.
- 6.4.11 United Information Highway Co., Ltd.
- 6.4.12 TCC Technology Co., Ltd.
- 6.4.13 Bridge Data Centres (Chindata Group)
- 6.4.14 KT Corporation with Jasmine Group
- 6.4.15 Etix Everywhere
- 6.4.16 NTT Global Data Centers (Thailand) Ltd.
- 6.4.17 Equinix Inc.
- 6.4.18 Digital Realty Trust Inc.
- 6.4.19 EdgeConneX Inc.
- 6.4.20 Global Switch Holdings Ltd.
7 MARKET OPPORTUNITIES AND FUTURE OUTLOOK
- 7.1 White-Space and Unmet-Need Assessment
 2026年全球智慧客户资料中心市场报告2026年全球网路资料中心(IDC)市场报告2026年全球资料中心房地产市场报告
 资料中心市场:按组件、资料中心类型、层级、冷却方式、电源、最终用户和组织规模划分-2026年至2032年全球市场预测
 全球在轨资料中心市场预测(至2034年)-按平台、组件、系统、连接类型、应用、最终用户和地区分類的分析
 资料中心汇流排市场规模、份额和成长分析:按导体材料、绝缘类型、额定功率、安装/整合方法、资料中心类型和地区划分-2026-2033年产业预测2026年全球客製化资料中心市场报告
 资料中心能源概况 - Oracle:自 2019 年以来,能源使用量以 24% 的复合年增长率成长,由于可再生能源的使用,排放保持稳定,但 Stargate 专案可能会大幅增加碳足迹。
 氢动力资料中心市场分析及预测(至2035年):类型、产品类型、服务、技术、组件、应用、部署模式、最终用户、功能、安装模式资料中心市场分析及预测(至2035年):类型、产品类型、服务、技术、组件、应用、部署模式、最终用户、解决方案