


 |
市场调查报告书
商品编码
1892159
全球肿瘤影像人工智慧市场(2025-2032):规模、组成及成长趋势Global Oncology Imaging AI Market Pulse 2025-2032 Size, Mix and Momentum |
||||||
全球肿瘤影像人工智慧市场预计将从2023年的6.047亿美元成长到2032年的77.4亿美元(复合年增长率32.7%)。这使得肿瘤领域成为医学影像人工智慧领域成长最快的类别之一,也是企业买家未来人工智慧预算分配方向的重要指标。
概述
"全球肿瘤影像人工智慧市场(2025-2032):规模、组成及成长趋势" 是由Marketstrat提供的关于癌症影像诊断人工智慧的全球市场规模和预测报告。 我们涵盖了按地区、影像方式(CT、乳房X光摄影/DBT、MRI、PET/核子医学、超音波)、临床应用领域、肿瘤位置、治疗路径阶段、最终用户环境和收入模式划分的需求趋势。
本报告非常适合那些希望获得清晰、量化的全球视角,而无需阅读数百页的大型展望报告的人士。它能够快速解答以下问题,并提供决策层面的答案:
- 目前全球AI癌症影像市场的规模有多大?到2032年,其规模将成长多少?
- 支出将集中在哪些领域( "大市场" )?
- 预计未来哪些领域将带来收入成长( "快速成长领域" 和 "成长贡献者" )?
- 获利模式将如何演变(软体、服务或云端/按使用量付费)?
市场规模并非取决于扫描器的数量,而是取决于设备的数量。预计市场将以32.7%的复合年增长率成长,从2023年的6.47亿美元成长到2032年的77.4亿美元,主要成长动力来自设备安装率的提高和工作流程的实施。
主要市场趋势(正在发生的变化)
1. 从 "单一功能人工智慧" 到全流程应用
肿瘤影像人工智慧正从单一任务的电脑辅助诊断(CAD)转向全流程工作流程,包括筛检、检测、分期、治疗计划(包括放射治疗)、治疗反应评估和追踪。标准化测量是该领域临床和经济方面的必要条件。
2.筛检项目支持可预测的 AI 工作负载
乳癌筛检(乳房X光摄影/数位乳房断层合成)和低剂量CT肺癌筛检的规模不断扩大和产业化,对 AI 的需求也随之增长,以支持分流、品质保证 (QA)、二次会诊和大规模项目运营。
3. 测量级量化成为价值核心
在MRI(前列腺/肝臟)、CT(肺部病变)和PET/核医学(治疗性诊断)领域,成长的重点在于量化、分析和结构化报告工具,这些工具能够提高癌症影像诊断的可重复性和运作可扩展性。
4. MRI 与 PET/核医高端市场(高 ARPU 领域)的扩张
MRI 是成长最快的主要影像模式,而 PET/核医正逐渐成为一个高价值的细分市场,这得益于治疗性影像(包括诊疗一体化)的扩展,从而推动了对定量和剂量学导向型人工智慧的需求。
5. 获利模式转向软体 + 使用量 + 生命週期服务
虽然软体仍然是核心收入驱动因素,但云端/基于使用量的付费模式(PPU)将在高容量工作流程(筛检点、远端放射学和企业多站点网路)中加速发展。随着验证、监控和治理需求的成长,服务也将随之扩展。
竞争格局概述(商业现实,而非市场占有率)
本报告聚焦于市场格局的划分方式,而非各供应商的市占率。 本报告重点介绍各细分市场的赢家以及影响定价权的商业基本面:
- 高容量模式和筛选通道中 OEM 捆绑销售和 "预设附加" 的经济效益
- 整合医疗网络 (IDN) 和癌症网络中的企业合约和治理要求
- 市场/平台分销降低了多供应商环境下的采用门槛
- 远距放射学和集中式阅片中心推动了基于使用量的定价和标准化品质保证 (QA)
以下公司/产业被提及(但未进行详细介绍):Aidoc、AIQ Solutions、Annalise.ai、Arterys、Bayer、Blackford、Calantic、Canon Medical、CARPL.ai、DeepHealth、Deepwise、Densitas、EXINI Diagnostics、Fujifilm、GE Lantheus、Lunit、Median Technologies、MIM Software、迈瑞医疗、Mirada Medical、MVision AI、Nuance、Oxipit、Perspectum、飞利浦、平安医疗、Quibim、Qure.ai、Rad AI、RadNet、RaySearch、Riverin、ScreenPoint、Sectra、Segami、西门子医疗、Subtle Medical、Riverin、ScreenPoint、Sectra、Segami、西门子医疗、Subtle Medical.
范例洞察与图表(可引用内容)
本报告提供读者以下问题的即时答案:
- 与全球平均值相比,哪些地区在特定治疗方式和治疗路径阶段的代表性过高或过低?
- 依治疗方式、肿瘤部位、治疗路径阶段及收入来源划分,哪些地区带来的增量收入最大?
- 哪些肿瘤部位和影像方式的组合带来了最大的增量收入(例如,乳癌 X 光/DR、肺癌 CT、摄护腺 MRI)?
- 云端/随选付费模式在哪些方面比传统授权协议更具结构性优势?
本报告包含 41 个图表和 36 个表格,可用于规划文件、投资概览和市场推广策略优先排序。
目录
- 摘要整理,重点介绍全球市场规模、成长与最重要的市场变化。
- 研究方法概述(范围定义、细分指南和预测架构)。
- 全球市场分析(2023-2032)依下列区域划分:
- 按区域和特定国家划分的分析。
- 治疗模式构成及成长贡献。
- 临床应用组成及成长趋势。
- 肿瘤部位组成及成长贡献。
- 收入来源(硬体、软体、服务)。 (云端/PPU)
- 最终使用者组织(IDN/AMC、癌症中心、社区健康组织、远距放射学)
- 依治疗路径阶段划分的趋势(筛检→治疗计画/放射治疗→治疗反应评估/追踪)
- 构成和动量矩阵及交叉表(例如,地区 x 模式、肿瘤位置 x 模式、治疗路径阶段 x 收入来源)
本报告的意义
"全球肿瘤人工智慧成像市场趋势(2025-2032)" 报告旨在为需要准确市场规模预测和可操作的市场细分的团队提供帮助。以下是实际决策所需的各种因素的组合:
- 产品组合与路线图决策:哪些模式和肿瘤部位值得持续投资?
- 市场进入与部署顺序:从哪里入手(大型市场),又该选择性地投资于哪些市场(成长型市场)?
- 商业策略:收入模式将如何演变(授权、服务或使用量)?哪些市场的价格会下降,哪些市场的价格会保持稳定?
- 投资人与尽职调查流程:哪些成长故事是基于全球市场组成/动能模式而非轶事?
目录
第 0 部分 - 如何掌握全球市场脉动
第 1 部分 - 全球市场概览(2023-2032 年)
第 2 部分 - 摘要整理
第 3 部分 - 研究方法
第 4 部分 - 全球肿瘤影像人工智慧市场
- 全球市场概览
- 肿瘤影像人工智慧:从利基应用到企业平台
- 为何应用加速成长
- 区域成长概览(2023-2032 年)
- 对供应商的策略启示
- 市场动能与展望
- 肿瘤影像人工智慧:从利基应用到企业平台
- 全球市场预测区域(2023-2032 年)
- 按国家/地区和最终用户组织划分的全球市场
- 按国家/地区和应用划分的预估(2023 年,百万美元)
- 按国家/地区和应用划分的预测(2032 年)
- 亮点(2032 年国家/地区格局与全球组成)
- 到 2023 年将发生哪些变化(方向)
- 成长最快的领域(百万美元成长,2023-2032 年)
- 意义(商业策略)
- 值得关注的讯号
- 以治疗方式划分的全球市场
- 亮点
- 全球市场(依治疗方式)(2023-2032 年)
- 影响
- 市场数学与扩散模式
- 2032 年组成与关键成长点镜头
- 市占率变化及美元走势(2023-2032 年)
- 竞争格局 - 依成像方式划分
- 影像方式细分(肿瘤领域)
- CT
- X光/DR(包括乳房X光摄影)
- MRI
- PET/核子医学
- 超音波
- 供应商策略要点(肿瘤领域)
- 值得关注的讯号(2025-2027 年)
- 全球市场依临床应用划分
- 亮点
- 全球市场依临床应用划分(2023-2032 年)
- 有哪些变化?
- 按应用领域划分的关键成长点
- 推动成长的人员(2023 年至 2032 年成长情形)
- 意义
- 依临床应用划分的竞争格局
- 依临床应用深度分析
- 检测与诊断
- 量化与分析
- 工作流程与协调
- 报告与沟通
- 影像重建与撷取
- 供应商策略要点
- 值得关注的讯号(2025-2027 年)
- 依肿瘤部位划分的全球市场
- 亮点
- 变化趋势(组合动态)
- 依肿瘤部位划分的全球市场(2023-2032 年)
- 依肿瘤部位划分的成长视角
- 意义分析
- 到 2032 年会发生哪些变化
- 商业启示
- 依肿瘤部位划分的竞争格局
- 依肿瘤部位划分的详细分析
- 乳癌
- 肺癌/胸腔癌
- 摄护腺癌
- 大肠直肠癌
- 肝癌
- 神经肿瘤
- 妇科肿瘤
- 头颈癌
- 其他(稀有)
- 策略启示
- 值得关注的讯号(2025-2027)
- 全球市场依收入来源划分
- 亮点
- 正在发生什么变化?
- 全球市场依收入来源划分(2023-2032)
- 成长视角 - 按收入来源划分
- 成长贡献(2023-2032 年美元走势)
- 意义
- 依收入来源划分的详细分析
- 硬体
- 软体
- 服务
- 云端/PPU
- 竞争格局 - 依收入来源划分
- 值得关注的讯号(2025-2027)
- 全球市场依最终用途纸巾类型划分
- 亮点
- 正在发生什么变化?
- 以最终用途组织类型划分的全球市场(2023-2032 年)
- 按应用划分的成长视角
- 成长贡献(2023-2032 年美元强度)
- 意义解读
- 深度分析
- 学术机构/整合交付网路 (IDN)
- 综合癌症中心
- 社区医院与诊断影像中心
- 远端放射诊断服务供应商
- 以最终用途划分的竞争格局
- 值得关注的讯号(2025-2027 年)
- 按人工智慧技术划分的全球市场
- 亮点
- 正在发生哪些变化?
- 全球人工智慧技术市场概况(2023-2032 年)
- 成长视角 - 人工智慧技术
- 谁在推动成长(美元走强,2023-2032 年)
- 这意味着什么?
- 人工智慧技术深度分析(肿瘤学视角)
- 人工智慧技术竞争格局
- 值得关注的讯号(2025-2027 年)
- 全球市场依治疗阶段划分
- 亮点
- 正在发生哪些变化?
- 依路径阶段划分的全球市场(2023-2032 年)
- 成长视角 - 依路径阶段划分
- 谁会推动成长(美元强弱 2023-2032 年)
- 这意味着什么
- 竞争格局 - 依路径阶段划分
- 重要讯号(2025-2027 年)
- 如何解读 "组合与动量" 矩阵
- 地域组合与动量 - 全球肿瘤影像人工智慧
- 高阶主管要点
- 按地区和模式划分的行销
- 按地区和模式划分的全球市场(2020-2023 年)
- 按地区和模式划分的全球市场(至 2032 年)
- 正在发生哪些变化? (混合型,2032 年超额/不足指数)
- 谁在推动成长? (2023 年至 2032 年的成长)
- 这意味着什么?
- 按地区和收入来源划分的市场
- 全球市场按地区和收入来源划分,截至 2023 年
- 全球市场按地区和收入来源划分,截至 2032 年
- 正在发生哪些变化? (混合型,2032 年超额/不足指数)
- 谁在推动成长?
- 这意味着什么?
- 按地区和临床应用划分的市场
- 2023年至2025年全球市场按地区和临床应用划分
- 2032年至2035年全球市场按地区和临床应用划分
- 市场变化趋势(2032年超额/不足指数)
- 谁在推动成长?
- 意义
- 竞争格局概览(示意图)
- 疾病驱动型需求地图 - 全球肿瘤影像人工智慧
- 高阶主管要点
- 肿瘤位置 x 影像方式
- 2023 年至 2035 年全球肿瘤位置 x 影像方式市场
- 2032 年全球肿瘤部位与影像方式市场
- 变化趋势(2032 年组成及全球市场)
- 谁将推动成长(2023 年至 2032 年美元升值)
- 这意味着什么?
- 肿瘤部位与临床应用
- 依肿瘤部位和临床应用划分的全球市场,2023-2032 年
- 变动趋势(2032 年组成及全球)
- 按肿瘤部位和临床应用划分的全球市场,2032-2032 年
- 谁将推动成长(2023 年至 2032 年美元走强)
- 这意味着什么
- 肿瘤部位 x 收入来源
- 依肿瘤部位和收入来源划分的全球市场,2023-2032 年
- 依肿瘤部位和收入来源划分的全球市场,2032-2032 年
- 变化趋势(2032 年与全球比例比较)
- 谁将推动成长(2023 年至 2032 年美元走强)
- 这意味着什么意义
- 竞争格局概览(肿瘤领域)
- 值得关注的讯号
- 工作流程经济学 - 全球肿瘤影像人工智慧
- 影像模式 x 收入来源
- 2023 年全球市场:依收入来源划分的影像模式
- 依收入来源划分的全球市场(依影像模式)
- 亮点
- 变动趋势(组合及超额/不足指数)
- 谁将推动成长(2023 年至 2032 年美元走势)
- 意义(商业策略)
- 竞争视角(案例)
- 按收入来源划分的临床应用
- 亮点(2032 年趋势)
- 2023-2032 年按收入来源划分的全球市场(按临床应用)年份
- 按临床应用和收入来源划分的全球市场(2023-2032 年)
- 变化趋势(2023-2032 年)
- 成长驱动因素(2023 年至 2032 年美元成长)
- 意义解读(按应用划分的商业策略)
- 竞争格局分析(仅供参考,并非详尽无遗)
- 获得核准的定价模式(买家青睐的定价)
- 值得关注的讯号
- 风险与注意事项
- 影像模式 x 收入来源
- 路径阶段经济学 - 全球肿瘤影像人工智慧
- 路径阶段 x 收入来源
- 亮点
- 以路径阶段 x 收入来源划分的全球市场(截至 2023 年)
- 以路径阶段 x 收入来源划分的全球市场(截至 2023 年) 2032 年)
- 变动之处(组合与全球)
- 谁在推动成长(2023-2032 年美元走强)
- 意义何在(商业策略)
- 竞争视角(参考)
- 值得关注的讯号
- 路径阶段 x 模式 - 各阶段的趋势及其原因
- 路径阶段 x 全球市场(依模式划分,截至 2023 年)
- 路径阶段 x 全球市场(依模式划分,截至 2032 年)
- 亮点(2032 年模式与全球组合比较)
- 美元趋势(2023-2032 年)
- 各阶段的解读(2032 年各阶段股票)
- 影响(商业考量)
- 竞争视角(范例,非实际资料)综合)
- 值得关注的讯号
- 路径阶段 x 临床应用:工作量如何影响支出
- 按路径阶段和临床应用划分的全球市场(截至 2023 年)
- 按路径阶段和临床应用划分的全球市场(截至 2032 年)
- 亮点(2032 年模式与全球组成比较)
- 美元趋势(2023-2032 年)
- 意义(商业策略)
- 竞争视角(参考)
- 值得关注的讯号
- 路径阶段 x 最终用途:谁在购买什么以及成长集中在哪些地区
- 全球情势(2032 年最终用途组成)
- 按路径阶段和最终用途划分的全球市场(2020-2023 年)
- 2032 年全球市场:依路径阶段与最终用途
- 亮点(2032 年模式与全球组成)
- 成长贡献者(2023 年至 2032 年美元成长)
- 这意味着什么(阶段性商业策略)
- 竞争视角(仅供参考,并非详尽无遗)
- 值得关注的讯号
- 路径阶段 x 人工智慧技术如何改变癌症治疗路径的能力组合
- 全球科技构成
- 路径阶段 x 人工智慧技术全球市场年度 - 2023 年
- 路径阶段 x 人工智慧技术全球市场年度 - 2032 年
- 亮点(2032 年模式与全球组成)
- 美元趋势(2023-2032 年)
- 这意味着什么(商业策略)
- 竞争视角(指南)
- 值得关注的讯号观看
- 路径阶段 x 收入来源
The global Oncology Imaging AI market is forecast to grow from US$604.7M in 2023 to US$7.74B by 2032 (32.7% CAGR)-making oncology one of the fastest-scaling categories inside medical imaging AI and a leading indicator for where enterprise buyers will place their next AI budgets.
Overview
Global Oncology Imaging AI Market Pulse 2025-2032: Size, Mix & Momentum is Marketstrat's world-market sizing and forecasting report for AI in cancer imaging-covering how demand is shifting across regions, modalities (CT, mammography/DBT, MRI, PET/Nuclear, ultrasound), clinical applications, tumor sites, care pathway stages, end-use settings, and revenue models.
This Pulse is built for teams who want a clean, quantitative global view-without needing to navigate a full multi-hundred-page Horizon program. It delivers a fast, decision-grade answer to:
- How big is the global oncology imaging AI market today-and where will it be by 2032?
- Where is the mix of spend concentrated (the "big pools")?
- Where will incremental dollars accrue (the "fast pools" and "growth contribution" lanes)?
- How do monetization models shift (software vs services vs cloud/usage-based)?
Market expands from US$604.7M (2023) to US$7.74B (2032) at a 32.7% CAGR, driven primarily by attach-rate expansion and workflow adoption, not scanner unit growth.
Key Market Trends (what's changing)
1. From "point AI" to pathway adoption
Oncology imaging AI is shifting from single-task CAD toward pathway-wide workflows-screening, detection, staging, treatment planning (including RT), response assessment, and surveillance-where standardized measurement becomes a clinical and economic requirement.
2. Screening programs anchor predictable AI volumes
Breast screening (mammography/DBT) and LDCT lung screening continue to expand and industrialize, increasing demand for AI that supports triage, QA, second reads, and program operations at scale.
3. Measurement-grade quantification becomes the value center
Across MRI (prostate/liver), CT (lung pathways), and PET/Nuclear (theranostics), growth increasingly concentrates in quantification, analytics, and structured reporting-tools that make cancer imaging more reproducible and operationally scalable.
4. Premium pools rise in MRI and PET/Nuclear (high ARPU lanes)
MRI is the fastest-growing major modality, and PET/Nuclear grows as a high-value niche as therapy-linked imaging (including theranostics) expands demand for quantification and dosimetry-oriented AI.
5. Monetization shifts toward software + usage + lifecycle services
Software remains the core revenue engine, while cloud/usage-based (PPU) models accelerate in high-volume workflows (screening hubs, teleradiology, and enterprise multi-site networks). Services expand alongside validation, monitoring, and governance requirements.
Competitive Snapshot (commercial reality, not market shares)
This Global Pulse focuses on how the market is captured-not vendor-by-vendor market shares. The report highlights the commercial rails that shape winners and pricing power across segments:
- OEM bundling and "default attach" economics in high-volume modalities and screening lanes
- Enterprise contracting and governance requirements in IDNs and cancer networks
- Marketplace/platform distribution that reduces deployment friction for multi-vendor portfolios
- Teleradiology and centralized reading hubs as catalysts for usage-based pricing and standardized QA
The following companies/divisions have been mentioned (not profiled): Aidoc; AIQ Solutions; Annalise.ai; Arterys; Bayer; Blackford; Calantic; Canon Medical; CARPL.ai; DeepHealth; Deepwise; Densitas; EXINI Diagnostics; Fujifilm; GE HealthCare; Hermes Medical Solutions; Hologic; Imbio; Incepto; Kheiron; Koios Medical; Lantheus; Lunit; Median Technologies; MIM Software; Mindray; Mirada Medical; MVision AI; Nuance; Oxipit; Perspectum; Philips; Ping An Healthcare; Quibim; Qure.ai; Rad AI; RadNet; RaySearch; Riverain; ScreenPoint; Sectra; Segami; Siemens Healthineers; Subtle Medical; Tempus; TheraPanacea; United Imaging; Vara; Varian
Sample Insights & Figures (what you'll be able to cite)
Inside this report, readers gain immediate answers to questions such as:
- Which regions are over- or under-indexed in specific modalities or pathway stages versus the global mix?
- Where is the largest dollar lift coming from-by modality, tumor site, pathway stage, and revenue stream?
- Which tumor-site x modality combinations create the most incremental dollars (e.g., breast x X-ray/DR, lung x CT, prostate x MRI)?
- Where are cloud/PPU models structurally advantaged versus traditional licensing?
This Pulse includes 41 figures and 36 tables, structured to be reusable in planning decks, investment briefs, and GTM prioritization.
What's Inside
- Executive Summary focused on global size, growth, and the few mix shifts that matter most
- Condensed Research Methodology (scope definition, segmentation compass, and forecast architecture)
- World Market Analysis (2023-2032) across:
- Region and selected country views
- Modality mix and growth contribution
- Clinical application mix and momentum
- Tumor-site mix and growth contribution
- Revenue streams (hardware, software, services, cloud/PPU)
- End-use organizations (IDNs/AMCs, cancer centers, community providers, teleradiology)
- Pathway stage dynamics (screening -> treatment planning/RT -> response/surveillance)
- Mix & Momentum matrices and cross-tabs (e.g., region x modality, tumor site x modality, pathway stage x revenue stream)
Why This Report
Global Oncology Imaging AI Market Pulse 2025-2032 is built for teams that need high-confidence sizing plus practical segmentation-the combination required to make real decisions:
- Portfolio and roadmap decisions: Which modalities and tumor sites are worth sustained investment?
- Market entry and sequencing: Where do you start (big pools) vs where do you place selective bets (fast pools)?
- Commercial strategy: How will revenue models evolve (license vs service vs usage), and where will pricing compress vs hold?
- Investor and diligence workflows: Which growth narratives are supported by global mix/momentum patterns rather than anecdote?
TABLE OF CONTENTS
SECTION 0 - HOW TO USE THIS GLOBAL MARKET PULSE
SECTION 1 - GOBAL MARKET SNAPSHOT (2023-2032)
SECTION 2 - EXECUTIVE SUMMARY
SECTION 3 - RESEARCH METHODOLOGY
SECTION 4 - WORLD MARKET FOR ONCOLOGY IMAGING AI
- 4.1 WORLD MARKET OVERVIEW
- Oncology Imaging AI: From Niche App to Enterprise Platform
- Why Adoption is Accelerating
- Regional Growth Snapshot (2023 -> 2032)
- Strategic Implications for Vendors
- Market Momentum & Outlook
- Oncology Imaging AI: From Niche App to Enterprise Platform
- 4.2 WORLD MARKET FORECAST BY REGION (2023-2032)
- 4.3 WORLD MARKET BY COUNTRY x END-USE ORG
- Estimate by Country x End-Use (USD Mill, 2023)
- Forecast by Country x End-Use (2032)
- Highlights (2032 Country Pattern vs World Mix)
- What's Shifting vs 2023 (Directional)
- Top Growth Cells (US$ M Lift, 2023->2032)
- What This Means (Commercial Playbook)
- Signals to Watch
- 4.4 WORLD MARKET BY MODALITY
- Highlights
- World Market by Modality (2023-32)
- Implications
- Market Math & Diffusion Pattern
- 2032 Mix and Key Growth Lenses
- Share Shift and Dollar Lift (2023 -> 2032)
- Competitive Landscape - by Modality
- Modality Deep-Dives (Oncology-specific)
- CT
- X-ray/DR (incl. Mammography)
- MRI
- PET/Nuclear
- Ultrasound
- Strategic Takeaways for Vendors (Oncology-specific)
- Signals to Watch (2025-2027)
- 4.5 WORLD MARKET BY CLINICAL APPLICATION
- Highlights
- World Market by Clinical Application (2023-32)
- What's Shifting
- Key Growth Lenses by Application
- Who Contributes the Growth (2023->2032 lift)
- What This Means
- Competitive Landscape - by Clinical Application
- Deep Dives by Clinical Application
- Detection & Diagnosis
- Quantification & Analytics
- Workflow & Orchestration
- Reporting & Communication
- Image Reconstruction & Acquisition
- Strategic Takeaways for Vendors
- Signals to Watch (2025-2027)
- 4.6 WORLD MARKET BY TUMOR SITE
- Highlights
- What's Shifting (Mix Dynamics)
- World Market by Tumor Site (2023-32)
- Growth Lenses - by Tumor Site
- What This Means
- What Shifts Through 2032
- Commercial Takeaways
- Competitive Landscape - by Tumor Site
- Deep Dives by Tumor Site
- Breast
- Lung/Chest
- Prostate
- Colorectal
- Liver
- Neuro-Oncology
- Gynecologic
- Head & Neck
- Other (Rare)
- Strategic Takeaways
- Signals to Watch (2025-2027)
- 4.7 WORLD MARKET BY REVENUE STREAM
- Highlights
- What's Shifting
- World Market by Revenue Stream (2023-32)
- Growth Lenses - by Revenue Stream
- Who Contributes the Growth (2023->2032 Dollar Lift)
- What This Means
- Deep Dives by Revenue Stream
- Hardware
- Software
- Service
- Cloud/PPU
- Competitive Landscape - by Revenue Stream
- Signals to Watch (2025-2027)
- 4.8 WORLD MARKET BY END-USE ORGANIZATION TYPE
- Highlights
- What's Shifting
- World Market by End-Use Organization (2023-32)
- Growth Lenses by End-use
- Who Contributes the Growth (2023->2032 Dollar Lift)
- What this Means
- Deep Dives
- Academic/IDNs
- Comprehensive Cancer Centers
- Community Hospitals & Imaging Centers
- Teleradiology Providers
- Competitive Landscape - by End-Use
- Signals to Watch (2025-2027)
- 4.9 WORLD MARKET BY AI TECHNOLOGY
- Highlights
- What's Shifting
- World Market by AI Technology (2023-32)
- Growth Lenses - by AI Technology
- Who Contributes the Growth (2023->2032 Dollar Lift)
- What This Means
- Deep Dives by AI Technology (Oncology Lens)
- Competitive Landscape - by AI Technology
- Signals to Watch (2025-2027)
- 4.10 WORLD MARKET BY PATHWAY STAGE
- Highlights
- What's Shifting
- World Market by Pathway Stage (2023-32)
- Growth Lenses - by Pathway Stage
- Who Contributes the Growth (2023->2032 Dollar Lift)
- What This Means
- Competitive Landscape - by Pathway Stage
- Signals to Watch (2025-2027)
- HOW TO INTERPRET "MIX & MOMENTUM" MATRICES
- 4.11 REGIONAL MIX & MOMENTUM - WORLD ONCOLOGY IMAGING AI
- Executive Takeaways
- Marke by Region x Modality
- World Market by Region x Modality - 2023
- World Market by Region x Modality - 2032
- What's Shifting (Mix, 2032 Over/Under-index)
- Who Contributes the Growth (2023->2032 Lift)
- What This Means
- Market by Region x Revenue Stream
- World Market by Region x Revenue Stream - 2023
- World Market by Region x Revenue Stream - 2032
- What's Shifting (Mix, 2032 Over/Under Index)
- Who Contributes the Growth
- What This Means
- Market by Region x Clinical Application
- World Market by Region x Clinical Application - 2023
- World Market by Region x Clinical Application - 2032
- What's Shifting (Mix, 2032 Over/Under Index)
- Who Contributes the Growth
- What this Means
- Competitive Snapshots (Illustrative)
- 4.12 DISEASE-DRIVEN DEMAND MAP - WORLD ONCOLOGY IMAGING AI
- Executive Takeaways
- Tumor Site x Modality
- World Market by Tumor Site x Modality - 2023
- World Market by Tumor Site x Modality - 2032
- What's Shifting (2032 Mix vs Global)
- Who Contributes the Growth (2023->2032 Dollar Lift)
- What This Means
- Tumor Site x Clinical Application
- World Market by Tumor Site x Clinical Application - 2023
- What's Shifting (2032 Mix vs Global)
- World Market by Tumor Site x Clinical Application - 2032
- Who Contributes the Growth (2023->2032 Dollar Lift)
- What this means
- Tumor Site x Revenue Stream
- World Market by Tumor Site x Revenue Stream - 2023
- World Market by Tumor Site x Revenue Stream - 2032
- What's Shifting (2032 mix vs global)
- Who Contributes the Growth (2023->2032 Dollar lift)
- What This Means
- Competitive Snapshot (Illustrative, Oncology-focused)
- Signals to Watch
- 4.13 WORKFLOW ECONOMICS - WORLD ONCOLOGY IMAGING AI
- Modality x Revenue Stream
- World Market by Modality x Revenue Stream - 2023
- World Market by Modality x Revenue Stream - 20232
- Highlights
- What's Shifting (Mix & Over/Under-Index)
- Who Contributes the Growth (2023->2032 Dollar Lift)
- What This Means (Commercial Playbook)
- Competitive Lens (Illustrative)
- Clinical Application x Revenue Stream
- Highlights (2032 Pattern)
- World Market by Clinical Application x Revenue Stream - 2023
- World Market by Clinical Application x Revenue Stream - 2032
- What's Shifting (2023 -> 2032)
- Who Contributes the Growth (US$ M lift, 2023->2032)
- What This Means (Commercial Playbook by Application)
- Competitive Lens (Indicative, Non-exhaustive)
- Pricing Archetypes That Clear Approvals (What Buyers Say "Yes" to)
- Signals to Watch
- Risks & Watchouts
- Modality x Revenue Stream
- 4.14 PATHWAY STAGE ECONOMICS - WORLD ONCOLOGY IMAGING AI
- Pathway Stage x Revenue Stream
- Highlights
- World Market by Pathway Stage x Revenue Stream - 2023
- World Market by Pathway Stage x Revenue Stream - 2032
- What's Shifting (Mix vs Global)
- Who Contributes the Growth (2023 -> 2032 Dollar Lift)
- What This Means (Commercial Playbook)
- Competitive Lens (Indicative)
- Signals to Watch
- Pathway Stage x Modality - Where Each Stage Leans and Why
- World Market by Pathway Stage x Modality - 2023
- World Market by Pathway Stage x Modality - 2032
- Highlights (2032 Pattern vs World Mix)
- Where the Dollars Moved (2023 -> 2032)
- Stage-specific Readouts (2032 Shares Inside Each Stage)
- What This Means (Commercial Takeaways)
- Competitive Lens (Illustrative, not Exhaustive)
- Signals to Watch
- Pathway Stage x Clinical Application - How Workloads Drive Spend
- World Market by Pathway Stage x Clinical Application - 2023
- World Market by Pathway Stage x Clinical Application - 2032
- Highlights (2032 Pattern vs World Mix)
- Where the Dollars Moved (2023 -> 2032)
- What This Means (Commercial Playbook)
- Competitive Lens (Indicative)
- Signals to Watch
- Pathway Stage x End-use - Who Buys What, and Where Growth Concentrates
- World Context (2032 End-use Mix)
- World Market by Pathway Stage x End-use - 2023
- World Market by Pathway Stage x End-use - 2032
- Highlights (2032 Pattern vs Global Mix)
- Who Contributes the Growth (US$ M lift 2023->2032)
- What This Means (Commercial Playbook by Stage)
- Competitive Lens (Indicative, Non-exhaustive)
- Signals to Watch
- Pathway Stage x AI Technology - How Capability Mix Shifts Across the Cancer Pathway
- World Tech Mix
- World Market for Pathway Stage x AI Technology - 2023
- World Market for Pathway Stage x AI Technology - 2032
- Highlights (2032 Pattern vs Global Mix)
- Where the Dollars Moved (2023 -> 2032)
- What This Means (Commercial Playbook)
- Competitive Lens (indicative)
- Signals to Watch
- Pathway Stage x Revenue Stream
List of Tables
- Table 1: World Market for AI in Oncology Imaging by Region (2023-2032, USD Million)
- Table 2: World Market for Oncology Imaging AI by Country x End-Use Org (2023)
- Table 3: World Market for Oncology Imaging AI by Country x End-Use Org (2032)
- Table 4: World Market for Oncology Imaging AI by Modality (USD Mill, 2023-32)
- Table 5: World Market for Oncology Imaging AI by Clinical Application (USD Mill, 2023-32)
- Table 6: World Market for Oncology Imaging AI by Tumor Site (USD Mill, 2023-32)
- Table 7: World Market for Oncology Imaging AI by Revenue Stream (USD Mill, 2023-32)
- Table 8: World Market for Oncology Imaging AI by End-Use Org (USD Mill, 2023-32)
- Table 9: World Market for Oncology Imaging AI by Technology (USD Mill, 2023-32)
- Table 10: World Market for Oncology Imaging AI by Pathway Stage (USD Mill, 2023-32)
- Table 11: World Market for Oncology Imaging AI by Region x Modality (USD Mill, 2023)
- Table 12: World Market for Oncology Imaging AI by Region x Modality (USD Mill, 2032)
- Table 13: World Market for Oncology Imaging AI by Region x Revenue Stream (USD Mill, 2023)
- Table 14: World Market for Oncology Imaging AI by Region x Revenue Stream (USD Mill, 2032)
- Table 15: World Market for Oncology Imaging AI by Region x Clinical Application (USD Mill, 2023)
- Table 16: World Market for Oncology Imaging AI by Region x Clinical Application (USD Mill, 2032)
- Table 17: World Market for Oncology Imaging AI by Tumor Site x Modality (USD Mill, 2023)
- Table 18: World Market for Oncology Imaging AI by Tumor Site x Modality (USD Mill, 2032)
- Table 19: World Market for Oncology Imaging AI by Tumor Site x Clinical Application (USD Mill, 2023)
- Table 20: World Market for Oncology Imaging AI by Tumor Site x Clinical Application (USD Mill, 2032)
- Table 21: World Market for Oncology Imaging AI by Tumor Site x Revenue Stream (USD Mill, 2023)
- Table 22: World Market for Oncology Imaging AI by Tumor Site x Revenue Stream (USD Mill, 2032)
- Table 23: World Market for Oncology Imaging AI by Modality x Revenue Stream (2023)
- Table 24: World Market for Oncology Imaging AI by Modality X Revenue Stream (2032)
- Table 25: World Market for Oncology Imaging AI by Clinical Application x Revenue Stream (2023)
- Table 26: World Market for Oncology Imaging AI by Clinical Application x Revenue Stream (2032)
- Table 27: World Market for Oncology Imaging AI - By Pathway Stage X Revenue Stream (USD Mill, 2023)
- Table 28: World Market for Oncology Imaging AI - By Pathway Stage X Revenue Stream (USD Mill, 2032)
- Table 29: World Market for Oncology Imaging AI - By Pathway Stage X Modality (USD Mill, 2023)
- Table 30: World Market for Oncology Imaging AI - By Pathway Stage X Modality (USD Mill, 2032)
- Table 31: World Market for Oncology Imaging AI by Pathway Stage x Clinical Application (USD Mill, 2023)
- Table 32: World Market for Oncology Imaging AI by Pathway Stage x Clinical Application (USD Mill, 2032)
- Table 33: World Market for Oncology Imaging AI by Pathway Stage x End-use Org (USD Mill, 2023)
- Table 34: World Market for Oncology Imaging AI by Pathway Stage x End-use Org (USD Mill, 2032)
- Table 35: World Market for Oncology Imaging AI by Pathway Stage x AI Technology (USD Mill, 2023)
- Table 36: World Market for Oncology Imaging AI by Pathway Stage x AI Technology (USD Mill, 2032)
List of Figures
- Figure 1: Global Oncology Imaging AI - Country x End-Use Org (2032 Market Size and Index vs. Global Mix)
- Figure 2: Global Oncology Imaging AI - Country x End-Use (Dollar Lift 2023 to 2032)
- Figure 3: Global Oncology Imaging AI Market by Modality: 2023 vs. 2
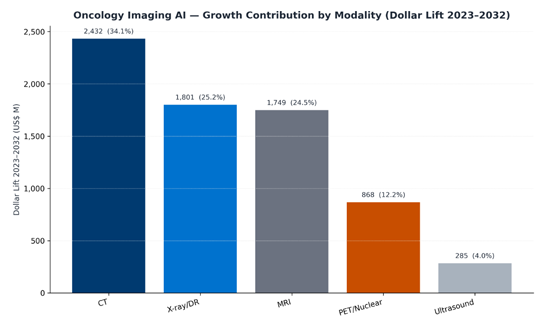
- Figure 4: Global Oncology Imaging AI Growth Contribution by Modality: Dollar Lift 2023 to 2
- Figure 5: Global Oncology Imaging AI Market by Clinical Application: 2023 vs. 2
- Figure 6: Global Oncology Imaging AI Growth Contribution by Clinical Application: Dollar Lift 2023 to 2
- Figure 7: Global Oncology Imaging AI Growth Contribution by Tumor Site: Dollar Lift 2023 to 2
- Figure 8: Global Oncology Imaging AI Growth Contribution by Tumor Site: Dollar Lift 2023 to 2
- Figure 9: Global Oncology Imaging Growth Contribution by Revenue Stream: Dollar Lift 2023 to 2
- Figure 10: Global Oncology Imaging Market by End-Use Org: 2023 vs. 2
- Figure 11: Global Oncology Imaging Growth Contribution by End-Use Org: Dollar Lift 2023 to 2
- Figure 12: Global Oncology Imaging Market by AI Technology: 2023 vs. 2
- Figure 13: World Market for Oncology Imaging AI by Technology (USD Mill, 2023-32)
- Figure 14: Global Oncology Imaging Market by Pathway Stage: 2023 vs. 2
- Figure 15: Global Oncology Imaging AI Growth Contribution by Pathway Stage: Dollar Lift 2023 to 2
- Figure 16: Global Oncology Imaging AI - Region x Modality (2032 Market Size and Index vs. Global Mix)
- Figure 17: Global Oncology Imaging AI - Region x Modality (Dollar Lift 2023 vs 2032)
- Figure 18: Global Oncology Imaging AI - Region x Revenue Stream (2032 Market Size and Index vs. Global Mix)
- Figure 19: Global Oncology Imaging AI - Region x Revenue Stream (Dollar Lift 2023 to 2032)
- Figure 20: World Market for Oncology Imaging AI by Region x Clinical Application (USD Mill, 2032)
- Figure 21: Global Oncology Imaging AI - Region x Clinical Application (Dollar Lift 2023 to 2032)
- Figure 22: Global Oncology Imaging AI - Tumor Site x Modality (2032 Market Size and Index vs. Global Mix)
- Figure 23: Global Oncology Imaging AI - Tumor Site x Modality (Dollar Lift 2023 to 2032)
- Figure 24: Global Oncology Imaging AI - Tumor Site x Clinical Application (2032 Market Size and Index vs. Global Mix)
- Figure 25: Global Oncology Imaging AI - Tumor Site x Clinical Application (Dollar Lift 2023 to 2032)
- Figure 26: Global Oncology Imaging AI - Tumor Site x Revenue Stream (2032 Market Size and Index vs. Global Mix)
- Figure 27: Global Oncology Imaging AI - Tumor Site x Revenue Stream (Dollar Lift 2023 to 2032)
- Figure 28: Global Oncology Imaging AI - Modality x Revenue Stream (2032 Market Size and Index vs. Global Mix)
- Figure 29: Global Oncology Imaging AI - Modality x Revenue Stream (Dollar Lift 2023 to 2032)
- Figure 30: Global Oncology Imaging AI - Clinical Application x Revenue Stream (2032 Market Size and Index vs. Global Mix)
- Figure 31: Global Oncology Imaging AI - Clinical Application x Revenue Stream (Dollar Lift 2023 to 2032)
- Figure 32: Global Oncology Imaging AI - Pathway Stage x Revenue Stream (2032 Market Size and Index vs. Global Mix)
- Figure 33: Global Oncology Imaging AI - Pathway Stage x Revenue Stream (Dollar Lift 2023 to 2032)
- Figure 34: Global Oncology Imaging AI - Pathway Stage x Modality (2032 Market Size and Index vs. Global Mix)
- Figure 35: Global Oncology Imaging AI - Pathway Stage x Modality (2032 Market Size and Index vs. Global Mix)
- Figure 36: Global Oncology Imaging AI - Pathway Stage x Clinical Application (2032 Market Size and Index vs. Global Mix)
- Figure 37: Global Oncology Imaging AI - Pathway Stage x Clinical Application (Dollar Lift 2023 to 2032)
- Figure 38: World Market for Oncology Imaging AI by Pathway Stage x End-use Org (2032 Market Size and Index vs. Global Mix)
- Figure 39: Global Oncology Imaging AI - Pathway Stage x End-Use (Dollar Lift 2023 to 2032)
- Figure 40: World Market for Oncology Imaging AI by Pathway Stage x AI Technology (2032 Over/Under Mix)
- Figure 41: World Market for Oncology Imaging AI by Pathway Stage x AI Technology (USD Mill, 2032)
 人工智慧(AI)在磁振造影(MRI)领域的市场-策略分析与预测(2026-2031)
 AI for MRI 市场 - 全球产业规模、份额、趋势、机会及预测(按临床应用、产品类型、技术、部署类型、最终用途、地区和竞争格局划分,2021-2031 年)
 2026-2032年全球慢性脑血管疾病人工智慧医学影像软体市场预测(按模式、部署类型、组件、应用和最终用户划分)人工智慧医学影像软体市场-肺炎诊断(按模式、部署类型、应用程式和最终用户划分)-2026-2032年全球预测人工智慧医疗图像软体市场(心电图方向):按产品类型、部署格式、成像方式、应用领域和最终用户划分 - 全球预测(2026-2032年)人工智慧赋能的X射线诊断成像市场(按产品类型、解决方案类型、成像方式、人工智慧功能、应用、最终用户和部署模式划分),全球预测(2026-2032年)人工智慧(AI)心血管疾病医学影像软体市场:按技术、影像方式、部署类型、应用和最终用户划分-2026年至2032年全球预测基于CT影像的肺炎分流和评估软体市场:按组件、部署类型、定价模式、应用和最终用户划分 - 全球预测(2026-2032年)急性脑血管疾病的AI医疗图像软体市场:按组件、模式、部署模式、应用和最终用户划分,全球预测(2026-2032年)脑血管疾病人工智慧医学影像软体市场:按组件、模式、部署类型、演算法、应用和最终用户划分 - 全球预测(2026-2032 年)