


 |
市场调查报告书
商品编码
2008697
全球超音波市场:市场结构、预测与人工智慧货币化架构(2024-2035 年)Global Ultrasound Horizon: Market Structure, Forecasts, and AI Monetization Architecture (2024A-2035E) |
||||||
报告摘要
Marketstrat发布的这份报告对全球超音波市场及其周边生态系统进行了详尽的市场分析,目标受众包括企业高管、策略和业务拓展团队、服务/售后市场领导者、医疗服务提供者、投资者以及与超音波成像相关的AI/工作流程供应商。报告整合了超音波硬体、装置量经济效益、服务/售后市场收入、核心AI带来的持续收入、广泛的AI桥接应用、市场结构展望、竞争格局和战略框架,并将其呈现为一个连贯的决策模型。
与将人工智慧仅视为附加章节的超音波报告不同,本报告将人工智慧定位为核心商业化层,涵盖影像撷取指导、报告生成、量化分析、云端协作、企业管治以及持续的商业化。其目的不仅在于说明市场,更在于阐释价值的创造点、价值的变现方式、竞争格局的重塑,以及未来十年最重要的商业性趋势。
市场概览
超音波市场正经历「用户基数」的加速扩张,而非单纯的附加价值成长。预计全球系统销售额将从2024年的96亿美元成长到2035年的164亿美元,年出货量预计将从204,183台成长到480,331台,装置量将从115万台成长到190万台。这表明,超音波设备的普及程度和应用范围正在扩大,而不仅仅是销售额的成长。
更重要的结构性变化远不止于硬体领域。整个生态系统的收入从 125 亿美元增长到 215 亿美元,服务和核心人工智慧的持续收入从 29 亿美元增长到 52 亿美元,而更广泛的人工智慧桥接收入则从 5.936 亿美元增长到 43 亿美元。换句话说,未来的价值创造正从硬体应用服务提供者 (ASP) 转向工作流程、彙报、管治、云端审查以及软体驱动的营运槓桿。
重点
- 全球超音波生态系统预计将从 2024 年的 125 亿美元成长到 2035 年的 215 亿美元,市场从硬体扩展到服务、工作流程和人工智慧驱动的货币化。
- 超音波市场正处于结构性的「两级化」转型期。虽然高阶和中阶推车式设备仍然是其价值主张的核心,但紧凑型/可携式和手持式/床边超音波设备正在扩大其目标用户群体,并渗透到各种应用环境中。
- 人工智慧层不仅仅是一份功能清单;它代表着一种货币化架构的变革。更广泛的人工智慧相关市场已从5.936亿美元成长到43亿美元,其价值正转向软体、云端/按需付费、服务、工作流程和管治。
- Marketstrat 透过丛集的系统结构分析超音波市场的竞争结构,并应用整个 Markintel-TM 框架堆迭将市场规模估算转化为可操作的打入市场策略、产品包装和伙伴关係优先事项。
主要市场趋势(结构性变化)
- 小型/可携式将成为硬体市场的主要成长引擎。预计其在系统销售额中的份额将从2024年的29.6%上升到2035年的37.2%,成为最大的单一硬体细分市场。
- 手持式/床边超音波设备是提高超音波检查普及率的主要驱动力。虽然其销量仍低于推车式设备,但出货量份额已从19.2%增长至38.9%,显示超音波的使用地点和使用者发生了显着变化。
- 市场正日益转向软体主导模式。本报告的核心观点是,价值正在向上游转移,体现在影像撷取指导、结构化报告、品质保证 (QA)、管治、云端审查和企业工作流程等。
- 各区域的成长和获利模式各不相同。北美仍然是最大的收入来源,而欧洲市场拥有庞大的装置量和稳定的经常性收入。亚太地区是主要区域中成长最快的,并且具有最大的长期规模扩张潜力。同时,拉丁美洲和中东及非洲虽然规模较小,但在可移植性、价值层级定位和服务网路部署方面具有重要的战略意义。
- 如今,中国需要一套独特的战略。本报告不仅将中国视为区域性子市场,更将其视为一个独特的竞争体系,该体係由采购、国内替代、本土人工智慧、价值层级规模以及出口意愿等因素共同塑造而成。
目录
第一章:执行摘要
第二章:调查方法
第三章:策略架构与市场分析
- 全球超音波市场概览(CoreData建模)
- 全球超音波市场:非模型分析(市场结构视角)
- 策略框架架构:超音波地平线计划
- M3 市场动量矩阵(全球超音波市场)
- M-TEM(技术成熟度评分)
- 超音波人工智慧收入(按业务领域划分)(桥视图)
- T-DIC(技术扩散与影响曲线)
- 解决方案实施与成长矩阵
- 超音波人工智慧的应用案例:商业化架构
- GTM 增长成熟度矩阵:超音波生态系统
- 生态系协作:超音波生态系统
- 伙伴关係决策树
- ARC 指数(核准情况、报销/投资报酬率、临床检验)
- 超音波升级和套餐阶梯
- 超音波人工智慧收入桥
第四章:竞争格局与公司概况
- 跨领域竞争假说
- 竞争格局图:超音波生态系统(丛集和丛集)
- 超音波诊断设备市场竞争格局图:丛集和丛集
- 竞争讯号评分卡
- 竞争讯号评分卡:最具影响力的主要企业
- 全球系统OEM市场份额
- 超音波系统的区域市场份额
- 第一丛集:系统OEM厂商/平台现有公司
- 丛集概览(竞争机制)
- 公司简介
- GE HealthCare
- Philips
- Siemens Healthineers
- Samsung Medison
- Mindray
- Canon Medical Systems
- FUJIFILM / FUJIFILM Sonosite
- SonoScape
- Esaote
- United Imaging Healthcare
- 日立(原超音波诊断设备特许经营商)
- 第二丛集:可携式/小型/床边超音波硬件
- 丛集概览(竞争机制)
- 公司简介
- EchoNous
- Exo
- FUJIFILM Sonosite
- GE HealthCare (Venue / Vscan family)
- Mindray (TE / M / Z families; TE Air adjacency)
- Philips (Lumify / compact CV / shared-service systems)
- Samsung Medison
- Canon Medical
- Esaote
- Chison
- Fiyano
- TodoPocus
- Rivanna Medical
- Vave Health
- ASUS LU800
- 第三丛集:携带式/家用超音波设备
- 丛集概览(竞争机制)
- 公司简介
- Butterfly Network
- Clarius Mobile Health
- Exo
- Pulsenmore
- GE HealthCare (Vscan Air)
- Mindray (TE Air)
- Healcerion
- ASUS LU800
- Vave Health
- TodoPocus
- 第四丛集:人工智慧采集/解读/工作流程/决策支持
- 丛集概览(竞争机制)
- AI/工作流程竞赛的舞台:超音波
- 公司简介
- BrightHeart
- Caption Health / GE HealthCare
- UltraSight
- Ultrasound AI
- AS Software
- Intelligent Ultrasound / Surgical Science
- Us2.ai
- DiA Imaging Analysis / Philips
- Koios Medical
- MyCardium AI
- Sonio / Samsung Medison
- Ultromics
- Diagnoly
- AISAP
- Biotics AI
- DeepHealth / See-Mode
- MediReport
- HeartFocus / DESKi
- ThinkSono
- PIUR Imaging
- NerveBlox
- Qure.ai
- ESI
- DolphinSonic
- HeartLab
- 第五丛集:最尖端科技/穿戴式装置/混合装置/治疗/干预
- 丛集概览(竞争机制)
- 前缘超音波丛集图
- 公司简介
- Sonus Microsystems
- HistoSonics
- iSono Health
- MAUI Imaging
- Oxailis
- Resolve Stroke
- Softsonics
- Evident Vascular
- Flosonics Medical
- Seno Medical
- Ventripoint Diagnostics
- Sonic Incytes
- EndoSound
- DeepSight Technology
- Laza Medical
- Merge Labs
- Petal Surgical
- EXACT Therapeutics
- SonALAsense
- SecondWave Systems
- SuperSonic Imagine
- Carthera
- OxSonics Therapeutics
- Openwater
- Sanmai Technologies
- Brainsonix
- Gestalta
- MicroPort Lifesciences
- 第六丛集:半导体/感测器/基础设施/赋能技术
- 丛集概览(竞争机制)
- 启用堆迭图:超音波中的上游控制点
- 公司简介
- Infineon Technologies
- TTP
- Verasonics
- Vermon
- imec
- TRS Technologies
- TSMC
- NVIDIA
- NICAMED
- Intelerad Medical Systems
- RadNet / DeepHealth
- iCAD
- Konica Minolta
- Boston Scientific
- 第七丛集:以中国为中心的供应商/本地生态系统
- 丛集概览(竞争机制)
- 中国超音波生态系地图
- 公司简介
- Mindray
- SonoScape
- Chison
- Fiyano
- Shantou Ultrasound / SIUI
- Huasheng Medical
- Wandong Medical
- NICAMED
- ESI
- DolphinSonic
- United Imaging Healthcare
第五章:按地区/国家分類的市场分析
- 北美洲
- 我们
- 加拿大
- 亚太地区
- 中国
- 日本
- 印度
- 亚太其他地区
- 欧洲
- 德国
- 法国
- 英国
- 义大利
- 其他欧洲国家
- 拉丁美洲
- 中东和非洲
Report Overview
This Horizon report is Marketstrat's in-depth global analysis of the ultrasound market and broader ultrasound ecosystem - built for ultrasound OEM executives, strategy and corporate development teams, services / aftermarket leaders, providers, investors, and AI/workflow vendors adjacent to imaging. The report integrates ultrasound hardware, installed-base economics, service / aftermarket revenue, core AI recurring revenue, the broader AI bridge, market-structure views, competitive architecture, and strategic frameworks into one reconciled decision model.
Unlike conventional ultrasound reports that treat AI as an add-on chapter, this report treats AI as a first-class commercialization layer across acquisition guidance, reporting, quantification, cloud orchestration, enterprise governance, and recurring monetization. The goal is not just to describe the market - it is to explain where value is forming, how it is being monetized, how competition is reorganizing, and which commercial moves matter most over the next decade.
Market Snapshot
Ultrasound is broadening faster than it is premiumizing. World systems revenue rises from $9.6B in 2024A to $16.4B in 2035E, while annual shipments increase from 204,183 to 480,331 units and installed base expands from 1.15M to 1.90M units. That means the market is adding many more devices into many more settings than a simple topline revenue view suggests.
The more important structural shift sits above hardware. Total ecosystem revenue grows from $12.5B to $21.5B, while service + core AI recurring rises from $2.9B to $5.2B and the broader AI bridge expands from $593.6MM to $4.3B. In other words, the next value pool is increasingly tied to workflow, reporting, governance, cloud review, and software-linked operating leverage rather than to hardware ASP alone.
Key Takeaways
- The global ultrasound ecosystem expands from $12.5B (2024A) to $21.5B (2035E), as the market broadens beyond hardware into service, workflow, and AI-linked monetization.
- Ultrasound is entering a structural two-speed transition: premium and midrange carts remain the value core, while compact / portable and handheld / POCUS expand the addressable user base and site-of-care footprint.
- The AI layer is not a feature checklist - it is a monetization architecture shift. The broader AI bridge grows from $593.6MM to $4.3B, with increasing value moving toward software, cloud / PPU, services, workflow, and governance.
- Marketstrat structures ultrasound competition through a cluster-based ecosystem architecture and applies the full Markintel-TM framework stack to translate sizing into actionable GTM, packaging, and partnership priorities
Key Market Trends (What is Structurally Changing)
- Compact / Portable becomes the main hardware growth engine. It rises from 29.6% of systems revenue in 2024A to 37.2% in 2035E and becomes the largest single hardware segment.
- Handheld / POCUS becomes the main access-expansion engine. It remains smaller in revenue than carts, but its shipment share expands from 19.2% to 38.9%, signaling a major shift in where and by whom ultrasound is used.
- The market is becoming more software-defined. The report's central thesis is that value is migrating above the probe into acquisition guidance, structured reporting, QA, governance, cloud review, and enterprise workflow insertion.
- Regional growth and monetization are diverging. North America remains the largest revenue pool, Europe remains an installed-base and recurring-rich market, APAC is the fastest-growing major region and biggest long-run scale reservoir, while LATAM and MEA remain smaller but strategically important for portability, value-tier positioning, and service-network execution.
- China now requires a separate strategy. The report treats China as a distinct competitive system shaped by procurement, domestic substitution, local AI, value-tier scale, and export ambition rather than as just another regional sub-market.
Competitive Landscape (Cluster-Based Ecosystem Architecture)
Marketstrat structures the ultrasound ecosystem into clusters to clarify where value is captured and who controls distribution, workflow, and monetization. The report organizes the market into:
- Systems OEMs / platform incumbents
- Portable / compact / POCUS hardware
- Handheld / home-use ultrasound
- AI acquisition / interpretation / workflow / decision support
- Frontier / wearable / hybrid / therapeutic
- Semiconductor / transducer / infrastructure / enabling technology
- China-specific vendors / local ecosystem
Within and across those clusters, the report explains:
- where the moat sits (distribution vs workflow vs platform control),
- how revenue is captured (bundle vs attach vs enterprise subscription vs cloud / PPU vs services),
- and what to watch over the next 12-24 months. The report specifically identifies GE HealthCare, Philips, Mindray, Samsung Medison, Siemens Healthineers, Canon Medical, FUJIFILM Sonosite, Butterfly Network, Clarius, Exo, UltraSight, BrightHeart, Sonio, Us2.ai, AS Software, SonoScape, and more than 60 additional ecosystem participants.
Companies Discussed
AISAP, AS Software, ASUS LU800, Biotics AI, Boston Scientific, Brainsonix, BrightHeart, Butterfly Network, Canon Medical Systems, Caption Health, Carthera, Chison, Clarius Mobile Health, DeepHealth / See-Mode, DeepSight Technology, DiA Imaging Analysis, Diagnoly, DolphinSonic, EchoNous, EndoSound, Esaote, ESI, Evident Vascular, EXACT Therapeutics, Exo, Fiyano, Flosonics Medical, FUJIFILM / FUJIFILM Sonosite, GE HealthCare, Gestalta, Healcerion, HeartFocus / DESKi, HeartLab, HistoSonics, Hitachi, Huasheng Medical, iCAD, imec, Infineon Technologies, Intelerad Medical Systems, Intelligent Ultrasound / Surgical Science, iSono Health, Koios Medical, Konica Minolta, Laza Medical, MAUI Imaging, MediReport, Merge Labs, MicroPort Lifesciences, Mindray, MyCardium AI, NerveBlox, NICAMED, NVIDIA, Openwater, Oxailis, OxSonics Therapeutics, Petal Surgical, Philips, PIUR Imaging, Pulsenmore, Qure.ai, RadNet / DeepHealth, Resolve Stroke, Rivanna Medical, Samsung Medison, Sanmai Technologies, SecondWave Systems, Seno Medical, Shantou Ultrasound / SIUI, Siemens Healthineers, Softsonics, SonALAsense, Sonic Incytes, Sonio, SonoScape, Sonus Microsystems, SuperSonic Imagine, ThinkSono, TodoPocus, TRS Technologies, TSMC, TTP, UltraSight, Ultrasound AI, Ultromics, United Imaging Healthcare, Us2.ai, Vave Health, Ventripoint Diagnostics, Verasonics, Vermon, Wandong Medical
Methodology & Frameworks
The report is built on Marketstrat's Markintel-TM Horizon methodology, combining:
- a reconciled core market model,
- an AI bridge that clarifies embedded vs recurring vs cloud/consumption economics,
- and publishable market-structure views that reconcile back to the same totals.
The full Horizon framework stack is applied as an insight-to-action engine, including:
- M3 Market Momentum Matrix
- M TEM
- T DIC
- Solution Adoption & Growth Matrix
- Use-Case Monetization Map
- ARC-Index
- Ecosystem Collaboration Matrix
- Partnering Decision Tree
- Upgrade & Package Ladder
- AI Revenue Bridge
What's Covered
- Core global model (2024A-2035E): systems revenue, service / aftermarket, core AI recurring, installed base, unit shipments, and AI bridge value pools.
- Hardware segmentation: premium cart, midrange cart, value cart, compact / portable console, handheld / POCUS.
- Standardized geography model: North America (U.S., Canada), Europe (Germany, France, UK, Italy, ROE), APAC (China, Japan, India, ROAPAC), LATAM, MEA.
- Market Structure Views: end-market mix, clinical application mix, purchase model mix, operating model mix, AI capability mix.
- Competitive landscape: cluster-based architecture plus company spotlights.
- Commercial architecture: packaging logic, partnership motion, AI monetization architecture, and report-facing implications-to-action.
TABLE OF CONTENTS
SECTION 1 - EXECUTIVE SUMMARY
- 1.1 Executive Takeaways
- 1.2 Executive Summary Dashboard
- 1.3 Global Market At-a-Glance (Core Model)
- 1.4 The AI Layer: Where Monetization Shifts
- 1.5 Market Structure: What Is Structurally Changing
- 1.6 Competitive Landscape at-a-Glance
- Ultrasound Market Competitive Landscape at-a-Glance - Executive View
- 1.7 Implications-to-Action (Executive Actions)
- 1.8 Signals to Watch (Next 12-24 Months)
SECTION 2 - METHODOLOGY
- 2.1 What This Report Is-and What It Is Not
- 2.2 Research Foundation and How Sources Are Used
- Methodology - Standardized Source Stack and Usage Rules
- 2.3 Methodology Architecture - Ultrasound Horizon Program
- 2.4 Market Definition and Segmentation Schema
- Market Coverage - Standardized Geography Map
- Core Ultrasound Hardware Segmentation Schema
- 2.5 Research Workflow - Ultrasound Horizon Program
- 2.6 Core Market Sizing & Forecasting Methodology (2024A-2035E)
- Ultrasound - Core Modeled Outputs and Report-Facing Conventions
- 2.7 AI Layer Methodology: Core Recurring vs Total AI Bridge
- Ultrasound AI Layer Methodology - What Sits Where, And Why
- 2.8 Non-Model Market Structure Views Methodology
- Ultrasound Non-Model Market Structure Views - What They Do and Why They Are Derived, Not Independently Forecast
- 2.9 Competitive Landscape Methodology
- Ultrasound Competitive Clustering and Spotlight Methodology
- 2.10 Strategic Frameworks: How the Horizon Framework Stack Converts Model Output into Action
- Ultrasound Horizon Framework Stack - From Question to Action
- 2.11 QA, Reconciliation, and Reproducibility
- Ultrasound Research - QA, Reconciliation, and Reproducibility
- 2.12 Limitations and Guidance for Interpretation
- Interpretation Guardrails - How to Read the Output Correctly
SECTION 3 - STRATEGIC FRAMEWORKS & MARKET ANALYSIS
- 3.1 World Ultrasound Market Overview (Modeled Core)
- 3.2 World Ultrasound Market - Non-Model Analysis (Market Structure Views)
- End-Market Mix
- Clinical Application Mix
- Purchase Model Mix
- Operating Model Mix
- AI Capability Mix
- 3.3 Strategic Frameworks Architecture - Ultrasound Horizon Program
- Included Frameworks and Ultrasound-Specific Adaptation
- 3.4 M3 Market Momentum Matrix (Global Ultrasound)
- 3.5 M-TEM (Technology Maturity Scoring)
- M-TEM Scorecard - Ultrasound Technology Stack
- 3.6 Ultrasound AI Revenue by Stream (Bridge View)
- 3.7 T-DIC (Technology Diffusion & Impact Curve)
- T-DIC - Priority Ultrasound Technology Transitions
- 3.8 Solution Adoption & Growth Matrix
- Solution Adoption & Growth Matrix - Ultrasound AI / Workflow Use Cases
- 3.9 Ultrasound AI Use-Case Monetization Architecture
- Ultrasound AI Use-Case Monetization Map
- 3.10 GTM Growth-Maturity Matrix - Ultrasound Ecosystem (Selected)
- GTM Growth-Maturity Matrix - Selected Ultrasound Ecosystem Players
- 3.11 Ecosystem Collaboration - Ultrasound Ecosystem
- Ecosystem Collaboration Matrix - Ultrasound
- Ecosystem Collaboration - Partner Archetype and Why It Matters
- Control Plane Map - Distribution vs Workflow
- 3.12 Partnering Decision Tree
- Partnering Decision Tree - Recommended Commercialization Motion by Starting Position
- 3.13 ARC-Index (Approvals, Reimbursement/ROI, Clinical Validation)
- ARC-Index - Ultrasound AI Capabilities
- 3.14 Ultrasound Upgrade & Package Ladder
- Ultrasound Upgrade & Package Ladder - Selected Commercial Tiers
- 3.15 Ultrasound AI Revenue Bridge
SECTION 4 - COMPETITIVE LANDSCAPE & COMPANY SPOTLIGHT
- 4.1 Cross-Cutting Competitive Thesis
- 4.2 Competitive Landscape Map - Ultrasound Ecosystem (Clusters & Sub-Clusters)
- Ultrasound Competitive Landscape Map - Clusters and Sub-Clusters
- Competitive Signal Scorecard
- Competitive Signal Scorecard - Selected High-Impact Companies
- Global Systems OEM Share Bands (2024A, Global; Directional)
- Ultrasound systems regional share bands (2024A, global; directional)
- 4.3 Cluster 1 - Systems OEMs / Platform Incumbents
- Cluster Landscape (How Competition Works)
- Company Spotlights
- GE HealthCare
- Philips
- Siemens Healthineers
- Samsung Medison
- Mindray
- Canon Medical Systems
- FUJIFILM / FUJIFILM Sonosite
- SonoScape
- Esaote
- United Imaging Healthcare
- Hitachi (legacy ultrasound franchise)
- 4.4 Cluster 2 - Portable / Compact / POCUS Hardware
- Cluster Landscape (How Competition Works)
- Company Spotlights
- EchoNous
- Exo
- FUJIFILM Sonosite
- GE HealthCare (Venue / Vscan family)
- Mindray (TE / M / Z families; TE Air adjacency)
- Philips (Lumify / compact CV / shared-service systems)
- Samsung Medison
- Canon Medical
- Esaote
- Chison
- Fiyano
- TodoPocus
- Rivanna Medical
- Vave Health
- ASUS LU800
- 4.5 Cluster 3 - Handheld / Home-Use Ultrasound
- Cluster landscape (how competition works)
- Company Spotlights
- Butterfly Network
- Clarius Mobile Health
- Exo
- Pulsenmore
- GE HealthCare (Vscan Air)
- Mindray (TE Air)
- Healcerion
- ASUS LU800
- Vave Health
- TodoPocus
- 4.6 Cluster 4 - AI Acquisition / Interpretation / Workflow / Decision Support
- Cluster landscape (how competition works)
- AI / Workflow Competitive Battlegrounds - Ultrasound
- Company Spotlights
- BrightHeart
- Caption Health / GE HealthCare
- UltraSight
- Ultrasound AI
- AS Software
- Intelligent Ultrasound / Surgical Science
- Us2.ai
- DiA Imaging Analysis / Philips
- Koios Medical
- MyCardium AI
- Sonio / Samsung Medison
- Ultromics
- Diagnoly
- AISAP
- Biotics AI
- DeepHealth / See-Mode
- MediReport
- HeartFocus / DESKi
- ThinkSono
- PIUR Imaging
- NerveBlox
- Qure.ai
- ESI
- DolphinSonic
- HeartLab
- 4.7 Cluster 5 - Frontier / Wearable / Hybrid / Therapeutic / Intervention
- Cluster Landscape (How Competition Works)
- Frontier Ultrasound Sub-Cluster Map
- Company Spotlights
- Sonus Microsystems
- HistoSonics
- iSono Health
- MAUI Imaging
- Oxailis
- Resolve Stroke
- Softsonics
- Evident Vascular
- Flosonics Medical
- Seno Medical
- Ventripoint Diagnostics
- Sonic Incytes
- EndoSound
- DeepSight Technology
- Laza Medical
- Merge Labs
- Petal Surgical
- EXACT Therapeutics
- SonALAsense
- SecondWave Systems
- SuperSonic Imagine
- Carthera
- OxSonics Therapeutics
- Openwater
- Sanmai Technologies
- Brainsonix
- Gestalta
- MicroPort Lifesciences
- 4.8 Cluster 6 - Semiconductor / Transducer / Infrastructure / Enabling Technology
- Cluster Landscape (How Competition Works)
- Enabling Stack Map - Upstream Control Points in Ultrasound
- Company Spotlights
- Infineon Technologies
- TTP
- Verasonics
- Vermon
- imec
- TRS Technologies
- TSMC
- NVIDIA
- NICAMED
- Intelerad Medical Systems
- RadNet / DeepHealth
- iCAD
- Konica Minolta
- Boston Scientific
- 4.9 Cluster 7 - China-Specific Vendors / Local Ecosystem
- Cluster Landscape (How Competition Works)
- China Ultrasound Ecosystem Map - Role Structure, Not Share Claim
- Company Spotlights
- Mindray
- SonoScape
- Chison
- Fiyano
- Shantou Ultrasound / SIUI
- Huasheng Medical
- Wandong Medical
- NICAMED
- ESI
- DolphinSonic
- United Imaging Healthcare
SECTION 5 - REGIONAL/COUNTRY MARKET ANALYSIS
- 5.1 North America Ultrasound Market
- Key Takeaways
- Market Landscape
- North America Country Contribution
- North America Market Snapshot
- North America Systems Layer
- What is Common vs. What Diverges Across the Two Countries
- North America Ecosystem Layer & AI Bridge
- North America Market Structure Views
- Bottom Line
- 5.2 United States Ultrasound Market
- What Matters, Why It Moves, And Where Value Accrues
- U.S. Market Landscape
- Market Snapshot
- U.S. Ultrasound Ecosystem Revenue Forecast
- Demand and Utilization Economics
- Fleet Economics and Replacement Dynamics
- Technology Mix Shift
- U.S. Ultrasound Growth-Engine Matrix
- AI Layer in the U.S.
- Competitive and Commercial Dynamics (U.S. Lens)
- Signals to Watch (Next 12-24 Months; U.S.)
- U.S. Market Estimates and Forecasts - Core Model
- U.S. Market Structure Snapshot - Market Structure Views
- U.S. Ultrasound Market Strategic Takeaways
- Implications
- Canada Ultrasound Market
- Key Takeaways
- Market Landscape
- Market Snapshot
- Canada - Ultrasound Systems Layer
- Canada Growth-Engine Matrix
- Canada Systems Growth Bridge
- Canada - Ultrasound ecosystem layer and AI bridge
- Canada Market Structure Snapshot - Market Structure Views
- Demand, Reimbursement, And Commercial Structure
- Bottom Line
- 5.3 APAC Ultrasound Market
- Key Takeaways
- Market Landscape
- What Is Common, And Where APAC Splits
- APAC Country Monetization / Growth Profile
- APAC Market Snapshot
- APAC Systems Layer
- APAC Ecosystem Layer & AI Bridge
- APAC End-Market Profile by Country
- APAC Market Structure Views
- Bottom Line
- 5.4 China Ultrasound Market
- Key Takeaways
- Market Landscape
- China Market Snapshot
- China - Ultrasound Systems Layer
- China Growth-Engine Matrix
- China Systems Growth Bridge
- China - Ultrasound Ecosystem Layer and AI Bridge
- Demand, Procurement, And Commercial Structure
- China Market Structure Views
- Bottom Line
- 5.5 Japan Ultrasound Market
- Key Takeaways
- Market Landscape
- Japan Market Snapshot
- Japan Systems Layer
- Japan Growth-Engine Matrix by Hardware Segment
- Japan Systems Growth Bridge
- Japan Ecosystem Layer and AI Bridge
- Demand, Reimbursement, And Commercial Structure
- Japan Market Structure Views
- Bottom Line
- 5.6 India Ultrasound Market
- Key Takeaways
- Market Landscape
- India Market Snapshot
- India Systems Layer
- India Growth-Engine Matrix
- India Systems Growth Bridge
- India Ecosystem Layer and AI Bridge
- Demand, Reimbursement, And Commercial Structure
- India Market Structure Views
- Bottom Line
- 5.7 Rest of Asia-Pacific (ROAPAC) Ultrasound Market
- Key Takeaways
- Market Landscape
- Regional Cluster Lens (How to Read ROAPAC)
- ROAPAC Market Snapshot
- ROAPAC Systems Layer
- ROAPAC Growth-Engine Matrix
- ROAPAC Ecosystem Layer and AI Bridge
- ROAPAC Systems Growth Bridge
- Demand And Utilization Economics
- Competitive And Commercial Dynamics
- Signals to Watch
- ROAPAC Market Structure Views
- Bottom Line
- 5.8 Europe Ultrasound Market
- Key Takeaways
- Market Landscape
- What Is Common, And Where Does Europe Split?
- Europe Country Monetization / Growth Profile
- Europe Market Snapshot
- Europe Systems Layer
- Europe Ecosystem Layer & AI Bridge
- Europe End-Market Profile by Country
- Europe Market Structure Views
- Bottom Line
- Germany Ultrasound Market
- Key Takeaways
- Market Landscape
- Germany Market Snapshot
- Germany Systems Layer
- Germany Growth-Engine Matrix
- Germany Ecosystem Layer and AI Bridge
- Germany Systems Growth Bridge
- Demand, Reimbursement, And Commercial Structure
- Germany Market Structure Views
- Bottom Line
- France Ultrasound Market
- Key Takeaways
- Market Landscape
- France Market Snapshot
- France Systems Layer
- France - Ultrasound Growth-Engine Matrix by Hardware Segment
- France Ecosystem Layer and AI Bridge
- France - Ultrasound Systems Growth Bridge
- Demand, Reimbursement, And Commercial Structure
- France Market Structure Views
- Bottom Line
- UK Ultrasound Market
- Key Takeaways
- Market Landscape
- UK Market Snapshot
- UK Systems Layer
- UK Growth-Engine Matrix by Hardware Segment
- UK Ecosystem Layer and AI Bridge
- UK - Ultrasound Systems Growth Bridge
- Demand, Reimbursement, And Commercial Structure
- UK Market Structure Views
- Bottom Line
- Italy Ultrasound Market
- Key Takeaways
- Italy Market Landscape
- Italy Market Snapshot
- Territorial Care, Digital Readiness, And Procurement Structure
- Italy Growth-Engine Matrix by Hardware Segment
- Italy Systems Layer
- Italy Ecosystem Layer & AI Bridge
- Italy Systems Growth Bridge
- Italy Market Structure Views
- Bottom Line
- Rest of Europe (ROE) Ultrasound Market
- Key Takeaways
- Market Landscape
- Regional Cluster Lens (How to Read ROE)
- ROE Market Snapshot
- ROE Systems Layer
- ROE Growth Engine Matrix
- ROE Ecosystem Layer & AI Bridge
- ROE Systems Growth Bridge
- Demand, Reimbursement, And Commercial Structure
- ROE Market Structure Views
- Bottom Line
- LATAM Ultrasound Market
- Key Takeaways
- Market Landscape
- LATAM Market Snapshot
- LATAM Systems Layer
- LATAM Growth-Engine Matrix by Hardware Segment
- LATAM Ecosystem Layer & AI Bridge
- LATAM Systems Growth Bridge
- Demand, Procurement, And Commercial Structure
- LATAM Market Structure Views
- Bottom Line
- Middle East & Africa (MEA) Ultrasound Market
- Key Takeaways
- Market Landscape
- Regional Cluster Lens
- MEA Market Snapshot
- MEA Systems Layer
- MEA Growth-Engine Matrix
- MEA Ecosystem Layer & AI Bridge
- MEA - Ultrasound Systems Growth Bridge
- Demand, Procurement, And Commercial Structure
- MEA Market Structure Views
- Bottom Line
LIST OF FIGURES
- Figure 1: World Ultrasound Ecosystem Revenue by Stream
- Figure 2: Global Ultrasound Hardware Mix Shift - Revenue Share vs Unit Shipment Share
- Figure 3: World Ultrasound AI Value-Pool Bridge by Stream
- Figure 4: Global Ultrasound Value Migration Above the Probe
- Figure 5: Ultrasound Regional Market Opportunity Map - Scale vs Growth
- Figure 6: Ultrasound Market - Competitive Architecture At-a-Glance
- Figure 7: Ultrasound Horizon Methodology Architecture
- Figure 8: Ultrasound Horizon Program - Research Workflow
- Figure 9: Ultrasound Market Strategic Frameworks - From Model to Insight to Action
- Figure 10: Global Ultrasound Ecosystem Revenue Forecast
- Figure 11: Global Systems Revenue by Hardware Segment
- Figure 12: Global Ultrasound End-Market Mix (Ecosystem Revenue)
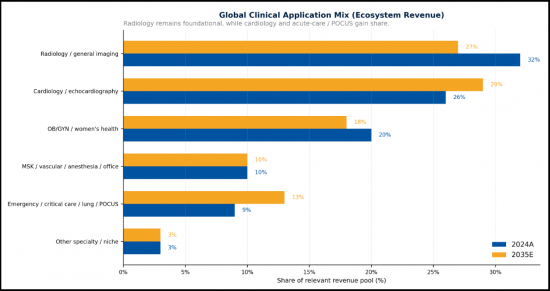
- Figure 13: Global Ultrasound Clinical Application Mix (Ecosystem Revenue)
- Figure 14: Global Ultrasound Purchase Model Mix
- Figure 15: Global Ultrasound Operating Model Mix
- Figure 16: Global Ultrasound AI Capability Mix
- Figure 17: Ultrasound Market Strategic Frameworks Architecture
- Figure 18: M3 Market Momentum Matrix (Global Ultrasound)
- Figure 19: M3 Market Momentum Matrix - Ultrasound Ecosystem Revenue Streams
- Figure 20: Ultrasound M-TEM (Technology Maturity Scoring)
- Figure 21: Ultrasound AI Revenue Bridge by Stream
- Figure 22: Ultrasound T-DIC (Technology Diffusion & Impact Curve)
- Figure 23: Solution Adoption & Growth Matrix - Ultrasound AI / Workflow Use Cases
- Figure 24: Ultrasound AI Use-Case Monetization Architecture
- Figure 25: GTM Growth-Maturity Matrix - Selected Ultrasound Ecosystem Players
- Figure 26: Ecosystem Collaboration Matrix - Ultrasound
- Figure 27: Ultrasound Control Plane Map - Distribution vs Workflow
- Figure 28: Partnering Decision Tree - Ultrasound AI / Workflow Commercialization
- Figure 29: ARC-Index - Ultrasound AI Capability Readiness
- Figure 30: Ultrasound Upgrade & Package Ladder
- Figure 31: Ultrasound AI Revenue Bridge
- Figure 32: Ultrasound Competitive Landscape Map - Cluster Universe View
- Figure 33: Ultrasound Market - Competitive Signal Scorecard
- Figure 34: Global Ultrasound Systems - OEM Share Structure (2024)
- Figure 35: Ultrasound Systems - Regional OEM Share Structure (2024)
- Figure 36: Handheld/POCUS Vendor Structure (2024)
- Figure 37: North America - Ultrasound Market Contribution by Country
- Figure 38: North America - Care Model Divergence in Ultrasound Market Between US & Canada
- Figure 39: U.S. Ultrasound Ecosystem Revenue by Modeled Stream
- Figure 40: U.S. Ultrasound Growth-Engine Matrix by Hardware Segment
- FIGURE 41: U.S. AI VALUE POOL BRIDGE BY STREAM (2024A, 2030E, 2035E)
- Figure 42: U.S. Ultrasound Systems Growth Bridge
- Figure 43: Canada Ultrasound Growth-Engine Matrix by Hardware Segment
- Figure 44: Canada Ultrasound Systems Growth Bridge
- Figure 45: APAC Country Ultrasound Monetization / Growth Profile
- Figure 46: APAC End-Market Profile by Country
- Figure 47: China - Ultrasound Growth-Engine Matrix
- Figure 48: China - Ultrasound Systems Growth Bridge
- Figure 49: Japan - Ultrasound Growth-Engine Matrix by Hardware Segment
- Figure 50: Japan - Ultrasound Systems Growth Bridge
- Figure 51: India - Growth-Engine Matrix
- Figure 52: India - Systems Growth Bridge
- Figure 53: ROAPAC - Ultrasound Growth-Engine Matrix by Hardware Segment
- Figure 54: ROAPAC - Ultrasound Systems Growth Bridge
- Figure 55: Europe Ultrasound Country Monetization / Growth Profile
- Figure 56: Europe Ultrasound End-Market Profile by Country
- Figure 57: Germany - Ultrasound Growth-Engine Matrix by Hardware Segment
- Figure 58: Germany - Ultrasound Systems Growth Bridge
- Figure 59: France - Ultrasound Growth-Engine Matrix by Hardware Segment
- Figure 60: France - Ultrasound Systems Growth Bridge
- Figure 61: UK - Ultrasound Growth-Engine Matrix by Hardware Segment
- Figure 62: UK - Ultrasound Systems Growth Bridge
- Figure 63: Italy - Ultrasound Growth-Engine Matrix by Hardware Segment
- Figure 64: Italy - Ultrasound Systems Growth Bridge
- Figure 65: ROE Ultrasound Growth-Engine Matrix by Hardware Segment
- Figure 66: ROE Ultrasound Systems Growth Bridge
- Figure 67: LATAM - Ultrasound Growth-Engine Matrix by Hardware Segment
- Figure 68: LATAM - Ultrasound Systems Growth Bridge
- Figure 69: MEA - Ultrasound Growth-Engine Matrix by Hardware Segment
- Figure 70: MEA - Ultrasound Systems Growth Bridge
LIST OF TABLES
- Table 1: Global Ultrasound Executive Revenue Dashboard
- Table 2: Global Ultrasound Unit and Installed-Base Metrics
- Table 3: Global Ultrasound Hardware Structure and Mix Shift
- Table 4: Global Ultrasound AI Value-Pool Bridge - Executive View
- Table 5: Ultrasound Market - Regional Ecosystem Revenue Summary
- Table 6: Global Ultrasound Market Snapshot (Core Model)
- Table 7: Global Ultrasound Systems Revenue by Hardware Segment
- Table 8: Global End-Market Mix - Share and Reconciled Ecosystem Revenue (2024A Vs 2035E)
- Table 9: Global Clinical Application Mix - Share and Reconciled Ecosystem Revenue (2024a Vs 2035e)
- Table 10: Global Purchase Model Mix - Share and Reconciled Systems Revenue (2024A Vs 2035E)
- Table 11: Global Operating Model Mix - Share and Reconciled Ecosystem Revenue (2024A Vs 2035E)
- Table 12: Global AI Capability Mix - Share and Reconciled Core Ai Recurring Revenue (2024A vs 2035E)
- Table 13: M3 Market Momentum Matrix - Ultrasound System Segments
- Table 14: M3 Market Momentum Matrix - Ultrasound Ecosystem Revenue Streams
- Table 15: Ultrasound AI Revenue by Stream / Bridge View - Normalized Mix Display
- Table 16: Ultrasound AI Revenue Bridge - Commercial Interpretation and Packaging Logic
- Table 17: Handheld / POCUS Share Bands (2024A, Global; Directional)
- TABLE 18: NORTH AMERICA - ULTRASOUND MARKET SNAPSHOT (2024A, 2030E, 2035E, CAGR)
- Table 19: North America Ultrasound Systems Revenue by Hardware Segment (2024A, 2030E, 2035E, CAGR)
- Table 20: North America Ultrasound Systems Unit Shipments by Hardware Segment (2024A, 2030E, 2035E, CAGR)
- Table 21: North America Ultrasound Systems Installed Base by Hardware Segment (2024A, 2030E, 2035E, CAGR)
- Table 22: North America Core Ecosystem Revenue Streams (2024A, 2030E, 2035E, CAGR)
- TABLE 23: NORTH AMERICA AI VALUE-POOL REVENUE (2024A, 2030E, 2035E, CAGR)
- Table 24: North America Ecosystem Revenue by End-Market Mix (2024A, 2030E, 2035E, CAGR)
- Table 25: North America Ecosystem Revenue by Clinical Application Mix (2024A, 2030E, 2035E, CAGR)
- Table 26: North America Share of Systems Revenue by Purchase Model Mix (2024A, 2030E, 2035E, CAGR)
- Table 27: North America Ecosystem Revenue by Operating Model Mix (2024A, 2030E, 2035E, CAGR)
- TABLE 28: U.S. ULTRASOUND MARKET SNAPSHOT (2024A, 2030E, 2035E, CAGR)
- TABLE 29: U.S. ULTRASOUND MARKET - AI LAYER, USD MILL (2024A, 2030E, 2035E)
- Table 30: U.S. Ultrasound Market Share Structure by Vendor
- TABLE 31: U.S. ULTRASOUND MARKET SUMMARY (UNITS & REV) - 2024A, 2030E, 2035E
- Table 32: U.S. Ultrasound Unit Shipments by Hardware Segment - 2024A, 2030E, 2035E
- Table 33: U.S. Ultrasound Systems Rev by Hardware Segment - 2024A, 2030E, 2035E
- Table 34: U.S. Ultrasound Systems Installed Base by Hardware Segment - 2024A, 2030E, 2035E
- TABLE 35: U.S. ECOSYSTEM REVENUE BY END-MARKET MIX (2024A, 2030E, 2035E, CAGR)
- TABLE 36: U.S. ECOSYSTEM REVENUE BY CLINICAL APPLICATION MIX (2024A, 2030E, 2035E, CAGR)
- TABLE 37: U.S. SYSTEMS REVENUE BY PURCHASE MODEL MIX (2024A, 2030E, 2035E, CAGR)
- TABLE 38: U.S. ECOSYSTEM REVENUE BY OPERATING MODEL MIX (2024A, 2030E, 2035E, CAGR)
- TABLE 39: CANADA - ULTRASOUND MARKET SNAPSHOT (2024A, 2030E, 2035E, CAGR)
- Table 40: Canada - Ultrasound Systems Rev by Hardware Segment - 2024A, 2030E, 2035E
- Table 41: Canada - Ultrasound Unit Shipments by Hardware Segment - 2024A, 2030E, 2035E
- Table 42: Canada - Ultrasound Systems Installed Base by Hardware Segment - 2024A, 2030E, 2035E
- TABLE 43: CANADA - ULTRASOUND ECOSYSTEM REVENUE (2024A, 2030E, 2035E, CAGR)
- TABLE 44: CANADA - ULTRASOUND AI VALUE-POOL BRIDGE REVENUE (2024A, 2030E, 2035E, CAGR)
- TABLE 45: CANADA - ECOSYSTEM REVENUE BY END-MARKET MIX (2024A, 2030E, 2035E, CAGR)
- Table 46: Canada - Ecosystem Revenue by Clinical Application Mix (2024A, 2030E, 2035E, CAGR)
- TABLE 47: CANADA - SYSTEMS REVENUE BY PURCHASE MODEL MIX (2024A, 2030E, 2035E, CAGR)
- Table 48: Canada - Ecosystem Revenue by Operating Model Mix (2024A, 2030E, 2035E, CAGR)
- TABLE 49: APAC - ULTRASOUND MARKET SNAPSHOT (2024A, 2030E, 2035E, CAGR)
- Table 50: APAC - Ultrasound Systems Rev by Hardware Segment - 2024A, 2030E, 2035E
- Table 51: APAC - Ultrasound Unit Shipments by Hardware Segment - 2024A, 2030E, 2035E
- Table 52: APAC - Ultrasound Systems Installed Base by Hardware Segment - 2024A, 2030E, 2035E
- TABLE 53: APAC- ULTRASOUND ECOSYSTEM REVENUE (2024A, 2030E, 2035E, CAGR)
- TABLE 54: APAC - ULTRASOUND AI VALUE-POOL BRIDGE REVENUE (2024A, 2030E, 2035E, CAGR)
- TABLE 55: APAC ECOSYSTEM REVENUE BY END-MARKET MIX (2024A, 2030E, 2035E, CAGR)
- TABLE 56: APAC - ECOSYSTEM REVENUE BY CLINICAL APPLICATION MIX (2024A, 2030E, 2035E, CAGR)
- TABLE 57: APAC - SYSTEMS REVENUE BY PURCHASE MODEL MIX (2024A, 2030E, 2035E, CAGR)
- TABLE 58: APAC - ECOSYSTEM REVENUE BY OPERATING MODEL MIX (2024A, 2030E, 2035E, CAGR)
- TABLE 59: CHINA - ULTRASOUND MARKET SNAPSHOT (2024A, 2030E, 2035E, CAGR)
- Table 60: China - Ultrasound Systems Rev by Hardware Segment - 2024A, 2030E, 2035E
- Table 61: China - Ultrasound Unit Shipments by Hardware Segment - 2024A, 2030E, 2035E
- Table 62: China - Ultrasound Systems Installed Base by Hardware Segment - 2024A, 2030E, 2035E
- TABLE 63: CHINA - ULTRASOUND ECOSYSTEM REVENUE (2024A, 2030E, 2035E, CAGR)
- TABLE 64: CHINA - ULTRASOUND AI VALUE-POOL BRIDGE REVENUE (2024A, 2030E, 2035E, CAGR)
- TABLE 65: CHINA - ECOSYSTEM REVENUE BY END-MARKET MIX (2024A, 2030E, 2035E, CAGR)
- Table 66: China - Ecosystem Revenue by Clinical Application Mix (2024A, 2030E, 2035E, CAGR)
- TABLE 67: CHINA - SYSTEMS REVENUE BY PURCHASE MODEL MIX (2024A, 2030E, 2035E, CAGR)
- Table 68: China - Ecosystem Revenue by Operating Model Mix (2024A, 2030E, 2035E, CAGR)
- TABLE 69: JAPAN - ULTRASOUND MARKET SNAPSHOT (2024A, 2030E, 2035E, CAGR)
- Table 70: Japan - Ultrasound Systems Rev by Hardware Segment - 2024A, 2030E, 2035E
- Table 71: Japan - Ultrasound Unit Shipments by Hardware Segment - 2024A, 2030E, 2035E
- Table 72: Japan - Ultrasound Systems Installed Base by Hardware Segment - 2024A, 2030E, 2035E
- TABLE 73: JAPAN - ULTRASOUND ECOSYSTEM REVENUE (2024A, 2030E, 2035E, CAGR)
- TABLE 74: JAPAN - ULTRASOUND AI VALUE-POOL BRIDGE REVENUE (2024A, 2030E, 2035E, CAGR)
- TABLE 75: JAPAN - ECOSYSTEM REVENUE BY END-MARKET MIX (2024A, 2030E, 2035E, CAGR)
- Table 76: Japan - Ecosystem Revenue by Clinical Application Mix (2024A, 2030E, 2035E, CAGR)
- TABLE 77: JAPAN - SYSTEMS REVENUE BY PURCHASE MODEL MIX (2024A, 2030E, 2035E, CAGR)
- Table 78: Japan - Ecosystem Revenue by Operating Model Mix (2024A, 2030E, 2035E, CAGR)
- TABLE 79: INDIA - ULTRASOUND MARKET SNAPSHOT (2024A, 2030E, 2035E, CAGR)
- Table 80: India - Ultrasound Systems Rev by Hardware Segment - 2024A, 2030E, 2035E
- Table 81: India - Ultrasound Unit Shipments by Hardware Segment - 2024A, 2030E, 2035E
- Table 82: India - Ultrasound Systems Installed Base by Hardware Segment - 2024A, 2030E, 2035E
- TABLE 83: INDIA - ULTRASOUND ECOSYSTEM REVENUE (2024A, 2030E, 2035E, CAGR)
- TABLE 84: INDIA - ULTRASOUND AI VALUE-POOL BRIDGE REVENUE (2024A, 2030E, 2035E, CAGR)
- TABLE 85: INDIA - ECOSYSTEM REVENUE BY END-MARKET MIX (2024A, 2030E, 2035E, CAGR)
- Table 86: India - Ecosystem Revenue by Clinical Application Mix (2024A, 2030E, 2035E, CAGR)
- TABLE 87: INDIA - SYSTEMS REVENUE BY PURCHASE MODEL MIX (2024A, 2030E, 2035E, CAGR)
- Table 88: India - Ecosystem Revenue by Operating Model Mix (2024A, 2030E, 2035E, CAGR)
- TABLE 89: ROAPAC - ULTRASOUND MARKET SNAPSHOT (2024A, 2030E, 2035E, CAGR)
- TABLE 90: ROAPAC - ULTRASOUND SYSTEMS REV BY HARDWARE SEGMENT - 2024A, 2030E, 2035E
- Table 91: ROAPAC - Ultrasound Unit Shipments by Hardware Segment - 2024A, 2030E, 2035E
- Table 92: ROAPAC - Ultrasound Systems Installed Base by Hardware Segment - 2024A, 2030E, 2035E
- TABLE 93: ROAPAC - ULTRASOUND ECOSYSTEM REVENUE (2024A, 2030E, 2035E, CAGR)
- TABLE 94: ROAPAC - ULTRASOUND AI VALUE-POOL BRIDGE REVENUE (2024A, 2030E, 2035E, CAGR)
- TABLE 95: ROAPAC - ECOSYSTEM REVENUE BY END-MARKET MIX (2024A, 2030E, 2035E, CAGR)
- TABLE 96: ROAPAC - ECOSYSTEM REVENUE BY CLINICAL APPLICATION MIX (2024A, 2030E, 2035E, CAGR)
- TABLE 97: ROAPAC - SYSTEMS REVENUE BY PURCHASE MODEL MIX (2024A, 2030E, 2035E, CAGR)
- TABLE 98: ROAPAC - ECOSYSTEM REVENUE BY OPERATING MODEL MIX (2024A, 2030E, 2035E, CAGR)
- TABLE 99: EUROPE - ULTRASOUND MARKET SNAPSHOT (2024A, 2030E, 2035E, CAGR)
- Table 100: Europe - Ultrasound Systems Rev by Hardware Segment - 2024A, 2030E, 2035E
- Table 101: Europe - Ultrasound Unit Shipments by Hardware Segment - 2024A, 2030E, 2035E
- Table 102: Europe - Ultrasound Systems Installed Base by Hardware Segment - 2024A, 2030E, 2035E
- TABLE 103: EUROPE - ULTRASOUND ECOSYSTEM REVENUE (2024A, 2030E, 2035E, CAGR)
- TABLE 104: EUROPE - ULTRASOUND AI VALUE-POOL BRIDGE REVENUE (2024A, 2030E, 2035E, CAGR)
- TABLE 105: EUROPE- ECOSYSTEM REVENUE BY END-MARKET MIX (2024A, 2030E, 2035E, CAGR)
- Table 106: Europe - Ecosystem Revenue by Clinical Application Mix (2024A, 2030E, 2035E, CAGR)
- TABLE 107: EUROPE - SYSTEMS REVENUE BY PURCHASE MODEL MIX (2024A, 2030E, 2035E, CAGR)
- Table 108: Europe - Ecosystem Revenue by Operating Model Mix (2024A, 2030E, 2035E, CAGR)
- TABLE 109: GERMANY - ULTRASOUND MARKET SNAPSHOT (2024A, 2030E, 2035E, CAGR)
- Table 110: Germany - Ultrasound Systems Rev by Hardware Segment - 2024A, 2030E, 2035E
- Table 111: Germany - Ultrasound Unit Shipments by Hardware Segment - 2024A, 2030E, 2035E
- Table 112: Germany - Ultrasound Installed Base by Hardware Segment - 2024A, 2030E, 2035E
- TABLE 113: GERMANY - ULTRASOUND ECOSYSTEM REVENUE (2024A, 2030E, 2035E, CAGR)
- TABLE 114: GERMANY - ULTRASOUND AI VALUE-POOL BRIDGE REVENUE (2024A, 2030E, 2035E, CAGR)
- TABLE 115: GERMANY - ECOSYSTEM REVENUE BY END-MARKET MIX (2024A, 2030E, 2035E, CAGR)
- Table 116: Germany - Ecosystem Revenue by Clinical Application Mix (2024A, 2030E, 2035E, CAGR)
- TABLE 117: GERMANY - SYSTEMS REVENUE BY PURCHASE MODEL MIX (2024A, 2030E, 2035E, CAGR)
- Table 118: Germany - Ecosystem Revenue by Operating Model Mix (2024A, 2030E, 2035E, CAGR)
- TABLE 119: FRANCE - ULTRASOUND MARKET SNAPSHOT (2024A, 2030E, 2035E, CAGR)
- Table 120: France - Ultrasound Systems Rev by Hardware Segment - 2024A, 2030E, 2035E
- Table 121: France - Ultrasound Unit Shipments by Hardware Segment - 2024A, 2030E, 2035E
- Table 122: France - Ultrasound Systems Installed Base by Hardware Segment - 2024A, 2030E, 2035E
- TABLE 123: FRANCE - ULTRASOUND ECOSYSTEM REVENUE (2024A, 2030E, 2035E, CAGR)
- TABLE 124: FRANCE - ULTRASOUND AI VALUE-POOL BRIDGE REVENUE (2024A, 2030E, 2035E, CAGR)
- TABLE 125: FRANCE - ECOSYSTEM REVENUE BY END-MARKET MIX (2024A, 2030E, 2035E, CAGR)
- Table 126: France - Ecosystem Revenue by Clinical Application Mix (2024A, 2030E, 2035E, CAGR)
- TABLE 127: FRANCE - SYSTEMS REVENUE BY PURCHASE MODEL MIX (2024A, 2030E, 2035E, CAGR)
- Table 128: France - Ecosystem Revenue by Operating Model Mix (2024A, 2030E, 2035E, CAGR)
- TABLE 129: UK - ULTRASOUND MARKET SNAPSHOT (2024A, 2030E, 2035E, CAGR)
- Table 130: UK - Ultrasound Systems Rev by Hardware Segment - 2024A, 2030E, 2035E
- Table 131: UK - Ultrasound Unit Shipments by Hardware Segment - 2024A, 2030E, 2035E
- Table 132: UK - Ultrasound Systems Installed Base by Hardware Segment - 2024A, 2030E, 2035E
- TABLE 133: UK - ULTRASOUND ECOSYSTEM REVENUE (2024A, 2030E, 2035E, CAGR)
- TABLE 134: UK - ULTRASOUND AI VALUE-POOL BRIDGE REVENUE (2024A, 2030E, 2035E, CAGR)
- TABLE 135: UK - ECOSYSTEM REVENUE BY END-MARKET MIX (2024A, 2030E, 2035E, CAGR)
- TABLE 136: UK - ECOSYSTEM REVENUE BY CLINICAL APPLICATION MIX (2024A, 2030E, 2035E, CAGR)
- TABLE 137: UK - SYSTEMS REVENUE BY PURCHASE MODEL MIX (2024A, 2030E, 2035E, CAGR)
- TABLE 138: UK - ECOSYSTEM REVENUE BY OPERATING MODEL MIX (2024A, 2030E, 2035E, CAGR)
- TABLE 139: ITALY - ULTRASOUND MARKET SNAPSHOT (2024A, 2030E, 2035E, CAGR)
- Table 140: Italy - Ultrasound Systems Rev by Hardware Segment - 2024A, 2030E, 2035E
- Table 141: Italy - Ultrasound Unit Shipments by Hardware Segment - 2024A, 2030E, 2035E
- Table 142: Italy - Ultrasound Systems Installed Base by Hardware Segment - 2024A, 2030E, 2035E
- TABLE 143: ITALY - ULTRASOUND ECOSYSTEM REVENUE (2024A, 2030E, 2035E, CAGR)
- TABLE 144: ITALY - ULTRASOUND AI VALUE-POOL BRIDGE REVENUE (2024A, 2030E, 2035E, CAGR)
- TABLE 145: ITALY - ECOSYSTEM REVENUE BY END-MARKET MIX (2024A, 2030E, 2035E, CAGR)
- Table 146: Italy - Ecosystem Revenue by Clinical Application Mix (2024A, 2030E, 2035E, CAGR)
- TABLE 147: ITALY - SYSTEMS REVENUE BY PURCHASE MODEL MIX (2024A, 2030E, 2035E, CAGR)
- Table 148: Italy - Ecosystem Revenue by Operating Model Mix (2024A, 2030E, 2035E, CAGR)
- TABLE 149: ROE - ULTRASOUND MARKET SNAPSHOT (2024A, 2030E, 2035E, CAGR)
- Table 150: ROE - Ultrasound Systems Rev by Hardware Segment - 2024A, 2030E, 2035E
- Table 151: ROE - Ultrasound Unit Shipments by Hardware Segment - 2024A, 2030E, 2035E
- Table 152: ROE - Ultrasound Systems Installed Base by Hardware Segment - 2024A, 2030E, 2035E
- TABLE 153: ROE - ULTRASOUND ECOSYSTEM REVENUE (2024A, 2030E, 2035E, CAGR)
- TABLE 154: ROE - ULTRASOUND AI VALUE-POOL BRIDGE REVENUE (2024A, 2030E, 2035E, CAGR)
- TABLE 155: ROE - ECOSYSTEM REVENUE BY END-MARKET MIX (2024A, 2030E, 2035E, CAGR)
- TABLE 156: ROE - ECOSYSTEM REVENUE BY CLINICAL APPLICATION MIX (2024A, 2030E, 2035E, CAGR)
- TABLE 157: ROE - SYSTEMS REVENUE BY PURCHASE MODEL MIX (2024A, 2030E, 2035E, CAGR)
- TABLE 158: ROE - ECOSYSTEM REVENUE BY OPERATING MODEL MIX (2024A, 2030E, 2035E, CAGR)
- TABLE 159: LATAM - ULTRASOUND MARKET SNAPSHOT (2024A, 2030E, 2035E, CAGR)
- TABLE 160: LATAM - ULTRASOUND SYSTEMS REV BY HARDWARE SEGMENT - 2024A, 2030E, 2035E
- Table 161: LATAM - Ultrasound Unit Shipments by Hardware Segment - 2024A, 2030E, 2035E
- Table 162: LATAM - Ultrasound Systems Installed Base by Hardware Segment - 2024A, 2030E, 2035E
- TABLE 163: LATAM - ULTRASOUND ECOSYSTEM REVENUE (2024A, 2030E, 2035E, CAGR)
- TABLE 164: LATAM - ULTRASOUND AI VALUE-POOL BRIDGE REVENUE (2024A, 2030E, 2035E, CAGR)
- TABLE 165: LATAM - ECOSYSTEM REVENUE BY END-MARKET MIX (2024A, 2030E, 2035E, CAGR)
- TABLE 166: LATAM - ECOSYSTEM REVENUE BY CLINICAL APPLICATION MIX (2024A, 2030E, 2035E, CAGR)
- TABLE 167: LATAM - SYSTEMS REVENUE BY PURCHASE MODEL MIX (2024A, 2030E, 2035E, CAGR)
- TABLE 168: LATAM - ECOSYSTEM REVENUE BY OPERATING MODEL MIX (2024A, 2030E, 2035E, CAGR)
- TABLE 169: MEA - ULTRASOUND MARKET SNAPSHOT (2024A, 2030E, 2035E, CAGR)
- Table 170: MEA - Ultrasound Systems Rev by Hardware Segment - 2024A, 2030E, 2035E
- Table 171: MEA - Ultrasound Unit Shipments by Hardware Segment - 2024A, 2030E, 2035E
- Table 172: MEA - Ultrasound Systems Installed Base by Hardware Segment - 2024A, 2030E, 2035E
- TABLE 173: MEA - ULTRASOUND ECOSYSTEM REVENUE (2024A, 2030E, 2035E, CAGR)
- TABLE 174: MEA - ULTRASOUND AI VALUE-POOL BRIDGE REVENUE (2024A, 2030E, 2035E, CAGR)
- TABLE 175: MEA - ECOSYSTEM REVENUE BY END-MARKET MIX (2024A, 2030E, 2035E, CAGR)
- TABLE 176: MEA - ECOSYSTEM REVENUE BY CLINICAL APPLICATION MIX (2024A, 2030E, 2035E, CAGR)
- TABLE 177: MEA - SYSTEMS REVENUE BY PURCHASE MODEL MIX (2024A, 2030E, 2035E, CAGR)
- TABLE 178: MEA - ECOSYSTEM REVENUE BY OPERATING MODEL MIX (2024A, 2030E, 2035E, CAGR)
 医学影像分析软体市场:依影像类型、影像方式、软体类型、最终使用者和地区划分
 2026年全球企业影像资讯技术(IT)市场报告
 全球磁振造影(MRI)市场:市场结构、预测及人工智慧收益化结构(2024-2035)-2026年 2月放射学人工智慧市场:依产品、功能、模式、适应症和最终用户划分-全球预测至2036年2026年全球智慧皮肤病扫描仪市场报告
 企业影像处理IT 市场(按组件、模式、部署类型和最终用户)—2025-2030 年全球预测
 全球企业影像 IT 市场(按功能、模式、应用、疗法、最终用户和地区划分)- 预测至 2030 年