


|
市场调查报告书
商品编码
1655857
供应商永续性:Ciena 在网路设备供应商中引领绿色发展,而晶片、光纤和中国供应商则落后Vendor Sustainability: Ciena Leads the Green Charge among NEPs; Chip, Fiber, and Chinese Vendors Lag |
|||||||
本报告涵盖电信领域主要供应商的能源消耗、再生能源使用和碳足迹。
视觉
本报告是对先前两份有关电信永续性的报告的后续:2023 年的 "供应商需要绿色证书才能赢得电信业务" 和 2024 年的 "随着气候变迁迅速恶化,营运商迈出实现永续发展的小步" 。
刊载组织
|
|
目录
摘要
简介
分析
刊载供应商概要
2023年的永续性报告:调查结果
- 能源消费
- 能源强度
- 温室效应气体的排放
领导企业·追随者企业
总论
附录
This brief report addresses energy consumption, use of renewables, and carbon emissions among key vendors to the telecommunications operator (telco) sector. MTN Consulting views climate change as an urgent crisis that is being ignored by too many of the world's wealthiest countries & companies. This report is part of our ongoing coverage of the issue, and an attempt to call greater attention to the subject.
VISUALS
This Brief is a follow-up to two pioneering reports published by MTN Consulting on sustainability in telecom: the 2023 study, "Vendors need green credentials to win telco business," and 2024's "Operators take baby steps towards sustainability as climate change worsens rapidly". The former report analyzed the role of vendors' climate practices in the carbon footprint of their key customers, the telcos. It also provided a framework for understanding the data and the relevant industry organizations and standards (e.g. GRI, SBTi, CDP, TCFD, JAC, GHG Protocol, GeSI, and SASB/ISSB). In the latter report, MTN Consulting reported on a disappointing lack of progress among telcos in their carbon footprints. Telco emissions were basically flat in 2023 YoY. That report's analysis considered only Scope 1 & Scope 2 emissions, and used the "market-based" standard for Scope 2 calculations. This approach should bias the numbers downwards, as it allows companies to reduce reported emissions based on things like renewable energy credits, but the results were nonetheless disappointing for the climate.
Since we did not include Scope 3 in our analysis, which capture upstream and downstream emissions, it's important to examine how vendors (i.e. the "upstream" for telcos) are progressing in their sustainability programs. Unfortunately, the news is not good. For a large sample of 26 vendors selling to telcos, total emissions (Scope 1 + Scope 2 market-based + Scope 3, or "S1-3m") amounted to 481 million metric tons of CO2-equivalent in 2023, down just 3% YoY. Relative to revenues, S1-3m emissions were 254.7 metric tons per US$1M in revenues in 2023, from 271.9 in 2022. Use of renewables rose a bit in 2023, to 68%, from 61% in 2022. All three results indicate some progress, but very slow. The progress is certainly not in line with the urgency of the climate crisis, or the stated carbon neutrality goals of telcos & much of the tech sector. One factor is that there are a few companies in the telco supply chain with notoriously high carbon footprints. Nearly all companies in China fall into this bucket, including top 5 Telco NI vendors Huawei, ZTE, and China Comservice. In addition, cabling & connectivity vendors like Corning and CommScope are behind the times in the march to green energy, as are chip companies further upstream such as Intel. More needs to be done, and quickly, in order for telecom to begin to be part of the solution rather than part of the problem.
That said, there are some leaders in the sector, based upon a relatively high level of renewable energy and low carbon emissions relative to revenues. Within the group of 26 , the leaders are: Accenture, Alphabet, Ciena, IBM, and Oracle. Notably, only one of these - Ciena - is a traditional "network equipment provider" or NEP. In general, NEPs tend to consume more energy and have higher carbon footprints than software & services specialists. Two other NEPs, Ericsson and Nokia, should get honorable mention, as they are making good progress and are relatively transparent in their reports.
Organizations mentioned:
|
|
Table of Contents
Summary
Introduction
Analysis
Overview of the vendors included
Results from 2023 sustainability reports
- Energy consumption
- Energy intensity
- Greenhouse gas emissions
Leaders and laggards
Conclusion
Appendix
List of Figures
- Figure 1: Total energy consumption in 2023, TWh
- Figure 2: Energy intensity, 2023 (MWh per $1M in revenues)
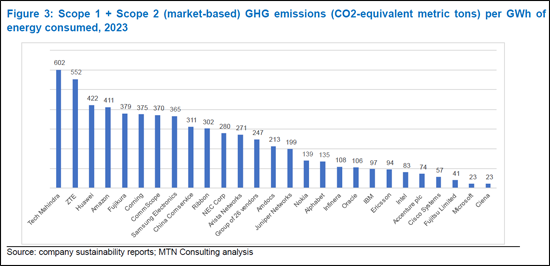
- Figure 3: Scope 1 + Scope 2 (market-based) GHG emissions (CO2-equivalent metric tons) per GWh of energy consumed, 2023
- Figure 4: Renewable energy as a percentage of total consumption, 2023
- Figure 5: Scope 1, 2 (market-based) and Scope 3 emissions, per US$1M in revenue, 2023
 2026年全球永续咨询市场报告
 水力发电的连结:资料中心如何重塑美国水资源格局
 全球水燃料市场规模、份额、趋势和成长分析报告(2026-2034年)
 2025-2029年全球水燃料市场
 2032年食品废弃物减量技术市场预测:按食品类型、技术、应用、最终用户和地区分類的全球分析
 菌丝体基建筑材料市场规模、份额和趋势分析报告:按产品、应用、地区和细分市场预测(2025-2033 年)全球水能技术市场:未来预测(至2032年)-按技术、应用、最终用户和地区分類的分析全球通讯永续发展市场:预测至 2032 年—按组件、部署方式、网路类型、技术、应用、最终用户和地区进行分析
 2025-2029年全球人工智慧在ESG和永续发展领域的市场前景
 永续发展咨询市场:2025-2030 年全球预测(按提供的服务、永续发展重点领域、组织规模、最终用途产业和交付模式)