


|
市场调查报告书
商品编码
1749309
网路规模追踪器(2025 年第一季):人工智慧「错失恐惧症」(FOMO)导致 12 个月资本支出达到 3,400 亿美元,超越电信市场规模Webscale Market Tracker, 1Q25: AI FOMO Pushes 12 month Capex to $340B, Passing Telco Market |
|||||||
如果您认为当前的人工智慧投资热潮是由知识产权盗窃、政府补贴和过高的预期推动的泡沫,那么 2025 年第一季的业绩将不会给您带来任何安慰。
大型科技公司在建构网路规模基础设施方面不断打破纪录。 2025 年第一季度,我们网路规模追踪器中的 22 家公司(包括新加入的 CoreWeave)实现了 6,520 亿美元的营收,年增 9.2%,资本支出飙升 67.2%,达到 970 亿美元。研发支出也增加了 12.2%,达到 840 亿美元,但现金持有量下降 3.6%,至 6,350 亿美元,债务增加 1.3%,至 5,600 亿美元。物业、厂房及设备(净PP&E)飙升至近1兆美元,较去年同期成长32.9%。员工人数与去年持平,为417万人。
视觉
营收:成长集中在四大巨头
2025年第一季,营收达6,516亿美元,年增9.2%,年化规模达2.65兆美元。 CoreWeave 和 Yandex 的成长率最高,但营收主要由四大巨头推动:Alphabet(年成长 13.1%)、亚马逊(年成长 10.1%)、Meta(年成长 19.4%)和微软(年成长 14.1%)。亚马逊的营收增幅最大,年增 124 亿美元,达到 1,557 亿美元(年增 8.6%)。同时,富士通由于退出云端和资料中心服务,营收年减 18.7%。百度、eBay 和 IBM 的成长率均低于 2%。
资本支出:人工智慧热潮将推动支出爆发式成长
2025 年第一季的资本支出将年增 67.2%,达到 966 亿美元,折合成年率为 3,430 亿美元,比前一年增长 65%,创历史新高。
在 ChatGPT 和投资者的推动下,人工智慧热潮已成为该行业的主要驱动力。 GPU 支出正在飙升,美国网路规模公司正像 "醉醺醺的水手" 一样投入巨资。
区域趋势:亚洲復苏
2025 年第一季度,亚太地区营收年增 7%,与全球成长率(9%)的差距正在缩小。
美洲、欧洲以及中东和非洲地区仍维持着较低的两位数成长。在政府的大力支持下,预计到 2026 年,腾讯和阿里巴巴将在亚洲加速发展。
本报告提供全球网站规模市场趋势追踪调查,彙整主要经营者的收益,CAPEX,报酬率的转变·预测,各地区的趋势,主要企业的详细分析,企业基准等资讯。
调查对象:
WNO首位8
|
|
|
|
其他的WNO
|
|
|
|
目录
第1章 报告亮点
第2章 展望
第3章 分析
第4章 主要统计
第5章 企业的详细分析
第6章 企业基准
第7章 各地区明细
第8章 原始数据
第9章 汇率
第10章 关于本公司
If you believe this is a bubble fueled by IP theft, government subsidies, and hype, 1Q25 results will not reassure
Big tech's webscale buildout keeps breaking records. In 1Q25, the 22 companies in our Webscale Tracker, including new entrant CoreWeave, generated $652 billion (B) in revenue (+9.2% YoY), spent $97B on capex (+67.2%), poured $84B into R&D (+12.2%), and held $635B in cash (-3.6%) against $560B in debt (+1.3%). Net PP&E surged 32.9% YoY to nearly $1 trillion. Headcount hit 4.17M, flat YoY.
VISUALS
Revenue: Growth Concentrated in the Big Four
1Q25 revenue hit $651.6B (+9.2% YoY), pushing annualized sales to $2.65T. Coreweave and Yandex posted the fastest growth, but the heavy lifting came from Alphabet (annualized revenues up 13.1% vs. 2Q23-2Q24), Amazon (+10.1%), Meta (+19.4%), and Microsoft (+14.1%).
Amazon added the most dollars: up $12.4B YoY to $155.7B (+8.6%).
At the other end: Fujitsu's revenue dropped 18.7% as it retreats from cloud and data center services. Baidu, eBay, and IBM posted sub-2% growth.
Capex: AI Hype Sends Spending Soaring
Capex skyrocketed 67.2% YoY in 1Q25 to $96.6B, annualizing to $343B, up 65% from a year ago and setting another all-time high.
The AI frenzy, sparked by ChatGPT and fanned by investors, is now a dominant force. GPU spend is through the roof. US webscalers are spending like the proverbial drunken sailor, fueled by subsidies and hype, and enabled by what many view is widespread intellectual property theft.
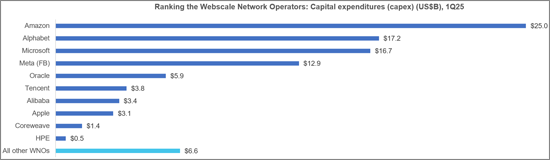
Top 1Q25 capex outlays came from Amazon ($25.0B), Alphabet ($17.2B), Microsoft ($16.7B), and Meta ($12.9B. Together, that is 74% of the total.
Notably, 58% of annualized capex was for IT/network/software infrastructure (vs. 55% in 1Q24, 49% in 1Q23), showing a focus on retrofitting existing data centers for AI.
Profitability: Margins Under Pressure from Capex
Free cash flow margins dipped to 15.2% in 1Q25 (annualized), down from 18.9% a year earlier. Net profit margins averaged a healthy 20.7% over the last four quarters. Alphabet led with $34.5B in net income (+46% YoY), a political liability as antitrust scrutiny intensifies.
Meta, Microsoft, Tencent, and Apple topped the FCF leaderboard.
Amazon and Alibaba were mid-tier, while HPE and Baidu brought up the rear.
Debt vs. cash positions remain solid overall, but some players (Apple, Oracle, IBM, Coreweave) are deeply leveraged and vulnerable if the AI bubble bursts.
Employment: Flat Growth, Automation Looms
Webscale employment hit 4.17M, up just 0.2% YoY. Alibaba's 39% headcount drop (via Sun Art divestment) offset growth elsewhere.
Despite massive AI investment, workforce growth has plateaued since 2021. Automation and robotics are gaining ground, especially in logistics. We expect modest headcount gains in 2025, then a steady decline.
Regional Trends: Asia Rebounds
Asia-Pacific's drag is easing: regional revenue grew 7% YoY in 1Q25, narrowing the gap with global growth (+9%).
The Americas, Europe, and MEA remain in the low double-digit range. With strong government backing, Tencent and Alibaba are poised to accelerate Asia's momentum through 2026.
Research Coverage:
Top 8 WNOs
|
|
|
|
Other WNOs
|
|
|
|
Table of Contents
1. Report highlights
2. Outlook
3. Analysis
4. Key Stats
5. Company Drilldown
6. Company Benchmarking
7. Regional Breakouts
8. Raw Data
9. Exchange Rates
10. About
List of Figures and Charts
- 1. Key Metrics: Growth rates, Annualized 1Q25/1Q24 vs. 2021-24
- 2. WNO Revenues: Single-quarter & annualized (US$M)
- 3. Top 8 WNOs: YoY revenue growth in 1Q25
- 4. Annualized profitability: WNOs
- 5. Free cash flow per employee, 1Q25 annualized (US$)
- 6. FCF Margins vs. Net Margins, 1Q25 annualized
- 7. Advertising revenues as % total (FY2024)
- 8. Annualized capex and R&D spending: WNOs (% revenues)
- 9. WNO capex by type, Annualized: 1Q16-1Q25 (US$M)
- 10. Network & IT capex as share of revenues, 1Q25 annualized
- 11. R&D expenses as % revenues, Top 8 WNOs (1Q25 annualized)
- 12. Acquisition spending vs. capex spending, annualized (US$M)
- 13. Net PP&E per employee (US$' 000) - 1Q25
- 14. Ranking the Webscale Network Operators: Revenues; R&D; Capex; Network & IT capex - 2024 & 1Q25 (US$B)
- 15. Annualized spending share for key webscalers since 2011 Capex: Network, IT and software
- 16. Share of webscale spending by company, 1Q25 and 1Q24 annualized (Capex: Network, IT and software)
- 17. Energy consumption vs. Net PP&E for key webscalers in 2024
- 18. USA: Webscale capex total ($M) and % of global market, 2011-24
- 19. Webscale vs. Telco Market: Annualized Capex (US$B)
- 20. Webscale vs. Telco Market: Annualized capital intensity
- 21. Revenues: annual, single-quarter, and annualized (US$M)
- 22. Profitability (Net Profit; Cash from operations; Free cash flow): annual, single-quarter, and annualized (US$M)
- 23. Spending (R&D; M&A; Capex; Network & IT capex; Lease): annual, single-quarter, and annualized (US$M)
- 24. Cash & Short-term Investments: annual and single-quarter (US$M)
- 25. Debt (Total debt; Net debt): annual and single-quarter (US$M)
- 26. Property, Plant & Equipment: annual and single-quarter (US$M)
- 27. Key Ratios: Net margin; R&D/revenues; Capex/revenues; Network & IT capex/revenues; Free cash flow/revenues; Lease costs/revenues - annual and annualized (%)
- 28. Total employees
- 29. Revenue per employee, annualized (US$K)
- 30. FCF per employee, annualized (US$K)
- 31. Net PP&E per employee, annualized (US$K)
- 32. Revenues & Spending (US$M)
- 33. Revenues (US$M) & YoY revenue growth (%), single-quarter: by company
- 34. Revenues, annualized (US$M): by company
- 35. Annualized profitability margins: by company
- 36. Annualized capex and capital intensity: by company
- 37. Annualized capex and R&D spending as % of revenues: by company
- 38. Share of WNO network & IT capex, Annualized: by company
- 39. Total employees: by company
- 40. Annualized per-employee metrics (US$000s): by company
- 41. Net debt (debt minus cash & stock) (US$M): by company
- 42. Top 10 webscale employers in 1Q25: Global market
- 43. Headcount changes in 1Q25 (YoY %): Global market
- 44. Net PP&E: USA vs. RoW (by company)
- 45. Net PP&E: total in $M and % global webscale market (by company)
- 46. Energy consumption, MWh and % webscale total (by company)
- 47. Share of webscale energy consumption, net PP&E, and capex (by company)
- 48. Energy intensity relative to webscale average and select data center-focused CNNOs (by company)
- 49. Energy intensity in webscale sector, 2024: MWh consumed per $M in revenue
- 50. Capex/revenues (annualized): Company vs. Webscale average
- 51. Revenue per employee (US$000s) (annualized): Company vs. Webscale average
- 52. 2018 vs. 2024: company benchmark by KPI (Revenues, R&D, Net profit, Cash from operations, Capex, Free cash flow, Cash & short-term investments, Net PP&E, Total debt)
- 53. 2018 vs. 2024: company benchmark by key ratio (Capex/revenues; R&D/revenues; Net margin; FCF margin)
- 54. Top 8 WNO's share vs. Rest of the market: by KPI (Revenues, R&D, Net profit, Cash from operations, Capex, Free cash flow, Cash & short-term investments, Net PP&E, Total debt)
- 55. Top 8 WNOs benchmarking by Key ratio: Capex/revenues; R&D/revenues; Net margin; FCF margin)
- 56. Total WNO Market Revenues, by region: Latest CY; Latest Quarter; Annual trend (2011-24); Single quarter (1Q16-1Q25 )
- 57. WNO Market: Revenues, single-quarter (YoY % change)
- 58. Regional revenues by operator: Latest CY; Latest Quarter; Annual trend (2011-24); Single quarter (1Q16-1Q25)
- 59. Top 10 operators by region: Latest CY; Latest Quarter