


|
市场调查报告书
商品编码
1811146
网路规模市场追踪(2025 年第二季):人工智慧热潮推动「醉酒水手」支出,12 个月资本支出达 4,000 亿美元,科技股占比创下 60% 的新高Webscale Market Tracker, 2Q25: AI's Drunken Sailors Push 12-month Capex to $400B, Tech Share Hits All-time High of 60% |
|||||||
NVIDIA 胜出,其他公司则在争夺:随着资料中心连线需求激增,光纤和光缆公司可望获利
虽然云端运算曾推动过以往的网路规模成长,但这一次,投资人对人工智慧的热情才是推动这一成长的动力。遗憾的是,这波成长显然已经持续了几个季度的泡沫,并且存在大幅下滑的巨大下行风险。我们认为,这个市场受到过度炒作和缺乏成熟商业模式的困扰,突然下滑只是时间问题。人工智慧支出的动力完全来自美国政府补贴、公众兴趣(但支付意愿不高)、买家和卖家之间自我强化的循环,以及那些即使不知道具体好处也想抢占先机的人工智慧炒作者。
视觉
网路规模的人工智慧驱动型基础设施扩张持续打破纪录。 2025年第二季度,受访的25家公司营收为7,220亿美元(年增14.1%)。资本支出(CAPEX)达1,220亿美元(年增77.0%),研发支出(R&D)达930亿美元(年增17.8%)。现金持有量为6,290亿美元(年持平),负债为5,670亿美元(年增8.9%)。物业、厂房及设备(净PP&E)飙升至1.111兆美元,较去年同期成长38.9%。员工人数达428万,年增1.2%。
营收:成长集中在四大巨头
2025年第二季度,营收达7,217亿美元(年增14.1%),年化销售额达到2.82兆美元。 Nebius、CoreWeave 和 Yandex 的成长率最高,儘管前两家是新创公司,而第三家受到美元与俄罗斯卢布之间汇率波动的影响。主要成长动力包括亚马逊(营收年增 13.3%,至 1,677 亿美元)、Alphabet(成长 13.8%,至 964 亿美元)、微软(成长 18.1%,至 764 亿美元)、京东(成长 22.5%,至 493 亿美元)及 Meta 成长 22.5%,至 493 亿美元)及 Meta(原 25%)。
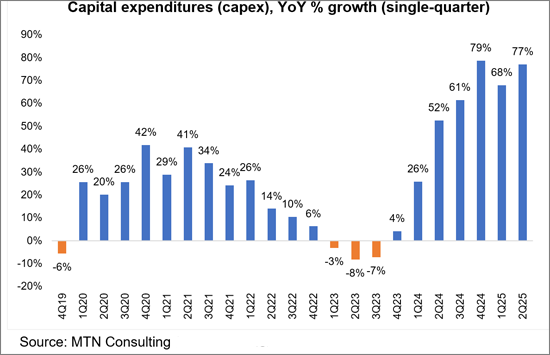
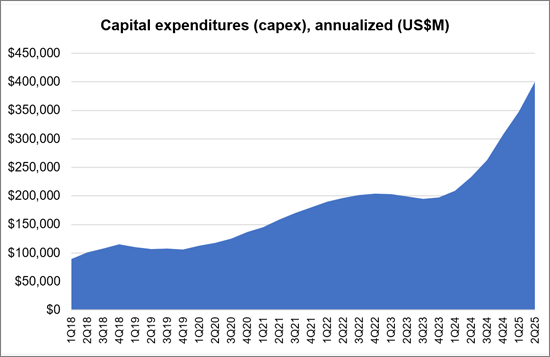
资本支出 (CAPEX):人工智慧热潮推动支出激增
2025 年第二季的资本支出年增 77.0%,至 1,215 亿美元,年化后达到 4,003 亿美元。这比去年同期成长了72%,再创历史新高。
获利能力:资本支出对利润率带来压力
巨额资本支出再次压低自由现金流 (FCF) 利润率,以年率计算降至13.3%。这一数字至少是自2011年以来的第二低,仅略高于2022年第四季13.1%的年率。以单季计算,FCF利润率为11.0%,与2022年第一季持平,成为我们资料库中的最低水准。该行业的公司在支出方面出人意料地鲁莽,儘管投资者迄今为止表示“信心大于恐惧”,但这不仅引发了持怀疑态度的行业分析师的质疑,也让饱受互联网泡沫创伤的投资者感到担忧。
就业:成长趋于平缓,自动化阴影笼罩
网路规模企业员工总数为428万人,较去年成长1.2%。最近的案例是阿里巴巴,由于2025年初的业务分拆,其员工人数大幅下降。截至2025年第二季度,其员工人数为12.37万人,年减38%。相较之下,京东的员工人数正在扩张,到2025年第二季末,其员工人数将达到约62.5万人,较去年同期成长15%。 2025 年第二季度,亚马逊、Meta 和 Alphabet 均实现了温和的同比增长,而微软则保持平稳。
区域趋势:亚洲復苏
亚太地区正逐渐减弱其影响力。最近几个季度,中国市场的疲软拖累了亚洲的全球整体成长,但这种情况现在已经逆转。 2025 年第二季度,全球营收年增 14%,四个地区的成长率与此平均的差距都在几个百分点以内。
涵盖的公司
- 共 25 家公司:21 家活跃且公开上市;其余四家公司处于非活跃状态(ChinaCache)、私有(Twitter)或隶属于其他公司(Altaba 和 LinkedIn)。
- 这 21 家活跃公司分别是:阿里巴巴、Alphabet、亚马逊、苹果、百度、Cognizant、CoreWeave、eBay、富士通、HPE、IBM、京东、快手、Meta (FB)、微软、Nebius、甲骨文、SAP、腾讯、小米、Yandex
- 2025 年第二季新增三家公司:快手、Nebius、小米和 CoreWeave 于 2024 年第四季新增
本报告追踪了全球主要网路公司的活动,并彙编了包括收入、资本支出和员工人数在内的各种数据。
目录
第1章 报告亮点
第2章 展望
第3章 分析
第4章 主要统计
第5章 企业的详细分析
第6章 企业基准
第7章 各地区明细
第8章 原始数据
第9章 汇率
第10章 关于本公司
NVIDIA is cleaning up while everyone else fights for scraps; fiber & optical specialists should cash in as data centers go connection-crazy
Cloud drove previous webscale surges, but investor excitement around artificial intelligence is driving this one. Unfortunately, this latest surge has been firmly in bubble territory for several quarters and there is significant downside risk for a crash. A crash is overdue, in our opinion, as this market is plagued by insane levels of hype but very little in the way of proven business models. AI spend has been propped up by a combination of US government subsidies, mass market consumer interest (but very little willingness to pay), a self-reinforcing loop between buyers and sellers, and AI hypemasters eager to be first - even if they have no idea what benefits this may deliver, if any.
VISUALS
Webscale's AI-driven infrastructure buildout keeps breaking records. In 2Q25, the 25 companies in our Webscale Tracker generated $722 billion (B) in revenue (+14.1% YoY), spent $122B on capex (+77.0%), poured $93B into R&D (+17.8%), and held $629B in cash (flat YoY) against $567B in debt (+8.9%). Net PP&E surged 38.9% YoY to $1.111 trillion. Headcount hit 4.28M (+1.2% YoY).
Notes: (1) This is MTN Consulting's 31st quarterly assessment of the webscale market, part of a series we launched in 4Q17; our data and analysis spans the 1Q11-2Q25 timeframe, i.e. 50 quarters. (2) The 25 companies in our study include several recent additions: CoreWeave (added last year), and this quarter's three new adds: Kuaishou, Nebius (Yandex spinoff), and Xiaomi.
Revenue: Growth Concentrated in the Big Four
2Q25 revenue hit $721.7B (+14.1% YoY), pushing annualized sales to $2.82 trillion (T). Nebius, CoreWeave and Yandex posted the fastest growth, but the first two are new companies and the third is impacted by recent USD-RUB exchange rate fluctuations. The heavy lifting came from Amazon (revenues up 13.3% YoY to $167.7B), Alphabet (+13.8% to $96.4B), Microsoft (+18.1% to $76.4B), JD.Com (+22.5% to $49.3B), and Meta (FB) (+21.6% to $47.5B).
Incidentally, JD.Com may be removed from our database at some point since it has deconsolidated its cloud unit and has no clear plans to reverse this decision. Its energy intensity is relatively high, like other webscalers, but it spends just over 1% of revenues on capex; the company is unlikely to challenge China's leading webscalers with established data center footprints (Alibaba, Tencent, Huawei).
At the other end, two companies saw revenues fall between 2Q24 and 2Q25: Fujitsu, down 2.6% YoY to $5.2B as it exited some European markets; and Baidu, down 3.5% YoY to $4.5B due to a significant drop in advertising revenue. Alibaba's revenues grew only 1.9% YoY to $34.2B, due to recent divestitures of Sun Art and Intime, which lowered Alibaba's revenue base.
Capex: AI Hype Sends Spending Soaring
Capex skyrocketed 77.0% YoY in 2Q25 to $121.5B, annualizing to $400.3B, up 72% from a year ago and setting another all-time high.
The AI frenzy, sparked by ChatGPT and fanned by investors, is now a dominant force. A review of the latest (2Q25) earnings calls from major US-based webscalers and other AI ecosystem players reveals a collective case of heads in the sand as AI infatuation continues. In none of these calls do tech leaders address when their AI investments will pay off. There are no signs of profitability from their early forays. Instead, there's just an emphasis on the need to go as fast as possible to establish an early lead in this race - a race they've defined, hoping it will lead to new riches. Riches for them and their shareholders, not for employees or users, of course. Most companies pass the buck when justifying their capital expenditure surge, claiming they are simply responding to unprecedented demand from clients. Yet those same clients are making the same risky bets, hoping that someone will eventually land on a sustainable business model for generative AI. Does the word "bubble" appear anywhere in any of the 2Q25 earnings calls from the key data center builders? Not from the webscalers. Zero. Nobody dares talk about the elephant in the room.
Top 2Q25 capex outlays came from Amazon ($32.2B), Alphabet ($22.4B), Microsoft ($17.1B), and Meta ($16.5B). Together, that is 73% of the global total.
Notably, 61% of annualized capex was for technical infrastructure (data center compute & networking, power & cooling, fiber & transport/routing gear, etc.) (vs. 55% in 2Q24), showing a focus on retrofitting existing data centers for AI. The 61% is an all-time high on an annualized basis.
Profitability: Margins Under Pressure from Capex
Free cash flow margins dipped again amidst massive capex outflows, down to 13.3% on an annualized basis. This 13.3% figure is the second lowest since at least 2011, just slightly higher than the 13.1% from 4Q22 annualized. The single quarter FCF margin of 11.0% was tied with 1Q22 as the lowest ever in our database. Companies in this sector have been surprisingly reckless in their spending, and investors so far are giving them the benefit of the doubt. But doubts are building, and not just with skeptical industry analysts scarred by the dotcom bubble's wreckage.
Net margins were relatively strong by comparison, averaging 20.8% in the 2Q25 annualized period - which is actually an all-time high since at least 2011. But net profits can be impacted by one-time items, tax windfalls, regulatory decisions, accounting charges or restatements, and other factors. FCF is a much stronger gauge of the market's overall health.
Meta (FB), Tencent, Microsoft and Apple top the FCF leaderboard, with annualized margins well above 20% through 2Q25. IBM, SAP and Alphabet each had around 18% results. The laggards were Oracle and Baidu, both slightly negative.
Debt vs. cash positions are still acceptable; the sector's $629.3B in cash still exceeds its $586.7B in total debt. But the gap (i.e. net debt) has been shrinking for several years. At its peak, the webscale market's cash exceeded debt by $292B in 4Q20, but that is now down to just $43B. That's not a disaster by itself as long as the debt can be financed at reasonable rates. Webscale's big US-based players are no doubt pushing the US president to keep interest rates down. In this way, they are contributing to Trump's lawless attempts to usurp the Fed's status as an independent monetary board. US-based webscale CEOs - Bezos, Zuckerberg, Sundar, Satya and Larry - are all openly engaged in politics and kissing up to the US government. While they justify it as a service to their shareholders, ultimately this distorts markets and may crash the global economy.
Employment: Flat Growth, Automation Looms
Webscale employment hit 4.28M, up 1.2% YoY. The big recent story is Alibaba, whose early 2025 spinoffs caused its headcount to drop dramatically. In 2Q25, its employee total was 123.7K, down 38% YoY. By contrast, JD.Com has been expanding headcount, ending 2Q25 with around 625K employees, up 15% YoY. Amazon, Meta, and Alphabet all grew modestly YoY in 2Q25, while Microsoft stayed flat.
There will be occasional modest swings up in webscale headcount, but automation and robotics are gaining ground, especially in logistics. We expect modest headcount gains in 2025, then a steady decline.
Regional Trends: Asia Rebounds
Asia-Pacific's drag is easing: for a few quarters, a weak Chinese market meant that Asia was a drag on global growth. That has reversed. Global revenues grew 14% YoY in 2Q25, and all four regions saw growth rates within a couple of percentage points of this average.
With strong government backing, Tencent and Alibaba are poised to accelerate Asia's momentum through 2026. Xiaomi also adds support for Asia's growth. It is having export market success with its devices and starting to invest in data centers and AI, with potential for much more to come.
Companies covered:
- 25 in total: 21 active and reporting data publicly, 4 either inactive (ChinaCache), gone private (Twitter), or now part of other companies (Altaba and LinkedIn).
- The 21 active companies include: Alibaba, Alphabet, Amazon, Apple, Baidu, Cognizant, CoreWeave, eBay, Fujitsu, HPE, IBM, JD.COM, Kuaishou, Meta (FB), Microsoft, Nebius, Oracle, SAP, Tencent, Xiaomi, and Yandex
- Three new companies have been added in 2Q25: Kuaishou, Nebius, and Xiaomi. CoreWeave was added in 4Q24.
Table of Contents
1. Report highlights
2. Outlook
3. Analysis
4. Key Stats
5. Company Drilldown
6. Company Benchmarking
7. Regional Breakouts
8. Raw Data
9. Exchange Rates
10. About
List of Figures and Charts
- 1. Key Metrics: Growth rates, Annualized 2Q25/2Q24 vs. 2021-24
- 2. Webscale Revenues: Single-quarter & annualized (US$M)
- 3. Key webscaler revenues: YoY % revenue growth in 2Q25
- 4. Annualized profitability: WNOs
- 5. Free cash flow per employee, 2Q25 annualized (US$)
- 6. Key webscaler free cash flow margins: 2Q25 annualized
- 7. Advertising revenues as % total (FY2024)
- 8. Annualized capex and R&D spending: WNOs (% revenues)
- 9. WNO capex by type, Annualized: 2Q14-2Q25 (US$M)
- 10. Network & IT capex as share of revenues, 2Q25 annualized
- 11. Key webscaler R&D expenses, % revenues: 2Q25 annualized
- 12. Acquisition spending vs. capex spending, annualized (US$M)
- 13. Net PP&E per employee (US$' 000) - 2Q25
- 14. Ranking the Webscale Network Operators: Revenues; R&D; Capex; Network & IT capex - 2024 & 2Q25 (US$B)
- 15. Annualized spending for key webscalers since 2011 Capex: Network, IT and software
- 16. Share of webscale spending by company, 2Q25 and 2Q24 annualized (Capex: Network, IT and software)
- 17. Energy consumption vs. Net PP&E for key webscalers in 2024
- 18. Webscale vs. Telco Market: Annualized Capex (US$B)
- 19. Webscale vs. Telco Market: Annualized capital intensity
- 20. USA: Webscale capex total ($M) and % of global market, 2011-24
- 21. China's webscalers versus the big 4: Capex in 2024 ($B)
- 22. Chinese webscale capex on the rise again ($M)
- 23. Revenues: annual, single-quarter, and annualized (US$M)
- 24. Profitability (Net Profit; Cash from operations; Free cash flow): annual, single-quarter, and annualized (US$M)
- 25. Spending (R&D; M&A; Capex; Network & IT capex; Lease): annual, single-quarter, and annualized (US$M)
- 26. Cash & Short-term Investments: annual and single-quarter (US$M)
- 27. Debt (Total debt; Net debt): annual and single-quarter (US$M)
- 28. Property, Plant & Equipment: annual and single-quarter (US$M)
- 29. Key Ratios: Net margin; R&D/revenues; Capex/revenues; Network & IT capex/revenues; Free cash flow/revenues; Lease costs/revenues - annual and annualized (%)
- 30. Total employees
- 31. Revenue per employee, annualized (US$K)
- 32. FCF per employee, annualized (US$K)
- 33. Net PP&E per employee, annualized (US$K)
- 34. Revenues & Spending (US$M)
- 35. Revenues (US$M) & YoY revenue growth (%), single-quarter: by company
- 36. Revenues, annualized (US$M): by company
- 37. Annualized profitability margins: by company
- 38. Annualized capex and capital intensity: by company
- 39. Annualized capex and R&D spending as % of revenues: by company
- 40. Share of WNO network & IT capex, Annualized: by company
- 41. Total employees: by company
- 42. Annualized per-employee metrics (US$000s): by company
- 43. Net debt (debt minus cash & stock) (US$M): by company
- 44. Top 10 webscale employers in 2Q25: Global market
- 45. Headcount changes in 2Q25 (YoY %): Global market
- 46. Net PP&E: USA vs. RoW (by company)
- 47. Net PP&E: total in $M and % global webscale market (by company)
- 48. Energy consumption, MWh and % webscale total (by company)
- 49. Share of webscale energy consumption, net PP&E, and capex (by company)
- 50. Energy intensity relative to webscale average and select data center-focused CNNOs (by company)
- 51. Energy intensity in webscale sector, 2024: MWh consumed per $M in revenue
- 52. Capex/revenues (annualized): Company vs. Webscale average
- 53. Revenue per employee (US$000s) (annualized): Company vs. Webscale average
- 54. 2018 vs. 2024: company benchmark by KPI (Revenues, R&D, Net profit, Cash from operations, Capex, Free cash flow, Cash & short-term investments, Net PP&E, Total debt)
- 55. 2018 vs. 2024: company benchmark by key ratio (Capex/revenues; R&D/revenues; Net margin; FCF margin)
- 56. Top 8 WNO's share vs. Rest of the market: by KPI (Revenues, R&D, Net profit, Cash from operations, Capex, Free cash flow, Cash & short-term investments, Net PP&E, Total debt)
- 57. Top 8 WNOs benchmarking by Key ratio: Capex/revenues; R&D/revenues; Net margin; FCF margin)
- 58. Total WNO Market Revenues, by region: Latest CY; Latest Quarter; Annual trend (2011-24); Single quarter (2Q16-2Q25 )
- 59. WNO Market: Revenues, single-quarter (YoY % change)
- 60. Regional revenues by operator: Latest CY; Latest Quarter; Annual trend (2011-24); Single quarter (2Q16-2Q25)
- 61. Top 10 operators by region: Latest CY; Latest Quarter