


|
市场调查报告书
商品编码
1881278
能源与永续发展追踪报告 - 电信业者(2025):与 Teral Research 合作进行的最新研究 - 2024 年电信业者的能源消耗量保持稳定,但由于采用再生能源和范围 3 减排措施,温室气体排放量持续下降Energy & Sustainability Tracker - Telcos, 2025: New Joint Study with Teral Research - Telco Energy Use Flatlined in 2024, but GHG Emissions Fell Again Due to Renewables and Scope 3 Efforts |
|||||||
气候变迁正日益成为一个严峻的问题,所有产业都必须应对这项挑战。资讯通信技术 (ICT) 产业也不例外。网路营运商消耗大量能源,碳足迹庞大。虽然 ICT 的成长主要由超大规模企业投资建置用于云端运算和人工智慧的资料中心所驱动,但电信业者面临更大的能源挑战。 2024 年,电信业者的能源消耗量为 340.6 太瓦时 (TWh),即 340,572 吉瓦时 (GWh),是网路规模营运商能源消耗量的两倍多。由于再生能源采用率低,电信业者的碳足迹也高出数倍。电信业者为提升网路营运的永续性所做的努力至关重要。
经济因素也同样重要。电信业者平均将营运支出的 4-5% 用于能源,部分业者的能源支出甚至超过 10%。这些成本的波动性是一个主要问题。自然灾害、战争和贸易限制都会影响碳基能源的价格。气候变迁本身也会因极端天气增加和人口迁移而增加对进口化石燃料的依赖风险。相较之下,本地风能、太阳能和水力发电等再生能源的价格往往更加稳定。因此,向碳中和转型可以稳定电信业者的平均成本模式。
视觉效果
本报告对电信业的能源使用和永续性进行了详细评估。报告分析了66家电信业者的能源消耗、再生能源使用和排放量,这些业者约占全球市场占有率的85%。报告考察了整个全球电信业,并提供了所有公司的能源使用、效率和排放量指标。报告还包含排名,重点介绍了行业领导者、近期取得改进的公司以及落后者(这些落后者通常需要供应商的支持来提高效率和可再生能源组合)。
报告也根据所有66家电信业者的ESG报告,提供了他们的能源使用情况以及范围1和范围2的排放数据。其中 50 家业者揭露了足够的范围 3 数据,从而可以进行价值链分析。此外,32 家公司公布了流量数据,从而可以分析诸如单位能耗传输量等指标。
本分析是 MTN Consulting 为期五年的电信业者能源使用研究的延伸。它基于其专有的电信财务追踪器,该追踪器包含截至 2025 年 6 月的市场数据。本报告补充了新收集的财务数据,包括 2019 年至 2024 年所有 66 家公司的净资产、厂房和设备。
MTN Consulting 与 Teral Research 合作
本报告是 MTN Consulting 与 Teral Research (TR) 合资成立的新服务 "电信能源与永续发展 (TES)" 的首份成果。
目标机构:
|
|
目录
第 1 章概述
第二章分析
第三章全球市场成果
第四章:公司业绩
第五章:排名
第六章:原始资料
第七章:关于我们
Why this report
Climate change is worsening, and every sector must help meet this challenge. The ICT sector is no exception. Within ICT, network operators consume enormous amounts of energy and have a massive carbon footprint. While the growth in ICT comes from webscale operators (aka hyperscalers) investing in data centers for cloud and AI, the telco sector remains a larger energy problem. In 2024, telcos consumed 340.6 Terawatt hours (TWh) of energy, or 340,572 GWh. That's more than double that of webscale. The telco carbon footprint is also multiple times larger, due to a weaker adoption rate of renewables. For the networking business to improve its sustainability, the telco sector needs the most attention.
Economics also matter. Telcos spend an average of 4-5% of their operating expenses on energy, with some spending over 10%. The volatility of these costs is a primary concern. Natural disasters, war, and trade restrictions can all impact the price of carbon-based energy. Climate change itself, by intensifying extreme weather and causing population displacement, will make reliance on imported carbon sources even riskier. In contrast, renewable energy from local wind, solar, or hydro sources tends to have more stable prices. The march toward carbon neutrality could therefore also stabilize the cost model for the average telco.
VISUALS
Report overview
This report provides a detailed assessment of energy usage and sustainability in the telecommunications industry. We analyze energy consumption, renewable use, and emissions for 66 telcos representing about 85% of the global market. We examine the global industry and present metrics on usage, efficiency, and emissions for all companies. The report includes rankings to highlight leaders and recent improvers, as well as laggards, who often need supplier help to boost efficiency and renewability.
For all 66 telcos, we present data on energy use and Scope 1 and 2 emissions, based on their ESG reports. A subset of 50 companies also report enough Scope 3 data to allow for a value chain analysis. A subset of 32 publish traffic data, which lets us analyze traffic carried per unit of energy consumed and similar metrics.
This analysis extends MTN Consulting's research into network operator energy use, which began five years ago. The study relies on our proprietary telco financial tracker, with market data through June 2025. It is supplemented by new financial data gathered for this report, including Net PP&E for all 66 telcos from 2019 to 2024.
Scope and limitations
This report analyzes telecom operators, or telcos. These companies provide access-based services directly to end users, based on ownership of spectrum or regulator-issued licenses. This includes fixed, mobile, cable TV, and satellite providers. Our sample of 66 telcos is large and representative across all regions and segments. We are confident this is the best resource available for tracking energy use in the telco industry.
The telco business model has evolved, but most moves outside the core market have been reversed or failed to scale, as seen with AT&T's acquisition and subsequent spinoff of Time Warner. Some telcos are part of larger corporate groups and own infrastructure beyond telecom networks, like data centers or retail shops. However, almost all energy a telco consumes is tied directly to its network infrastructure, usually 80-90% of the total. For a mobile operator, the RAN alone is often 50-60% or more of total energy use. Data centers typically account for less than 10% of consumption, though this can reach 20-30% and may climb as Telco AI deployments mature.
Our database focuses on pure telcos or the telco division of a larger entity. In a few cases, like Softbank and Comcast, we must use corporate-level energy data because that is all they report. However, we only include financial metrics for their telco operations. Consequently, metrics like energy used per unit of revenue may be slightly overstated for these two companies.
Data and methodology
For the 66 telcos in this report, we present financial metrics alongside energy-related indicators: total energy and electricity consumption, renewable energy share, and greenhouse gas emissions by type. Data covers 2019-2024.
Compiling a consistent dataset was challenging. Unlike financial reporting, energy disclosures lack clear standards. Companies vary widely in what they report, and ESG data are not always audited. We reviewed dozens of sustainability reports, relying on verified data where possible and estimating where necessary to create comparable time series. We believe this is the most objective and comprehensive review of its kind.
Financial data is sourced from our latest Telco Tracker, supplemented with newly collected Net PP&E data. Energy and emissions figures are generally "as reported," but we made estimates in some cases. For instance, some companies do not report full historical Scope 3 data. We have energy and Scope 1-2 data for all 66 telcos. Scope 3 data is available for 50, and traffic data for 32.
A company can claim renewable electricity use when it (1) generates renewable power on-site; (2) purchases renewable electricity from the grid and retains the associated renewable energy certificates (RECs); (3) owns off-site renewable generation and retires the RECs; or (4) signs purchased power agreements (PPAs) with third-party suppliers of green power, and then also transfer the RECs.
When companies update their historical data, we modify our database to reflect this, as updates usually stem from improved methodologies. We do not restate data if it would change the reported scope.
A note on public vs. private companies
In telecom, nearly all major companies are public and now issue some form of ESG report. The quality and transparency vary, but few sizable telcos report no energy data. Our experience in reviewing hundreds of these reports helps us judge data credibility and make necessary estimates.
One caveat: our focus on public companies introduces a small reporting bias. Public companies face greater pressure to use renewables and commit to emissions reductions. The companies we do not track, which are often private, likely have weaker environmental records. Altice Europe and BSNL are examples. There is a minor issue with Scope 3 emissions as well: the companies that do not publish a full set of reliable scope 3 stats may be less environmentally friendly than the average. However, when we estimate global Scope 3 totals, we assume missing companies have the same average footprint as those included. This means we are likely slightly underestimating the telecom industry's environmental problem.
MTN Consulting Partnership with Teral Research
This report is the kickoff product for a new service called Telecom Energy & Sustainability (TES). TES is a collaboration between MTNC and Teral Research (TR).
Organizations covered:
|
|
Table of Contents
1. Overview
2. Analysis
3. Global results
4. Company results
5. Rankings
6. Raw data
7. About
List of Figures and Charts
Global, and for each of 66 companies:
- Revenues ($M) and YoY % growth
- Capex ($M) and Capex/Revenue ratio
- Net PP&E ($M) and YoY % growth
- Capex and Net PP&E growth
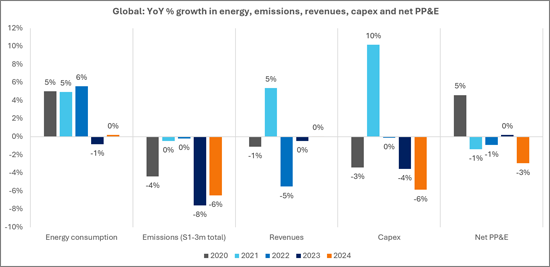
- YoY % growth in energy, emissions, revenues, capex and net PP&E
- Correlation between financial, energy input, and emissions output metrics, 2019-24
- Energy consumption in GWh and electricity's share of total energy, 2019-24
- YoY growth rates in electric use vs. total energy consumption
- Energy intensity vs. electric intensity (MWh per $1M in revenues), 2019-24
- Energy intensity, Net PP&E basis
- Renewable energy consumption in GWh and % total
- Carbon footprint by emissions type (market-based), millions of metric tons of CO2-equivalent
- Market-based vs. location-based carbon footprint (S1-2-3 total), millions of metric tons of CO2-equivalent
- Scope 3 emissions as % of S1-2-3 total, market-based vs. location-based
- Emissions intensity in MT CO2-equivalent per $M of revenue
- Emissions intensity in MT CO2-equivalent per $M of Net PP&E
Additional charts for each company:
- Company vs. global average: Energy intensity in MWh per $M of revenue
- Company vs. global average: Energy intensity in MWh per $M of revenue
- Company vs. global average: S1-S3m emissions intensity in MT CO2-equivalent per $M of revenue
- Company vs. global average: Renewable energy as % total consumption
Individual charts ranking all telcos by the following key metrics that we track:
- Capex ($M)
- Net PP&E ($M)
- Revenues ($M)
- Electricity consumption
- Energy consumption
- Renewable energy consumption (MWh)
- % renewable energy
- Capex/Revenue
- Electric as % total energy
- Scope 3 as % of total S1-3 emissions
- YoY % change in energy consumption
- Electricity intensity (MWh per $M in revenue)
- Energy intensity (MWh per $M in revenue)
- Energy intensity of fixed asset base (MWh per $1M in Net PP&E)
- Revenue from 1MWh electricity used ($)
- Revenue from 1MWh energy used ($)
- Emissions intensity: S1-2m per $M in Net PP&E
- Emissions intensity: S1-2m per $M in revenue
- Emissions intensity: S1-3m per $M in Net PP&E
- Emissions intensity: S1-3m per $M in revenue
- S1
- S2l
- S2m
- S1-2l
- S1-2m
- S3
- S1-3m
 永续发展与能源管理软体市场:2026-2032年全球市场预测(按软体类型、技术、部署模式、应用程式、企业规模和最终用户划分)
 2026年全球永续发展与能源管理软体市场报告能源管理软体市场:按组件、应用、部署类型和最终用户产业划分-2026-2032年全球预测
 日本能源管理软体市场规模、份额、趋势及预测(依软体、解决方案、最终用户产业及地区划分),2026-2034年
 能源管理软体市场-全球产业规模、份额、趋势、机会及预测(按软体、解决方案、最终用户、地区和竞争格局划分,2021-2031年)
 建筑及工业能源管理软体
 按设备类型、安全类型和地区分類的能源网路安全市场
 能源管理软体市场(2025-2029)
 永续能源管理软体市场预测至 2032 年:按组件、部署类型、组织规模、模组、最终用户和地区进行的全球分析
 商业大楼用HVAC最佳化能源管理软体的全球市场 - 市场规模,竞争情形(2024年~2029年)