


 |
市场调查报告书
商品编码
1148665
VSAT及宽频卫星市场:第21版VSAT and Broadband Satellite Markets, 21st Edition |
||||||
报告内容架构
本报告提供全球VSAT及宽频卫星的市场调查,市场概要,运作中的单位,通讯容量需求,各种收益的变化、预测,各种区分、各地区的详细分析,市场成长的各种影响因素分析等彙整资料。
目录
本报告
市场分类
地区定义
摘要整理
第1章 全球概要
- 运作中的单位
- 通讯容量需求、收益
- 服务、设备收益
- 总论
第2章 固定企业VSAT
- 主要市场趋势与全球数值
- 概要
- 通讯容量需求、收益
- 业务收益、CPE趋势
- CPE市场占有率
- 总论
- 北美
- 运作中的单位、通讯容量需求
- 收益、出货趋势
- 主要的报导
- 南美
- 运作中的单位、通讯容量需求
- 收益、出货趋势
- 主要的报导
- 欧洲
- 运作中的单位、通讯容量需求
- 收益、出货趋势
- 主要的报导
- 中东、非洲
- 运作中的单位、通讯容量需求
- 收益、出货趋势
- 主要的报导
- 亚洲
- 运作中的单位、通讯容量需求
- 收益、出货趋势
- 主要的报导
- 旧版的比较
第3章 消费者导向宽频服务
- 主要市场趋势与全球数值
- 用户数
- 通讯容量需求、收益
- 业务收益和CPE趋势
- 市场占有率
- 总论
- 北美
- 用户数、通讯容量需求
- 收益、出货趋势
- 主要的报导
- 南美
- 用户数、通讯容量需求
- 收益、出货趋势
- 主要的报导
- 欧洲
- 用户数、通讯容量需求
- 收益、出货趋势
- 主要的报导
- 中东、非洲
- 用户数、通讯容量需求
- 收益、出货趋势
- 主要的报导
- 亚洲
- 用户数、通讯容量需求
- 收益、出货趋势
- 主要的报导
- 旧版的比较
附录:调查手法
Report Summary:
Satellite Communication market is in the middle of growing turbulence as new entrants and incumbents are evolving multi-directionally at a rapid pace. Increasing Supply, Change in Pricing, Market consolidation, Mixed trends across demand use cases and Regulatory changes are some of the key elements that's impacting the ecosystem and value propositions. NSR's “VSAT and Broadband Satellite Markets, 21st Edition (VBSM21) ”- The longest-running industry analysis of the fixed broadband satellite market - offers a complete view of the evolving demand dynamics across key industry indicators and impact parameters.
NEW in this Edition:
|
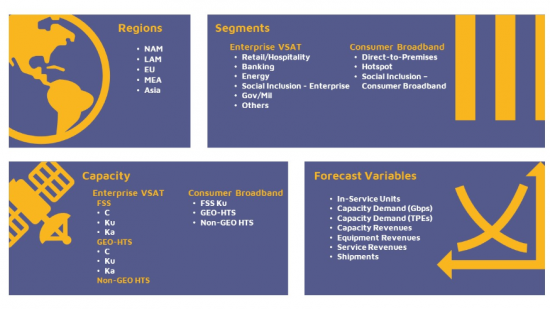
Segmented by user segments, capacities, and regions, “VBSM21” identifies critical growth segments and regions for Satellite operators, Service Providers, Equipment suppliers among fixed VSAT segments, for long term profits & sustainability.
Witnessing mixed trends across applications as some applications witness stagnation whereas some offers untapped massive opportunities, NSR's “VSAT and Broadband Satellite Markets, 21st Edition” details trends, opportunities, developments, and challenges across enterprise and consumer broadband through the next 10 years.
Who Should Purchase this Report:
- Satellite Operators
- VSAT Service Providers
- VSAT Equipment Suppliers
- Enterprises using or looking to use VSAT network
- Investors and Venture Capital companies
Key Features:
Key Questions Answered in the Report:
- New in this Edition- Strategic Imperative and Recommendations
- What is industry opportunity across Enterprise VSAT and Consumer Broadband markets? How are different use cases and regions positioned in terms of demand and revenues?
- What are the top growth drivers and challenges?
- What is NSR's stand on Geo Vs Non-Geo race?
- What is the industry's state in terms of market capture?
Report Segmentation
Companies Included in this Report:
3 Link Communications, ABS Global Ltd. , AT&T, AWS, Acadian Communications, Andesat, Arabsat, ARSAT, Arctic Space Technologies, Avanti Communications, AXESS Networks, Bharti, Bhakti, Benya Group, Belgian Development Agency , Blue Edge, Bristow Group, BT plc, ColinaNet, Cignal TV, COMNET, Comtech, Digicel, DRS Global Enterprise Solutions, Eutelsat, Eurasian satellite service, Free in Senegal, Gilat, Galaxy Broadband, Hughes, Hanwha Systems , Hellas Sat, Intelsat, ISRO, Intellian, Itellum Comunicaciones Costa Rica S.R.L., Indonesian Internet Service Provider PT. Dwi Tunggal Putra (DTP), InterSAT, Jio, Kacific, Katanga, Kymeta, Kuiper, Liquid Telecom, Liquid Intelligent Technologies, Mindset Network, Mubadala Petroleum, Nelco, NBN, NorthWesTEl, Nigerian Communications Commission, Network Services Solutions, NSSL Global, National Company for Telecommunications Services , PT Pasifik Satelit Nusantara, OneWeb, OptimERA, Oracle, Orange, Pacific Dataport, Planet Labs PBC, Rock Networks, Starlink, SES, ST Engineering, SKY Brasil, Ssi Canada, SDT Ingenieria, Speedcast, SpaceBridge, Thaicom, Telesat, Turksat, Trustcomm, Telefonica, Talia, Thales Alenia Space, Viasat, Vodacom Tanzania PLC, WTD Indonesia, Xplornet, and Yahsat.
Table of Contents
About this report
Market Segmentation
Regional Definition
Executive Summary
1. Global Overview
- 1. In-service Units
- 2. Capacity Demand and Revenues
- 3. Service and Equipment Revenues
- 4. Bottom Line
2. Fixed Enterprise VSAT
- 1. Major Market Trends and Global Figures
- 1. Major Market Trends and Global Figures - General Overview
- 2. Major Market Trends and Global Figures - Capacity Demand & Revenues
- 3. Major Market Trends and Global Figures - Service Revenues & CPE Trends
- 4. Major Market Trends and Global Figures - CPE Market Share
- 5. Bottom Line
- 2. North America
- 1. North America - In-service Unit & Capacity Demand
- 2. North America - Revenues and Shipment trends
- 3. North America - Selected Articles
- 3. Latin America
- 1. Latin America - In-service Unit & Capacity Demand
- 2. Latin America - Revenues and Shipment trends
- 3. Latin America - Selected Articles
- 4. Europe
- 1. Europe- In-service Unit & Capacity Demand
- 2. Europe - Revenues and Shipment trends
- 3. Europe - Selected Articles
- 5. Middle East and Africa
- 1. Middle East and Africa- In-service Unit & Capacity Demand
- 2. Middle East and Africa - Revenues and Shipment trends
- 3. Middle East and Africa - Selected Articles
- 6. Asia
- 1. Asia - In-service Unit & Capacity Demand
- 2. Asia - Revenues and Shipment trends
- 3. Asia - Selected Articles
- 7. Comparison with Previous Edition
3. Consumer Broadband
- 1. Major Market Trends and Global Figures
- 1. Major Market Trends and Global Figures - Subscribers
- 2. Major Market Trends and Global Figures - Capacity Demand & Revenues
- 3. Major Market Trends and Global Figures - Service Revenues & CPE Trends
- 4. Major Market Trends and Global Figures - Market Share
- 5. Bottom Line
- 2. North America
- 1. North America - Subscribers & Capacity Demand
- 2. North America - Revenues and Shipment trends
- 3. North America - Selected Articles
- 3. Latin America
- 1. Latin America - Subscribers & Capacity Demand
- 2. Latin America - Revenues and Shipment trends
- 3. Latin America - Selected Articles
- 4. Europe
- 1. Europe - Subscribers & Capacity Demand
- 2. Europe - Revenues and Shipment trends
- 3. Europe - Selected Articles
- 5. Middle East and Africa
- 1. Middle East and Africa- Subscribers & Capacity Demand
- 2. Middle East and Africa - Revenues and Shipment trends
- 3. Middle East and Africa - Selected Articles
- 6. Asia
- 1. Asia - In-service Unit & Capacity Demand
- 2. Asia - Revenues and Shipment trends
- 3. Asia - Selected Articles
- 7. Comparison with Previous Edition
Annex - Research Methodology
List of Exhibits
Executive Summary
- ES-1. VSAT Installed Base
- ES-2. Global Capacity Demand
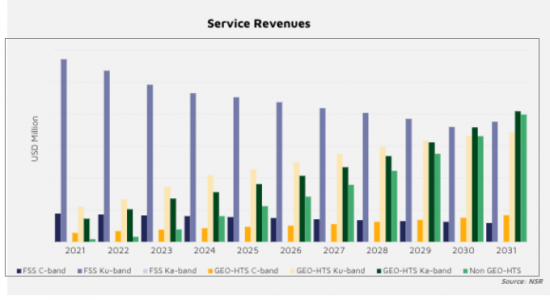
- ES-3. Service Revenues by Region
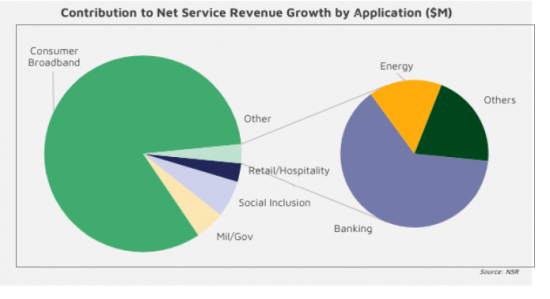
- ES-4. Contribution to Net Service Revenue
- Growth by Application ($M)
1. Global Overview
- 1. Enterprise VSAT Active Sites by Application
- 2. Consumer Broadband Subscribers by Region
- 3. Global Capacity Demand
- 4. Global Capacity Revenues by Region
- 5. Global Service Revenues by Application
- 6. Global CPE Revenues by Region
2. Fixed Enterprise VSAT
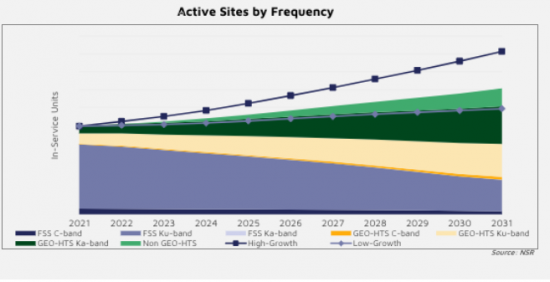
- 1. Global Active Sites by Frequency
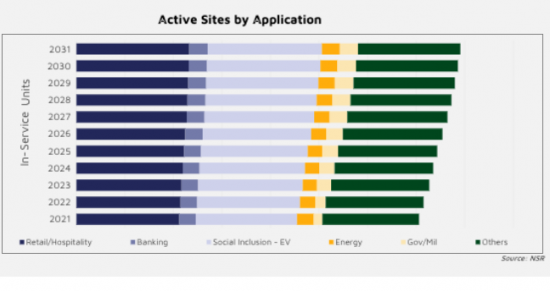
- 2. Global Active Sites by Application
- 3. Global Capacity Demand
- 4. Global Capacity Revenues by Frequency
- 5. Global Capacity Revenues by Region
- 6. Global Service Revenues by Frequency
- 7. Global CPE Shipments by Frequency
- 8. Global Fixed Enterprise VSAT Shipments Market Share
- 9. Global Fixed Enterprise VSAT Revenue Market Share
- 10. Global Comparison with Previous Edition
- 11. NAM Active Sites by Frequency
- 12. NAM Active Sites by Application
- 13. NAM Capacity Demand
- 14. NAM Service Revenues
- 15. NAM Shipment
- 16. NAM CPE Revenues
- 17. LAM Active Sites by Frequency
- 18. LAM Capacity Demand
- 19. LAM Capacity Revenues
- 20. LAM Service Revenues by Application
- 21. LAM Service Revenues by Frequency
- 22. LAM Shipment
- 23. EU Active Sites by Frequency
- 24. EU Active Sites by Application
- 25. EU Capacity Demand
- 26. EU Capacity Revenues
- 27. EU Service Revenues
- 28. EU CPE Shipments
- 29. MEA Active Sites by Frequency
- 30. MEA Active Sites by Application
- 31. MEA Capacity Demand
- 32. MEA Capacity Revenues
- 33. MEA Service Revenues
- 34. MEA CPE Shipments
- 35. Asia Active Sites by Frequency
- 36. Asia Active Sites by Application
- 37. Asia Capacity Demand
- 38. Asia Capacity Revenues
- 39. Asia Service Revenues
- 40. Asia CPE Shipment
3. Comparison with Previous edition
- 1. Global Active Subscribers
- 2. Global Active Subscribers by Access type
- 3. Global Active Subscribers by Region
- 4. Capacity Demand
- 5. Capacity Revenues by Frequency
- 6. Capacity Revenues by Access type
- 7. Service Revenues by Frequency
- 8. CPE Shipment
- 9. Global Broadband Access Market Share
- 10. Global Broadband Access Market Share Modem Vendors
- 11. NAM Active Subscribers
- 12. NAM Active Subscribers by Access type
- 13. NAM Capacity Demand
- 14. NAM Capacity Revenue
- 15. NAM Service Revenue
- 16. NAM Shipments
- 17. LAM Active Subscribers
- 18. LAM Active Subscribers by Access type
- 19. LAM Capacity Demand
- 20. LAM Capacity Revenue
- 21. LAM Service Revenue
- 22. LAM Shipments
- 23. EU Active Subscribers
- 24. EU Active Subscribers by Access type
- 25. EU Capacity Demand
- 26. EU Capacity Revenue
- 27. EU Service Revenue
- 28. EU Shipments
- 29. MEA Active Subscribers
- 30. MEA Active Subscribers by Access type
- 31. MEA Capacity Demand
- 32. MEA Capacity Revenue
- 33. MEA Service Revenue
- 34. MEA Shipments
- 35. Asia Active Subscribers
- 36. Asia Active Subscribers by Access type
- 37. Asia Capacity Demand
- 38. Asia Capacity Revenue
- 39. Asia Service Revenue
- 40. Asia Shipments
Comparison with Previous Edition
 2024-2032 年甚小孔径终端市场报告(依解决方案、平台、频率、最终用途、垂直产业和地区)
 全球企业超小孔径终端 (VSAT) 市场:趋势、预测与竞争分析(截至 2030 年)
 小型卫星地面站(VSAT) 市场 - 全球和区域分析:按应用、频宽、按组件、按类型、按网路架构、按国家 - 分析和预测 (2023-2033)
 微型VSAT全球市场预测(截至2030年)
 VSAT全球市场2023-2027
 面向消费者和企业的卫星宽频:第 22 版
 2023-2030 年全球企业甚小孔径终端机 (VSAT) 系统市场
 VSAT(甚小孔径终端)市场报告:2030 年趋势、预测与竞争分析
 微孔径终端市场:按解决方案、平台、频率、用途和最终用户产业划分 - 2023-2030 年全球预测
 企业VSAT的全球市场:远隔地间连接和分店间通讯的需求提升促进成长