


 |
市场调查报告书
商品编码
1290712
卫星通信容量供需(第20版)Satellite Capacity Supply and Demand, 20th Edition |
||||||
本报告提供卫星通信容量的研究和分析,提供供需预测以及影响市场动态的关键市场发展分析。
报告摘要
该报告是业界最值得信赖、最全面的卫星容量分析来源。 我们拥有良好的业绩记录和无与伦比的专业知识。 该报告提供了有关 13 个主要地区的应用、轨迹、价格和收入潜力的重要见解。
随着行业进入转型期,NGO影响力增强,我们正在走向数据垂直的收入格局,这涉及到商业和财务模式的重大变化。 本报告深入研究了这些转变,分析它们对竞争的影响,识别威胁,发现机会和不断变化的市场动态。 我们的分析是驾驭这一不断变化的形势的宝贵工具,并为取得成功提供了关键考虑因素。
本版包括三个季度更新,提供有关影响市场动态的关键市场发展以及供需预测的最新信息和分析。我们计划对这两个方面提供前瞻性预测。 这包括但不限于: :
- 启动延迟或失败
- 筹款成功或失败
- 大容量产品公告及与客户签订合同
- 价格趋势
- 监管趋势/举措
谁应该购买这份报告
- 卫星运营商
- 服务提供商
- 卫星製造商和发射提供商
- 地面设备製造商和集成商
- 新兴空间公司
- 最终用户
- 创新和产业机构
- 投资社区
- 通信运营商和 MNO
体验 NSR 的不同之处:
本报告以 20 多年的行业专业知识和协作为基础。 该报告对 13 个主要地区的应用、轨迹、价格和收入潜力进行了重要评估。 拥有数以千计的数据供您使用,您可以获得有价值的信息用于业务规划和识别商机。 我们的战略考虑作为克服新参与者(包括超大规模企业)在这个新的竞争格局中带来的挑战的路线图。
主要特点
本报告涵盖的内容
- 按地区、细分市场和日期分类 ExcelDealsTracker 支持供需市场预测
- 全面覆盖卫星通信细分市场
- 常规 FSS 和 GEO HTS 在 C 波段、Ku 波段和宽波束 Ka 波段的容量分析
- 评估 LEO 和 MEO 轨道上改变游戏规则的非 GEO-HTS 容量
- FSS、HTS 和 NGEO-HTS 按地区、行业和频段定价
- 季度更新(三次)突出显示影响供需的主要市场发展
报告类别:
按应用和行业
- 视频
- 交付
- 贡献和场合使用
- 潜孔
- 企业约会
- 回程和中继
- 商业流动性
- 政府/军队
按地区
- 北美
- 拉丁美洲
- 中美洲和加勒比地区
- 南美洲
- 欧洲
- 西欧
- 中欧和东欧
- 中东/非洲
- 中东/北非
- 撒哈拉以南非洲
- 亚洲
- 东亚
- 南亚
- 东南亚
- 大西洋地区
- 太平洋
- 印度洋地区
预测值
市场机会
- 按细分
- 按地区
- 容量
- 容量需求(不包括 MSS)
- 产能收入(不包括 MSS)
- 其他指标
- 市场份额
- 容量价格
内容
执行摘要
区域市场和趋势
- 北美 (NAM)
- 中美洲和加勒比地区 (CAMCB)
- 南美洲 (SAM)
- 西欧 (WEU)
- 中欧和东欧 (CEEU)
- 中东和北非 (MENA)
- 撒哈拉以南非洲 (SSA)
- 东亚 (EA)
- 南亚 (SA)
- 东南亚 (SEA)
- 大西洋地区 (AOR)
- 印度洋地区 (IOR)
- 太平洋地区 (POR)
图表列表
执行摘要
- C、Ku、宽束 Ka 带 TPE 的租赁销售(按应用分类)
- 世界 FSS 商业产能供应
- GEO-HTS 的全球销量
- GEO-HTS 带宽的全球供应
- 租赁非 GEO HTS 带宽的全球收入(按使用情况)
- 全球非 GEO HTS 供应情景
- Reese 在 C 波段、Ku 波段和 Ka 波段 TPE 的全球市场份额(2022 年)
- 租赁 GEO-HTS 容量的全球市场份额(2022 年)
- 2022-32 视频累计销量
- 回程和中继销售
- 企业数据收入
- 2022-32 累计宽带接入销售额
- 流动收入
- 2022-32 对政府/私营公司的累计销售额
区域市场和趋势
北美
- TPE 和总带宽需求
- 总产能供应
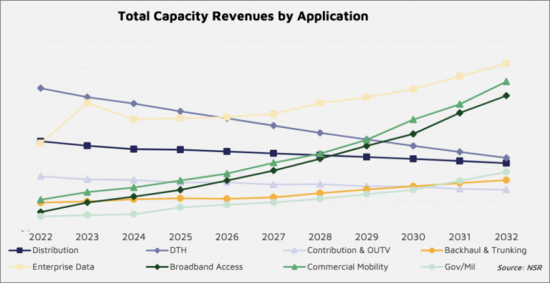
- 按应用划分的总容量收入
- 非 GEO HTS 预测比较
中美洲和加勒比地区
- TPE 和总带宽需求
- FSS 填充因子
- 按应用划分的总容量收入
南美洲
- 总 TPE 和带宽需求
- 按应用划分的总容量收入
- 总产能供应
- Lease 的 C、Ku、Ka 频段 TPE 市场份额(2022 年)
- GEO-HTS 租赁容量的市场份额(2022 年)
西欧
- TPE 和总带宽需求
- 总产能供应
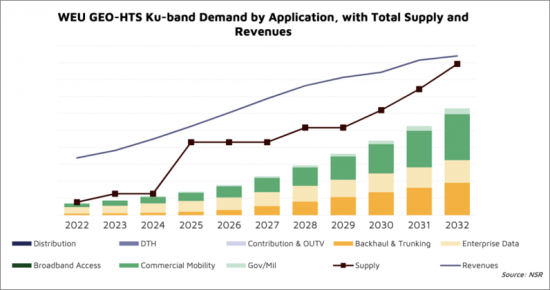
- GEO-HTS Ku 波段应用需求(以及总供应量和总销售额)
- 按应用划分的 GEO-HTS Ka 频段需求(总供应量和总销售额)
- 按应用划分的非地面 HTS 需求(总供应量/总销售额)
中东欧
- TPE 和总带宽需求
- 总产能供应
- 非 GEO HTS 的预测比较
- 按应用划分的总容量收入
- 按频率划分的总收入 (%)
中东和北非
- TPE 和总带宽需求
- 按应用划分的总容量收入
- 总产能供应
- FSS 填充率
- 高温超导填充率
撒哈拉以南非洲
- 总 TPE 和带宽需求
- 总产能供应
- 按应用划分的总容量收入
- GEO-HTS Ku 波段应用需求、总供应量和销售额
- GEO-HTS Ka 波段带宽需求(按应用、总供应和总销售额分类)
- 按应用划分的非土型高温超导的需求变化(总供应量/总收入)
东亚
- 总 TPE 和带宽需求
- 总产能供应
- 按应用划分的总容量收入
南亚
- 总 TPE 和带宽需求
- 按应用划分的总容量收入
- Lease 的 C、Ku、Ka 频段 TPE 市场份额(2022 年)
- GEO-HTS 租赁容量的市场份额(2022 年)
东南亚
- TPE 和总带宽需求
- 总产能供应
- 按应用划分的总容量收入
- GEO-HTS Ku 波段应用需求(总供应量和总销售额)
- 按应用划分的 GEO-HTS Ka 波段需求(总供应量和总销售额)
- 按应用划分的非地面 HTS 需求(基于总供应量和总收入)
大西洋地区
- TPE 和总带宽需求
- 总产能供应
- 按应用划分的总容量收入
印度洋地区
- 总 TPE 和带宽需求
- 总产能供应
- 按应用划分的总容量收入
太平洋
- 总 TPE 和带宽需求
- 总产能供应
- 按应用划分的总容量收入
Report Summary:
NSR's “Satellite Capacity Supply & Demand, 20th Edition (SCSD20) ” is the industry's most trusted and comprehensive source for satellite capacity analysis. With a proven track record of reliability and unmatched expertise, “SCSD20” offers essential insights into applications, orbits, pricing, and revenue potential across 13 core regions.
As the industry undergoes a transformative phase and NGOs gain increasing influence, the revenue landscape is shifting towards data verticals, accompanied by significant changes in business and financial models. “SCSD20” goes in-depth to explore these transformations, examining their competitive impact, identifying threats, uncovering opportunities, and analyzing evolving market dynamics. Our analysis is a valuable tool to navigate this ever-changing landscape and provides key considerations for achieving success.
Included in this Edition are 3 quarterly updates, which will provide fresh information and analysis on key market developments that affect market dynamics and forecast projections both on supply and demand. These could include but are not limited to:
- A launch delay or failure
- Successful or unsuccessful funding rounds
- Large capacity or customer contract announcements
- Price movements
- Regulatory developments/initiatives
Who Should Purchase this Report:
- Satellite Operators
- Service Providers
- Satellite Manufacturers and Launch Providers
- Ground Equipment Manufacturers and Integrators
- Emerging Space Companies
- End Users
- Innovation and Industry Agencies
- Investment Community
- Telco's and MNO's
Experience the NSR Difference:
Built on 20+ years of industry expertise and collaboration, “SCSD20 ” provides key assessments of applications, orbits, pricing, and revenue potential across 13 core regions. With thousands of data points at your disposal, you gain invaluable inputs for business planning and identifying opportunities. Our strategic insights serve as a roadmap, guiding you through the challenges posed by new players, including hyperscalers, in this emerging competitive landscape.
Key Features:
Covered in this Report:
- NEW in this Edition - A separate and exhaustive Deals Tracker in Excel organized by region, segment and date that supports market forecasts for supply and demand.
- Comprehensive coverage of satellite communications market segments
- Analysis of Traditional FSS and GEO HTS capacity in C-band, Ku-band, and Widebeam Ka-band
- Evaluation of game-changing Non-GEO-HTS capacity in LEO and MEO orbits
- Pricing per region, vertical and frequency band on FSS, HTS and NGEO-HTS
- 3 quarterly updates to keep you informed of key market developments affecting supply and demand
Report Segmentation:
APPLICATIONS AND VERTICALS
- Video
- Distribution
- Contribution & Occasional Use
- DTH
- Enterprise Date
- Backhaul & Trunking
- Commercial Mobility
- Government/Military
REGIONS
- North America
- Latin America
- Central America & Caribbean
- South America
- Europe
- Western Europe
- Central & Eastern Europe
- Middle East/Africa
- Middle East/North Africa
- Sub Saharan Africa
- Asia
- East Asia
- South Asia
- Southeast Asia
- Atlantic Ocean Region
- Pacific Ocean Region
- Indian Ocean Region
FORECASTS VARIABLES
Market Opportunity by
- Segment
- Region
- Capacity
- Capacity Demand (Excludes MSS)
- Capacity Revenues (Excludes MSS)
- Other Metrics
- Market Share
- Capacity Pricing
Table of Contents
Executive Summary
Regional Markets & Trends
- North America (NAM)
- Central America and Caribbean (CAMCB)
- South America (SAM)
- Western Europe (WEU)
- Central and Eastern Europe (CEEU)
- Middle East and North Africa (MENA)
- Sub-Saharan Africa (SSA)
- East Asia (EA)
- South Asia (SA)
- Southeast Asia (SEA)
- Atlantic Ocean Region (AOR)
- Indian Ocean Region (IOR)
- Pacific Ocean Region (POR)
List of Exhibits
Executive Summary
- Global Revenues for Leased C-, Ku- & Widebeam Ka-Band TPEs by Application
- Global Commercialized FSS Capacity Supply
- Global Revenue GEO-HTS
- Global GEO-HTS Bandwidth Supply
- Global Revenues for Leased Non-GEO HTS Bandwidth by Application
- Global Non-GEO HTS Supply Scenarios
- Global Market Share of Leased C-, Ku- and Ka-Band TPEs, 2022
- Global Market Share of Leased GEO-HTS Capacity, 2022
- 2022-32 Cumulative Video Revenues (USD Millions)
- Backhaul & Trunking Revenues
- Enterprise Data Revenues
- 2022-32 Cumulative Broadband Access Revenues (USD Millions)
- Mobility Revenues
- 2022-32 Cumulative Gov/Mil Revenues (USD Millions)
Regional Markets and Trends
NAM
- Total TPE & Bandwidth Demand
- Total Capacity Supply
- Total Capacity Revenue by Application
- Non-GEO HTS Forecast Comparison
CAMCB
- Total TPE & Bandwidth Demand
- FSS Fill Rates
- Total Capacity Revenue by Application
SAM
- Total TPE & Bandwidth Demand
- Total Capacity Revenue by Application
- Total Capacity Supply
- Market Share of Leased C, Ku, and Ka-band TPEs, 2022
- Market Share of Leased GEO-HTS Capacity, 2022
WEU
- Total TPE & Bandwidth Demand
- Total Capacity Supply
- GEO-HTS Ku-band Demand by Application, with Total Supply and Revenues
- GEO-HTS Ka-band Demand by Application, with Total Supply and Revenues
- Non-Geo HTS Demand by Application, with Total Supply and Revenues
CEEU
- Total TPE & Bandwidth Demand
- Total Capacity Supply
- Non-GEO HTS Forecast Comparison
- Total Capacity Revenue by Application
- Total Revenues (%) by Frequency
MENA
- Total TPE & Bandwidth Demand
- Total Capacity Revenue by Application
- Total Capacity Supply
- FSS Fill Rates
- HTS Fill Rates
SSA
- Total TPE & Bandwidth Demand
- Total Capacity Supply
- Total Capacity Revenue by Application
- GEO-HTS Ku-band Demand by Application, with Total Supply and Revenues
- GEO-HTS Ka-band Demand by Application, with Total Supply and Revenues
- Non-Geo HTS Demand by Application, with Total Supply and Revenues
EA
- Total TPE & Bandwidth Demand
- Total Capacity Supply
- Total Capacity Revenue by Application
SA
- Total TPE & Bandwidth Demand
- Total Capacity Revenue by Application
- Market Share of Leased C, Ku, and Ka-band TPEs, 2022
- Market Share of Leased GEO-HTS Capacity, 2022
SEA
- Total TPE & Bandwidth Demand
- Total Capacity Supply
- Total Capacity Revenue by Application
- GEO-HTS Ku-band Demand by Application, with Total Supply and Revenues
- GEO-HTS Ka-band Demand by Application, with Total Supply and Revenues
- Non-Geo HTS Demand by Application, with Total Supply and Revenues
AOR
- Total TPE & Bandwidth Demand
- Total Capacity Supply
- Total Capacity Revenue by Application
IOR
- Total TPE & Bandwidth Demand
- Total Capacity Supply
- Total Capacity Revenue by Application
POR
- Total TPE & Bandwidth Demand
- Total Capacity Supply
- Total Capacity Revenue by Application

