


 |
市场调查报告书
商品编码
1616879
药品合约製造市场:按製造产品类型、按原料药类型、按原料药药理活性、按FDF 类型、按剂型、按包装类型、按业务规模、按最终用户、按地区:2035 年之前和世界的行业趋势预测Pharmaceutical Contract Manufacturing Market by Type of Product Manufactured, Type of API, API Potency, Type of FDF, Dosage Form, Type of Packaging Offered, Scale of Operation, End Users and Regions: Industry Trends and Global Forecasts, Till 2035 |
||||||
全球药品合约製造市场规模预计将从目前的 990 亿美元成长到 2035 年的 1,560 亿美元,到 2035 年的预测期间复合年增长率为 4.3%。
药品合约製造市场有望显着成长,这主要是由于对产品推向市场的效率和灵活性的需求所推动的。营运专业知识、先进设备和专业设施等因素正在推动营运外包的兴起。值得注意的是,透过将製造业务外包给全球CMO和CDMO,企业可以实现供应链多元化,并降低与政治和经济不确定性相关的风险。此外,自动化、连续製造和数据分析等先进技术的整合提高了生产能力并确保了高品质的结果。在快速发展的製药行业中,合约製药製造商拥有应对复杂监管环境、优化製造工作流程以及支持从临床试验到商业规模製造的无缝过渡的专业知识。上述因素可能会在预测期内为合约服务提供者带来有利的市场成长机会。
本报告调查了全球药品合约製造市场,并提供了市场概况,以及按製造产品类型、原料药类型、原料药药理活性、FDF 类型、剂型和包装类型进行的细分。最终用户、地区和进入市场的公司概况提供趋势。
目录
第一章前言
第二章研究方法
第 3 章经济与其他专案特定考量
第 4 章执行摘要
第 5 章简介
第 6 章药品合约生产:监管状况
第七章药品合约生产:市场状况
第 8 章区域能力
第九章公司简介
第 10 章简介
第 11 章製造与采购的决策架构
第十二章併购
第 13 章近期扩展
第14章能力分析
第十五章需求分析
第 16 章市场影响分析:推动因素、阻碍因素、机会、挑战
第十七章全球药品合约製造市场
第十八章药品合约製造市场(依製造产品类型)
第十九章医药 API 合约製造市场(依 API 类型)
第20章医药API合约生产市场(以API药理活性)
第21章医药FDF合约製造市场(依FDF类型)
第22章医药FDF合约製造市场(以剂型)
第23章药品合约製造市场(依包装类型)
第 24 章药品合约製造市场(按最终用户)
第25章药品合约製造市场(依业务规模)
第26章药品合约生产市场(依主要地区)
第27章药品合约製造市场(主要公司)
第28章案例研究:小分子药物与高分子药物/疗法的比较
第29章结论
第 30 章高阶主管见解
- 章节概述
- Ajinomoto Althea
- Bachem
- CiVentiChem
- CordenPharma
- Helsinn Group
- Novasep
- Sovereign Pharma
- Wavelength Pharmaceuticals
第 31 章附录一:表格资料
第32章附录二:公司与组织名单
PHARMACEUTICAL CONTRACT MANUFACTURING MARKET: OVERVIEW
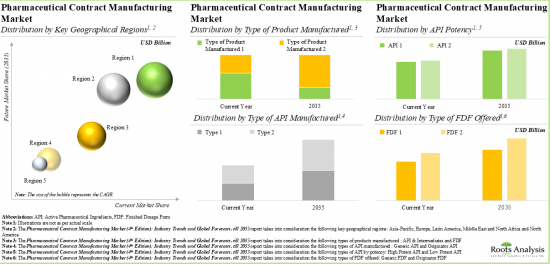
As per Roots Analysis, the global pharmaceutical contract manufacturing market is estimated to grow from USD 99 billion in the current year to USD 156 billion by 2035, at a CAGR of 4.3% during the forecast period, till 2035.
The market sizing and opportunity analysis has been segmented across the following parameters:
Type of Product Manufactured
- API & Intermediates
- FDF
Type of API
- Originator API
- Generic API
API Potency
- Low Potent API
- High Potent API
Type of FDF
- Originator FDF
- Generic FDF
Dosage Form
- Oral Solids
- Liquids
- Emulsions
- Other Dosage Forms
Type of Packaging Offered
- Bottles
- Blisters
- Parenteral
- Others
Scale of Operation
- Clinical
- Commercial
Type of End-user
- Small Companies
- Mid-sized Companies
- Large and Very Large Companies
Key Geographical Regions
- North America
- Europe
- Asia-Pacific
- Latin America
PHARMACEUTICAL CONTRACT MANUFACTURING MARKET: GROWTH AND TRENDS
The pharmaceutical contract manufacturing market is poised for significant growth, primarily driven by the demand for efficiency and flexibility in bringing products to the market. Factors such as operational expertise, advanced equipment and specialized facilities have led to an increase in outsourcing operations. It is worth highlighting that by outsourcing manufacturing operations to CMOs and CDMOs with a global footprint, companies can diversify their supply chains and reduce risks associated with political and economic uncertainties. Moreover, the integration of advanced technologies, such as automation, continuous manufacturing and data analytics, boosts production capabilities and ensures high-quality outcomes. With the rapidly evolving pharmaceutical landscape, contract manufacturers bring expertise in navigating complex regulatory frameworks, optimizing production workflows, and supporting a seamless transition from clinical studies to commercial scale manufacturing. The aforementioned factors are likely to present lucrative market growth opportunities for contract service providers during the forecast period.
PHARMACEUTICAL CONTRACT MANUFACTURING MARKET: KEY INSIGHTS
The report delves into the current state of the pharmaceutical contract manufacturing market and identifies potential growth opportunities within the industry. Some key findings from the report include:
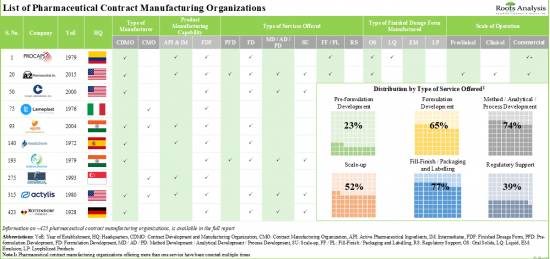
1. Presently, close to 425 organizations offer pharmaceutical contract manufacturing services; of these, majority of the CMOs provide fill-finish / packaging and labelling services.
2. A relatively larger proportion of CMOs manufacture FDFs; close to 15% of the players have the required capabilities to manufacture all types of finished dosage forms.
3. In pursuit of building a competitive edge and to establish themselves as one-stop shops, stakeholders are actively consolidating their capabilities related to small molecule manufacturing through mergers and acquisitions.
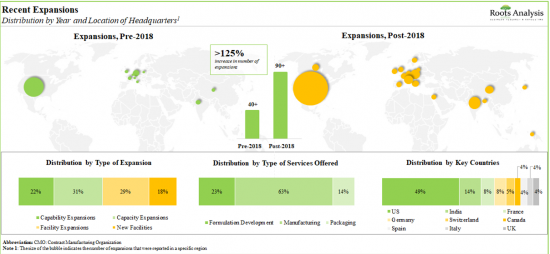
4. In order to meet the rising demand for APIs and finished products, CMOs have made elaborate investments in expanding their existing capacities and capabilities; this trend is most pronounced in the US and India.
5. The global pharmaceutical contract manufacturing capacity is well distributed across different facilities worldwide; notably, large and very large players account for 80% of the total capacity.
6. Owing to the increase in outsourcing activity for small molecule manufacturing operations, the demand for pharmaceutical contract manufacturing is anticipated to rise significantly over the decade.
7. In the past decade, a shift in trend has been observed in the pharmaceutical contract manufacturing industry as more players have set up their manufacturing facilities in developing regions across Asia-Pacific.
8. Driven by the increasing pace of expansions and mergers between the stakeholders in this domain, the market for pharmaceutical contract manufacturing is poised to witness steady growth in the foreseeable future.
9. The pharmaceutical contract manufacturing market is anticipated to grow at a steady rate, till 2035; North America is expected to capture the majority share (over 35%) of the market by 2035.
10. In the long term, small and mid-sized companies are likely to drive the growth of the pharmaceutical contract manufacturing market; oral solids is expected to capture the majority share (~50%) by 2035.
PHARMACEUTICAL CONTRACT MANUFACTURING MARKET: KEY SEGMENTS
FDF segment is Likely to Dominate the Pharmaceutical Contract Manufacturing Market During the Forecast Period
Based on the type of product manufactured, the market is segmented into API & Intermediates and FDF. It is worth highlighting that majority of the current pharmaceutical contract manufacturing market is captured by the FDF segment and this trend is likely to remain the same in the forthcoming years. This can be attributed to the growing demand for ready-to-make products, high value addition and stringent regulatory guidelines.
Currently, Generic and Originator APIs Hold Similar Market Share of the Pharmaceutical Contract Manufacturing Market
Based on the type of APIs, the market is segmented into generic API and originator API. It is worth highlighting that, at present, both generic and originator APIs capture almost similar market share in the pharmaceutical contract manufacturing market. This can be attributed to competitive pricing and quality standards maintained by generic manufacturers. It is worth noting that there is continued demand for branded drugs from originator companies.
High Potent API Segment is the Fastest Growing Segment of the Pharmaceutical Contract Manufacturing Market
Based on the types of API by potency, the market is segmented into low potent API and high potent API. Owing to their enhanced efficacy, lower dosage requirements and increasing demand for targeted therapies, the highly potent API (HPAPI) market is likely to grow at a relatively higher CAGR.
Currently, Originator FDF Occupies the Largest Share of the Pharmaceutical Contract Manufacturing Market
Based on the type of FDFs, the market is segmented into generic FDF and originator FDF. Owing to brand loyalty, ongoing investments in research and development, and established market presence, the originator FDF holds the maximum share within the pharmaceutical contract manufacturing market.
Liquid Dosage Form is the Fastest Growing Segment of the Pharmaceutical Contract Manufacturing Market
Based on the dosage forms, the market is segmented into oral solids, liquids, emulsions and others. It is worth highlighting that, due to the simplicity of administration, growing applications in pediatric and geriatric populations and enhanced patient adherence, liquids are likely to grow at a higher CAGR in the forthcoming years.
Currently, Bottles Occupy the Largest Share of the Pharmaceutical Contract Manufacturing Market
Based on the type of packaging offered, the market is segmented into bottles, blisters, parenterals and others. It is worth highlighting that, at present, bottles hold the maximum share within the pharmaceutical contract manufacturing market. Bottles offer various advantages, such as cost-effectiveness, versatility and capability to accommodate various types of formulations and dosages.
By Scale of Operation, Commercial Scale is Likely to Dominate the Pharmaceutical Contract Manufacturing Market
Based on the scale of operation, the market is segmented into clinical and commercial scale. Whilst commercial scale manufacturing will be the primary driver of the overall market, it is worth highlighting that the pharmaceutical contract manufacturing market at the clinical scale is likely to grow at a relatively higher CAGR.
Small Companies Account for the Largest Share of the Pharmaceutical Contract Manufacturing Market
Based on the type of end-user, the market is segmented into small, mid-sized, and large and very large companies. It is worth highlighting that, at present, small companies capture the highest share within the pharmaceutical manufacturing market. This trend is unlikely to change in the near future.
North America Accounts for the Largest Share of the Market
Based on key geographical regions, the market is segmented into North America, Europe, Asia-Pacific, Middle East and North Africa, and Latin America. Majority share is expected to be captured by contract manufacturers based in North America. It is worth highlighting that over the years, the market for Asia-Pacific is expected to grow at a higher CAGR.
Example Players in the Pharmaceutical Contract Manufacturing Market
- AMRI Global
- Altasciences
- Cambrex
- Catalent
- DPT Laboratories
- Aenova
- Almac
- Corden Pharma
- Fresenius Kabi
- Glatt
- Hovione
- Recipharm
- Siegfried
- CMIC Group
- Nectar Lifesciences
- Syngene
- WuXi AppTec
Primary Research Overview
The opinions and insights presented in this study were influenced by discussions conducted with multiple stakeholders. The research report features detailed transcripts of interviews held with the following industry stakeholders:
- Former Director of Business Development, Ajinomoto Althea
- Former Chief Executive Officer, Bachem
- President and Chief Executive Officer, CiVentiChem
- Digitalization and Artificial Intelligence Manager, CordenPharma
- Former Director, Commercial Development, Helsinn Group
- Former Director, Pharmaceuticals Marketing, Novasep
- Director, Operations, Sovereign Pharma
- Former Vice President Business Development, Marketing, and IP, Wavelength Pharmaceuticals
PHARMACEUTICAL CONTRACT MANUFACTURING MARKET: RESEARCH COVERAGE
- Market Sizing and Opportunity Analysis: The report features an in-depth analysis of the pharmaceutical contract manufacturing market, focusing on key market segments, including [A] type of product manufactured, [B] type of API, [C] API potency, [D] type of FDF, [E] dosage form, [F] type of packaging offered, [G] scale of operation, [H] end users and [I] key geographical regions.
- Regulatory Landscape: A discussion on general regulatory guidelines across different countries, featuring an elaborative assessment of various CMOs in the pharmaceutical contract manufacturing industry, along with information on their operational approvals, certifications received, and relative popularity of the key regulatory body. In addition, the chapter features an insightful multi-dimensional bubble analysis, presenting a comparison of the current regulatory scenario in key geographies.
- Market Landscape: A comprehensive evaluation of companies involved in contract manufacturing of small molecules, considering various parameters, such as [A] year of establishment, [B] company size, [C] location of headquarters, [D] location of manufacturing facility, [E] type of manufacturer, [F] type of services offered, [G] type of finished dosage form manufactured, [H] type of packaging offered and [I] scale of operation.
- Regional Capability Analysis: A detailed analysis of the capabilities of pharmaceutical contract manufacturing facilities in different regions (North America, Europe, Asia-Pacific and the Rest of the World) across the globe.
- Company Profiles: In-depth profiles of key industry players in pharmaceutical contract manufacturing market, focusing on [A] company overviews, [B] manufacturing portfolio, [C] financial information, [D] recent developments and [E] an informed future outlook.
- Additional Insights: An insightful framework that emphasizes the key indicators and factors that need to be considered by pharmaceutical drug developers to determine whether to manufacture their respective products in-house or outsource the manufacturing operation to contract service providers.
- Merger and Acquisitions: A comprehensive examination of the various mergers and acquisitions, focusing on multiple relevant parameters, including [A] year of agreement, [B] type of agreement, [C] key value drivers of the deal, [D] most active players (in terms of number of agreements signed) and [E] geographical location of the companies. In addition, the chapter provides information on the financial terms of the deals (if available) in order to enumerate the deal multiples (in terms of annual revenues of the acquired firm (at the time of acquisition) and years of experience in this domain).
- Acquisitions: An analysis of acquisitions has taken place in the pharmaceutical contract manufacturing domain, since 2017.
- Capacity Analysis: Estimation of global pharmaceutical manufacturing capacity, derived from data provided by various stakeholders in the public domain. This analysis emphasizes the distribution of the available capacity on the basis of [A] company size and [B] key geographical regions.
- Demand Analysis: Informed estimates of the annual commercial and clinical demand for small molecule drugs across key geographical regions.
- Market Impact Analysis: The report analyzes various factors such as drivers, restraints, opportunities, and challenges affecting market growth.
KEY QUESTIONS ANSWERED IN THIS REPORT
- How many companies are currently engaged in this market?
- Which are the leading companies in this market?
- What is the current global demand for small molecules?
- What percentage of the pharmaceutical manufacturing operations are presently outsourced?
- What factors are likely to influence the evolution of this market?
- What is the current and future market size?
- What is the CAGR of this market?
- How is the current and future market opportunity likely to be distributed across key market segments?
REASONS TO BUY THIS REPORT
- The report provides a comprehensive market analysis, offering detailed revenue projections of the overall market and its specific sub-segments. This information is valuable to both established market leaders and emerging entrants.
- Stakeholders can leverage the report to gain a deeper understanding of the competitive dynamics within the market. By analyzing the competitive landscape, businesses can make informed decisions to optimize their market positioning and develop effective go-to-market strategies.
- The report offers stakeholders a comprehensive overview of the market, including key drivers, barriers, opportunities, and challenges. This information empowers stakeholders to stay abreast of market trends and make data-driven decisions to capitalize on growth prospects.
ADDITIONAL BENEFITS
- Complimentary PPT Insights Packs
- Complimentary Excel Data Packs for all Analytical Modules in the Report
- 10% Free Content Customization
- Detailed Report Walkthrough Session with Research Team
- Free Updated report if the report is 6-12 months old or older
TABLE OF CONTENTS
1. PREFACE
- 1.1. Introduction
- 1.2. Market Share Insights
- 1.3. Key Market Insights
- 1.4. Report Coverage
- 1.5. Key Questions Answered
- 1.6. Chapter Outlines
2. RESEARCH METHODOLOGY
- 2.1. Chapter Overview
- 2.2. Research Assumptions
- 2.3. Project Methodology
- 2.4. Forecast Methodology
- 2.5. Robust Quality Control
- 2.6. Key Considerations
- 2.6.1. Demographics
- 2.6.2. Economic Factors
- 2.6.3. Government Regulations
- 2.6.4. Supply Chain
- 2.6.5. COVID Impact / Related Factors
- 2.6.6. Market Access
- 2.6.7. Healthcare Policies
- 2.6.8. Industry Consolidation
- 2.7. Key Market Segmentations
3. ECONOMIC AND OTHER PROJECT SPECIFIC CONSIDERATIONS
- 3.1. Chapter Overview
- 3.2. Market Dynamics
- 3.2.1. Time Period
- 3.2.1.1. Historical Trends
- 3.2.1.2. Current and Forecasted Estimates
- 3.2.2. Currency Coverage
- 3.2.2.1. Overview of Major Currencies Affecting the Market
- 3.2.2.2. Impact of Currency Fluctuations on the Industry
- 3.2.3. Foreign Exchange Impact
- 3.2.3.1. Evaluation of Foreign Exchange Rates and Their Impact on Market
- 3.2.3.2. Strategies for Mitigating Foreign Exchange Risk
- 3.2.4. Recession
- 3.2.4.1. Historical Analysis of Past Recessions and Lessons Learnt
- 3.2.4.2. Assessment of Current Economic Conditions and Potential Impact on the Market
- 3.2.5. Inflation
- 3.2.5.1. Measurement and Analysis of Inflationary Pressures in the Economy
- 3.2.5.2. Potential Impact of Inflation on the Market Evolution
- 3.2.1. Time Period
4. EXECUTIVE SUMMARY
5. INTRODUCTION
- 5.1. Chapter Overview
- 5.2. Types of Third-party Manufacturers
- 5.3. Overview of Pharmaceutical Contract Manufacturing
- 5.4. Evolution of Pharmaceutical Contract Manufacturing
- 5.4.1. Traditional Pharmaceutical CMOs
- 5.4.2. Modern Pharmaceutical CMOs
- 5.5. Need for Outsourcing in the Pharmaceutical Industry
- 5.6. Services Offered by CMOs
- 5.7. Key Considerations While Selecting a CMO
- 5.8. Risks and Challenges Associated with Outsourcing Pharmaceutical Manufacturing Operations
- 5.9. Recent Developments in the Pharmaceutical Contract Manufacturing Industry
- 5.9.1. Integration of Artificial Intelligence
- 5.9.2. Strategic Partnerships and Collaborations
- 5.9.2.1. Strategic Long-Term Alliance
- 5.9.2.2. Flexible Short-Term Partnership Agreements
- 5.9.3. Integrated End-to-End Business Model
- 5.9.4. Dependence on Software Service Providers
- 5.10. Future Perspectives
6. PHARMACEUTICAL CMOs: REGULATORY LANDSCAPE
- 6.1. Chapter Overview
- 6.2. Regulatory Guidelines in North America
- 6.2.1. Landscape in the US
- 6.2.2. Landscape in Canadian
- 6.3. Regulatory Guidelines in Europe
- 6.4. Regulatory Guidelines in Asia-Pacific and Rest of the World
- 6.4.1. Landscape in China
- 6.4.2. Landscape in India
- 6.4.3. Landscape in Japan
- 6.4.4. Landscape in South Korea
- 6.4.5 Landscape in Australia
- 6.4.6. Landscape in Brazil
- 6.5. Analysis of Pharmaceutical CMOs by Approval Received from Regulatory Authorities
- 6.6. Regulatory Landscape: Regional Benchmarking Analysis
7. PHARMACEUTICAL CMOs: MARKET LANDSCAPE
- 7.1. Chapter Overview
- 7.2. Pharmaceutical CMOs: List of Companies
- 7.2.1. Analysis by Year of Establishment
- 7.2.2. Analysis by Company Size
- 7.2.3. Analysis by Location of Headquarters
- 7.2.4. Analysis by Location of Manufacturing Facility
- 7.2.5. Analysis by Product Manufacturing Capability
- 7.2.6. Analysis by Type of Product Manufactured
- 7.2.7. Analysis by Type of Service Offered
- 7.2.8. Analysis by Type of Finished Dosage Form Manufactured
- 7.2.9. Analysis by Type of Packaging Offered
- 7.2.10. Analysis by Scale of Operation
8. REGIONAL CAPABILITY
- 8.1. Chapter Overview
- 8.2. Key Assumptions and Methodology
- 8.3. Overall Landscape of Pharmaceutical Contract Manufacturing Facilities
- 8.3.1. Pharmaceutical Contract Manufacturing Facilities in North America
- 8.3.2. Pharmaceutical Contract Manufacturing Facilities in Europe
- 8.3.3. Pharmaceutical Contract Manufacturing Facilities in Asia-Pacific
- 8.3.4. Pharmaceutical Contract Manufacturing Facilities in Rest of the World
9. COMPANY PROFILES
- 9.1. Chapter Overview
- 9.2. Pharmaceutical CMOs based in North America
- 9.2.1. AMRI Global
- 9.2.1.1. Company Overview
- 9.2.1.2. Service Portfolio
- 9.2.1.3. Recent Developments and Future Outlook
- 9.2.2. Altasciences
- 9.2.2.1. Company Overview
- 9.2.2.2. Service Portfolio
- 9.2.2.3. Recent Developments and Future Outlook
- 9.2.3. Cambrex
- 9.2.3.1. Company Overview
- 9.2.3.2. Service Portfolio
- 9.2.3.3. Recent Developments and Future Outlook
- 9.2.4. Catalent
- 9.2.4.1. Company Overview
- 9.2.4.2. Financial Information
- 9.2.4.3. Service Portfolio
- 9.2.4.4. Recent Developments and Future Outlook
- 9.2.5. DPT Laboratories
- 9.2.5.1. Company Overview
- 9.2.5.2. Service Portfolio
- 9.2.5.3. Recent Developments and Future Outlook
- 9.2.1. AMRI Global
- 9.3. Pharmaceutical CMOs based in Europe
- 9.3.1. Aenova
- 9.3.1.1. Company Overview
- 9.3.1.2. Financial Information
- 9.3.1.3. Service Portfolio
- 9.3.1.4. Recent Developments and Future Outlook
- 9.3.2. Almac
- 9.3.2.1. Company Overview
- 9.3.2.2. Financial Information
- 9.3.2.3. Service Portfolio
- 9.3.2.4. Recent Developments and Future Outlook
- 9.3.3. CordenPharma
- 9.3.3.1. Company Overview
- 9.3.3.2. Service Portfolio
- 9.3.3.3. Recent Developments and Future Outlook
- 9.3.4. Fresenius Kabi
- 9.3.4.1. Company Overview
- 9.3.4.2. Financial Information
- 9.3.4.3. Service Portfolio
- 9.3.4.4. Recent Developments and Future Outlook
- 9.3.5. Glatt
- 9.3.5.1. Company Overview
- 9.3.5.2. Service Portfolio
- 9.3.5.3. Recent Developments and Future Outlook
- 9.3.6. Hovione
- 9.3.6.1. Company Overview
- 9.3.6.2. Service Portfolio
- 9.3.6.3. Recent Developments and Future Outlook
- 9.3.7. Recipharm
- 9.3.7.1. Company Overview
- 9.3.7.2. Financial Information
- 9.3.7.3. Service Portfolio
- 9.3.7.4. Recent Developments and Future Outlook
- 9.3.8. Siegfried
- 9.3.8.1. Company Overview
- 9.3.8.2. Financial Information
- 9.3.8.3. Service Portfolio
- 9.3.8.4. Recent Developments and Future Outlook
- 9.3.1. Aenova
- 9.4. Pharmaceutical CMOs based in Asia-Pacific and Rest of the World
- 9.4.1. CMIC Group
- 9.4.1.1. Company Overview
- 9.4.1.2. Financial Information
- 9.4.1.3. Service Portfolio
- 9.4.1.4. Recent Developments and Future Outlook
- 9.4.2. Nectar Lifesciences
- 9.4.2.1. Company Overview
- 9.4.2.2. Financial Information
- 9.4.2.3. Service Portfolio
- 9.4.2.4. Recent Developments and Future Outlook
- 9.4.3. Syngene
- 9.4.3.1. Company Overview
- 9.4.3.2. Financial Information
- 9.4.3.3. Service Portfolio
- 9.4.3.4. Recent Developments and Future Outlook
- 9.4.4. WuXi AppTec
- 9.4.4.1. Company Overview
- 9.4.4.2. Financial Information
- 9.4.4.3. Service Portfolio
- 9.4.1.4. Recent Developments and Future Outlook
- 9.4.1. CMIC Group
10. SHORT PROFILES
- 10.1. Chapter Overview
- 10.2. Players based in North America
- 10.2.1. Albemarle
- 10.2.2. Baxter
- 10.2.3. Patheon
- 10.2.4. West Pharmaceutical Services
- 10.3. Players based in Europe
- 10.3.1. Eurofins Scientific
- 10.3.2. Evonik
- 10.3.3. Fareva
- 10.3.4. GlaxoSmithKline
- 10.3.5. Lonza
- 10.4. Players based in Asia-Pacific and Rest of the World
- 10.4.1. Alkem Laboratories
- 10.4.2. Aspen Pharmacare
- 10.4.3. MSN Laboratories
- 10.4.4. Teva Pharmaceuticals
- 10.4.5. UBE Corporation
11. MAKE VERSUS BUY DECISION FRAMEWORK
- 11.1. Chapter Overview
- 11.2. Assumptions and Key Parameters
- 11.3. Pharmaceutical Contract Manufacturers: Make versus Buy Decision Making
- 11.3.1. Scenario 1
- 11.3.2. Scenario 2
- 11.3.3. Scenario 3
- 11.3.4. Scenario 4
- 11.4. Concluding Remarks
12. MERGERS AND ACQUISITIONS
- 12.1. Chapter Overview
- 12.2. Merger and Acquisition Models
- 12.3. Pharmaceutical Contract Manufacturing: Mergers and Acquisitions
- 12.3.1. Analysis by Year of Agreement
- 12.3.2. Analysis by Type of Agreement
- 12.3.3. Analysis by Type of Acquisition
- 12.3.4. Analysis by Focus Area
- 12.3.5. Analysis by Type of Business Segment
- 12.3.6. Analysis by Type of Service Offered
- 12.3.7. Analysis by Scale of Operation
- 12.3.8. Analysis by Geography
- 12.3.9. Analysis by Location of Manufacturing Facility
- 12.3.10. Analysis by Key Value Drivers
- 12.3.11. Analysis by Year of Acquisition and Key Value Drivers
- 12.3.12. Most Active Acquirers: Analysis by Number of Acquisitions
- 12.4. Key Acquisitions: Analysis by Deal Multiples
13. RECENT EXPANSIONS
- 13.1. Chapter Overview
- 13.2. Type of Expansions
- 13.2. Pharmaceutical CMOs: Recent Expansions
- 13.2.1. Analysis by Year of Expansion
- 13.2.2. Analysis by Type of Expansion
- 13.2.3. Analysis by Purpose of Expansion
- 13.2.4. Analysis by Year and Purpose of Expansion
- 13.2.5. Analysis by Type of Business Segment
- 13.2.6. Analysis by Type of API Manufactured
- 13.2.7. Analysis by Type of Service Offered
- 13.2.8. Analysis by Scale of Operation
- 13.2.9. Analysis by Capital Invested
- 13.2.10. Analysis by Location of Headquarters
- 13.2.11. Analysis by Location of Manufacturing Facility
- 13.2.12. Most Active Players: Analysis by Number of Recent Expansions
14. CAPACITY ANALYSIS
- 14.1. Chapter Overview
- 14.2. Key Assumptions and Methodology
- 14.3. Pharmaceutical Contract Manufacturing: Global Production Capacity
- 14.3.1. Analysis by Company Size
- 14.3.2. Analysis by Scale of Operation
- 14.3.2. Analysis by Location of Headquarters
- 14.3.3. Analysis by Location of Manufacturing Facilities
- 14.3.3.1. Pharmaceutical Contract Manufacturing Capacity in North America
- 14.3.3.2. Pharmaceutical Contract Manufacturing Capacity in Europe
- 14.3.3.3. Pharmaceutical Contract Manufacturing Capacity in Asia-Pacific
- 14.4. Concluding Remarks
15. DEMAND ANALYSIS
- 15.1. Chapter Overview
- 15.2. Key Assumptions and Methodology
- 15.2.1. Overall Annual Demand for Small Molecule APIs, till 2035
- 15.2.2. Annual Commercial Demand for Small Molecule APIs: Distribution by Geography, Current Year and 2035
- 15.2.2.1. Annual Commercial Demand for Small Molecule APIs in North America, till 2035
- 15.2.2.2. Annual Commercial Demand for Small Molecule APIs in Europe, till 2035
- 15.2.2.3. Annual Commercial Demand for Small Molecule APIs in Asia-Pacific, till 2035
- 15.2.2.4. Annual Commercial Demand for Small Molecule APIs in Rest of the World, till 2035
- 15.2.3. Annual Clinical Demand for Small Molecule APIs: Distribution by Trial Phase, Current Year and 2035
- 15.2.3.1. Annual Clinical Demand for Small Molecule APIs in Phase I Trials, till 2035
- 15.2.3.2. Annual Clinical Demand for Small Molecule APIs in Phase II Trials, till 2035
- 15.2.3.3. Annual Clinical Demand for Small Molecule APIs in Phase III Trials, till 2035
- 15.3. Annual Demand vs Capacity
16. MARKET IMPACT ANALYSIS: DRIVERS, RESTRAINTS, OPPORTUNITIES AND CHALLENGES
- 16.1. Chapter Overview
- 16.2. Market Drivers
- 16.3. Market Restraints
- 16.4. Market Opportunities
- 16.5. Market Challenges
- 16.6. Conclusion
17. GLOBAL PHARMACEUTICAL CONTRACT MANUFACTURING MARKET
- 17.1. Chapter Overview
- 17.2. Assumptions and Methodology
- 17.3. Global Pharmaceutical Contract Manufacturing Market, Historical Trends (since 2017) and Forecasted Estimates (till 2035)
- 17.3.1. Scenario Analysis
- 17.3.1.1. Conservative Scenario
- 17.3.1.2. Optimistic Scenario
- 17.3.1. Scenario Analysis
- 17.4. Key Market Segments
18. PHARMACEUTICAL CONTRACT MANUFACTURING MARKET, BY TYPE OF PRODUCT MANUFACTURED
- 18.1. Chapter Overview
- 18.2. Key Assumptions and Methodology
- 18.3. Pharmaceutical Contract Manufacturing Market: Distribution by Type of Product Manufactured, Current Year and 2035
- 18.3.1. Pharmaceutical Contract Manufacturing Market for API and Intermediates: Historical Trends (since 2017) and Forecasted Estimates (till 2035)
- 18.3.2. Pharmaceutical Contract Manufacturing Market for FDF: Historical Trends (since 2017) and Forecasted Estimates (till 2035)
- 18.4. Data Triangulation and Validation
19. PHARMACEUTICAL API CONTRACT MANUFACTURING MARKET, BY TYPE OF API
- 19.1. Chapter Overview
- 19.2. Key Assumptions and Methodology
- 19.3. Pharmaceutical API Contract Manufacturing Market: Distribution by Type of API, Current Year and 2035
- 19.3.1. Pharmaceutical API Contract Manufacturing Market for Generic API: Historical Trends (since 2017) and Forecasted Estimates (till 2035)
- 19.3.2. Pharmaceutical API Contract Manufacturing Market for Originator API: Historical Trends (since 2017) and Forecasted Estimates (till 2035)
- 19.4. Data Triangulation and Validation
20. PHARMACEUTICAL API CONTRACT MANUFACTURING MARKET, BY API POTENCY
- 20.1. Chapter Overview
- 20.2. Key Assumptions and Methodology
- 20.3. Pharmaceutical API Contract Manufacturing Market: Distribution by API Potency, Current Year and 2035
- 20.3.1. Pharmaceutical API Contract Manufacturing Market for Low Potent API: Historical Trends (since 2017) and Forecasted Estimates (till 2035)
- 20.3.2. Pharmaceutical API Contract Manufacturing Market for High Potent API: Historical Trends (since 2017) and Forecasted Estimates (till 2035)
- 20.4. Data Triangulation and Validation
21. PHARMACEUTICAL FDF CONTRACT MANUFACTURING MARKET, BY TYPE OF FDF
- 21.1. Chapter Overview
- 21.2. Key Assumptions and Methodology
- 21.3. Pharmaceutical FDF Contract Manufacturing Market: Distribution by Type of FDF, Current Year and 2035
- 21.3.1. Pharmaceutical FDF Contract Manufacturing Market for Generic FDF: Historical Trends (since 2017) and Forecasted Estimates (till 2035)
- 21.3.2. Pharmaceutical FDF Contract Manufacturing Market for Originator FDF: Historical Trends (since 2017) and Forecasted Estimates (till 2035)
- 21.4. Data Triangulation and Validation
22. PHARMACEUTICAL FDF CONTRACT MANUFACTURING MARKET, BY DOSAGE FORM
- 22.1. Chapter Overview
- 22.2. Key Assumptions and Methodology
- 22.3. Pharmaceutical FDF Contract Manufacturing Market: Distribution by Dosage Form, Current Year and 2035
- 22.3.1. Pharmaceutical FDF Contract Manufacturing Market for Oral Solids: Historical Trends (since 2017) and Forecasted Estimates (till 2035)
- 22.3.2. Pharmaceutical FDF Contract Manufacturing Market for Liquids: Historical Trends (since 2017) and Forecasted Estimates (till 2035)
- 22.3.3. Pharmaceutical FDF Contract Manufacturing Market for Emulsions: Historical Trends (since 2017) and Forecasted Estimates (till 2035)
- 22.3.4. Pharmaceutical FDF Contract Manufacturing Market for Other Dosage Forms: Historical Trends (since 2017) and Forecasted Estimates (till 2035)
- 22.4. Data Triangulation and Validation
23. PHARMACEUTICAL CONTRACT MANUFACTURING MARKET, BY TYPE OF PACKAGING OFFERED
- 23.1. Chapter Overview
- 23.2. Key Assumptions and Methodology
- 23.3. Pharmaceutical Contract Manufacturing Market: Distribution by Type of Packaging Offered, Current Year and 2035
- 23.3.1. Pharmaceutical Contract Manufacturing Market for Bottles: Historical Trends (since 2017) and Forecasted Estimates (till 2035)
- 23.3.2. Pharmaceutical Contract Manufacturing Market for Blisters: Historical Trends (since 2017) and Forecasted Estimates (till 2035)
- 23.3.3. Pharmaceutical Contract Manufacturing Market for Parenteral: Historical Trends (since 2017) and Forecasted Estimates (till 2035)
- 23.3.4. Pharmaceutical Contract Manufacturing Market for Others: Historical Trends (since 2017) and Forecasted Estimates (till 2035)
- 23.4. Data Triangulation and Validation
24. PHARMACEUTICAL CONTRACT MANUFACTURING MARKET, BY END-USERS
- 24.1. Chapter Overview
- 24.2. Key Assumptions and Methodology
- 24.3. Pharmaceutical Contract Manufacturing Market: Distribution by End-users, Current Year and 2035
- 24.3.1. Pharmaceutical Contract Manufacturing Market for Small Companies: Historical Trends (since 2017) and Forecasted Estimates (till 2035)
- 24.3.2. Pharmaceutical Contract Manufacturing Market for Mid-sized Companies: Historical Trends (since 2017) and Forecasted Estimates (till 2035)
- 24.3.3. Pharmaceutical Contract Manufacturing Market for Large and Very Large Companies: Historical Trends (since 2017) and Forecasted Estimates (till 2035)
- 24.4. Data Triangulation and Validation
25. PHARMACEUTICAL CONTRACT MANUFACTURING MARKET, BY SCALE OF OPERATION
- 25.1. Chapter Overview
- 25.2. Key Assumptions and Methodology
- 25.3. Pharmaceutical Contract Manufacturing Market: Distribution by Scale of Operation, Current Year and 2035
- 25.3.1. Pharmaceutical Contract Manufacturing Market for Clinical: Historical Trends (since 2017) and Forecasted Estimates (till 2035)
- 25.3.2. Pharmaceutical Contract Manufacturing Market for Commercial: Historical Trends (since 2017) and Forecasted Estimates (till 2035)
- 25.4. Data Triangulation and Validation
26. PHARMACEUTICAL CONTRACT MANUFACTURING MARKET, BY KEY GEOGRAPHICAL REGIONS
- 26.1. Chapter Overview
- 26.2. Key Assumptions and Methodology
- 26.3. Pharmaceutical Contract Manufacturing Market: Distribution by Key Geographical Regions, Current Year and 2035
- 26.3.1. Pharmaceutical Contract Manufacturing Market in North America: Historical Trends (since 2017) and Forecasted Estimates (till 2035)
- 26.3.2. Pharmaceutical Contract Manufacturing Market in Europe: Historical Trends (since 2017) and Forecasted Estimates (till 2035)
- 26.3.2. Pharmaceutical Contract Manufacturing Market in Asia-Pacific: Historical Trends (since 2017) and Forecasted Estimates (till 2035)
- 26.3.2. Pharmaceutical Contract Manufacturing Market in Latin America: Historical Trends (since 2017) and Forecasted Estimates (till 2035)
- 26.3.3. Pharmaceutical Contract Manufacturing Market in Middle East and North Africa: Historical Trends (since 2017) and Forecasted Estimates (till 2035)
- 26.4. Data Triangulation and Validation
27. PHARMACEUTICAL CONTRACT MANUFACTURING MARKET, BY LEADING PLAYERS
- 27.1. Chapter Overview
- 27.2. Key Assumptions and Methodology
- 27.3. Pharmaceutical Contract Manufacturing Market, by Leading Players
- 27.4. Data Triangulation and Validation
28. CASE STUDY: COMPARISON OF SMALL AND LARGE MOLECULES DRUGS / THERAPIES
- 28.1. Chapter Overview
- 28.2. Small Molecule and Large Molecule Drugs / Therapies
- 28.2.1. Comparison of General Characteristics
- 28.2.2. Comparison of Key Specifications
- 28.2.3. Comparison of Manufacturing Processes
- 28.2.4. Comparison of Key Manufacturing-related Challenges
29. CONCLUDING REMARKS
30. EXECUTIVE INSIGHTS
- 30.1. Chapter Overview
- 30.2. Ajinomoto Althea
- 30.2.1. Company Snapshot
- 30.2.2. Interview Transcript: Scott Goldstein, Former Director of Business Development
- 30.3. Bachem
- 30.3.1. Company Snapshot
- 30.3.2. Interview Transcript: Thomas Fruh, Former Chief Executive Officer
- 30.4. CiVentiChem
- 30.4.1. Company Snapshot
- 30.4.2. Interview Transcript: Bhaskar VenePalli, President and Chief Executive Officer
- 30.5. CordenPharma
- 30.5.1. Company Snapshot
- 30.5.2. Interview Transcript: Roberto Margartia, Digitalization and Artificial Intelligence Manager
- 30.6. Helsinn Group
- 30.6.1. Company Snapshot
- 30.6.2. Interview Transcript: Allison Vavala, Former Director, Commercial Development
- 30.7. Novasep
- 30.7.1. Company Snapshot
- 30.7.2. Interview Transcript: Kevin Daley, Former Director, Pharmaceuticals Marketing
- 30.8. Sovereign Pharma
- 30.8.1. Company Snapshot
- 30.8.2. Interview Transcript: Piyush Desai, Director, Operations
- 30.9. Wavelength Pharmaceuticals
- 30.9.1. Company Snapshot
- 30.9.2. Interview Transcript: Ilan Avni, Former Vice President Business Development, Marketing, and IP
31. APPENDIX I: TABULATED DATA
32. APPENDIX II: LIST OF COMPANIES AND ORGANIZATIONS
List of Tables
- Table 6.1 FDA Quality Agreement versus EMA cGMP Regulations: A Comparative Analysis
- Table 6.2 Pharmaceutical CMOs: Information on Approval from Various Regulatory Authorities
- Table 6.3 Key Regulatory Authorities: Comparison of NDA Approval Characteristics
- Table 7.1 Pharmaceutical CMOs: List of Companies
- Table 7.2 Pharmaceutical CMOs: Information on Product Manufacturing Capability and Type of Product Manufactured
- Table 7.3 Pharmaceutical CMOs: Information on Type of Service Offered
- Table 7.4 Pharmaceutical CMOs: Information on Type of Finished Dosage Form Manufactured
- Table 7.5 Pharmaceutical CMOs: Information on Type of Packaging Offered
- Table 7.6 Pharmaceutical CMOs: Information on Scale of Operation
- Table 8.1 Pharmaceutical CMOs: Information on Manufacturing Facilities in North America
- Table 8.2 Pharmaceutical CMOs: Information on Manufacturing Facilities in Europe
- Table 8.3 Pharmaceutical CMOs: Information on Manufacturing Facilities in Asia-Pacific
- Table 8.4 Pharmaceutical CMOs: Information on Manufacturing Facilities in Rest of the World
- Table 9.1 Pharmaceutical Contract Manufacturing: List of Companies Profiled
- Table 9.2 AMRI: Company Overview
- Table 9.3 AMRI: Service Portfolio
- Table 9.4 AMRI: Recent Developments and Future Outlook
- Table 9.5 Altasciences: Company Overview
- Table 9.6 Altasciences: Service Portfolio
- Table 9.7 Altasciences: Recent Developments and Future Outlook
- Table 9.8 Cambrex: Company Overview
- Table 9.9 Cambrex: Service Portfolio
- Table 9.10 Cambrex: Recent Developments and Future Outlook
- Table 9.11 Catalent: Company Overview
- Table 9.12 Catalent: Service Portfolio
- Table 9.13 Catalent: Recent Developments and Future Outlook
- Table 9.14 DPT Laboratories: Company Overview
- Table 9.15 DPT Laboratories: Service Portfolio
- Table 9.16 DPT Laboratories: Recent Developments and Future Outlook
- Table 9.17 Aenova: Company Overview
- Table 9.18 Aenova: Service Portfolio
- Table 9.19 Aenova: Recent Developments and Future Outlook
- Table 9.20 Almac: Company Overview
- Table 9.21 Almac: Service Portfolio
- Table 9.22 Almac: Recent Developments and Future Outlook
- Table 9.23 CordenPharma: Company Overview
- Table 9.24 CordenPharma: Service Portfolio
- Table 9.25 CordenPharma: Recent Developments and Future Outlook
- Table 9.26 Fresenius Kabi: Company Overview
- Table 9.27 Fresenius Kabi: Service Portfolio
- Table 9.28 Fresenius Kabi: Recent Developments and Future Outlook
- Table 9.29 Glatt: Company Overview
- Table 9.30 Glatt: Service Portfolio
- Table 9.31 Glatt: Recent Developments and Future Outlook
- Table 9.32 Hovione: Company Overview
- Table 9.33 Hovione: Service Portfolio
- Table 9.34 Hovione: Recent Developments and Future Outlook
- Table 9.35 Recipharm: Company Overview
- Table 9.36 Recipharm: Service Portfolio
- Table 9.37 Recipharm: Recent Developments and Future Outlook
- Table 9.38 Siegfried: Company Overview
- Table 9.39 Siegfried: Service Portfolio
- Table 9.40 Siegfried: Recent Developments and Future Outlook
- Table 9.41 CMIC Group: Company Overview
- Table 9.42 CMIC Group: Service Portfolio
- Table 9.43 CMIC Group: Recent Developments and Future Outlook
- Table 9.44 Nectar Lifesciences: Company Overview
- Table 9.45 Nectar Lifesciences: Service Portfolio
- Table 9.46 Nectar Lifesciences: Recent Developments and Future Outlook
- Table 9.47 Syngene: Company Overview
- Table 9.48 Syngene: Service Portfolio
- Table 9.49 Syngene: Recent Developments and Future Outlook
- Table 9.50 WuXi AppTec: Company Overview
- Table 9.51 WuXi AppTec: Service Portfolio
- Table 9.52 WuXi AppTec: Recent Developments and Future Outlook
- Table 10.1 Pharmaceutical Contract Manufacturing: List of Companies Profiled
- Table 10.2 Albemarle: Company Overview
- Table 10.3 Baxter: Company Overview
- Table 10.4 Patheon: Company Overview
- Table 10.5 West Pharmaceutical Services: Company Overview
- Table 10.6 Eurofins Scientific: Company Overview
- Table 10.7 Evonik: Company Overview
- Table 10.8 Fareva: Company Overview
- Table 10.9 GlaxoSmithKline: Company Overview
- Table 10.10 Lonza: Company Overview
- Table 10.11 Alkem Laboratories: Company Overview
- Table 10.12 Aspen Pharmacare: Company Overview
- Table 10.13 MSN Laboratories: Company Overview
- Table 10.14 Teva Pharmaceuticals: Company Overview
- Table 10.15 UBE Corporation: Company Overview
- Table 12.1 Pharmaceutical Contract Manufacturing: List of Mergers and Acquisitions
- Table 12.2 Mergers and Acquisitions: Deal Multiples, since 2017
- Table 13.1 Pharmaceutical Contract Manufacturing: List of Expansions
- Table 14.1 Global Production Capacity for Pharmaceutical Contract Manufacturing: Average Capacity by Size of CMOs (Sample Data Set)
- Table 14.2 Global Production Capacity for Pharmaceutical Contract Manufacturing: Distribution by Size of CMOs
- Table 15.1 Demand Analysis: Annual Outsourced Demand for Small Molecules, till 2035 (Metric Tons)
- Table 15.2 Pharmaceutical Contract Manufacturing: Annual Supply for Outsourcing, till 2035 (Million Liters)
- Table 27.1 List of Leading Pharmaceutical Contract Manufacturing Companies
- Table 28.1 Small Molecules and Large Molecules: Strengths and Weaknesses
- Table 28.2 Small Molecules and Large Molecules: Comparison of Key Characteristics
- Table 28.3 Small Molecules and Large Molecules: Comparison of Development Characteristics
- Table 30.1 Ajinomoto Althea: Key Highlights
- Table 30.2 Bachem: Key Highlights
- Table 30.3 CiVentiChem: Key Highlights
- Table 30.4 Helsinn: Key Highlights
- Table 30.5 Novasep: Key Highlights
- Table 30.6 Sovereign Pharma: Key Highlights
- Table 30.7 Wavelength Pharmaceuticals: Key Highlights
- Table 32.1 Pharmaceutical CMOs: Distribution by Year of Establishment
- Table 32.2 Pharmaceutical CMOs: Distribution by Company Size
- Table 32.3 Pharmaceutical CMOs: Distribution by Location of Headquarters (Region)
- Table 32.4 Pharmaceutical CMOs: Distribution by Location of Headquarters (Country)
- Table 32.5 Pharmaceutical CMOs: Distribution by Location of Manufacturing Facilities
- Table 32.6 Pharmaceutical CMOs: Distribution by Product Manufacturing Capability
- Table 32.7 Pharmaceutical CMOs: Distribution by Type of Product Manufactured
- Table 32.8 Pharmaceutical CMOs: Distribution by Type of Service Offered
- Table 32.9 Pharmaceutical CMOs: Distribution by Type of Finished Dosage Form Manufactured
- Table 32.10 Pharmaceutical CMOs: Distribution by Type of Packaging Offered
- Table 32.11 Pharmaceutical CMOs: Distribution by Scale of Operation
- Table 32.12 Pharmaceutical CMOs: Distribution by Location of Manufacturing Facilities
- Table 32.13 Pharmaceutical CMOs: Distribution of Pharmaceutical Contract Manufacturers by Scale of Operation
- Table 32.14 Catalent: Annual Revenue, FY 2019 Onwards (USD Billion)
- Table 32.15 Aenova: Annual Revenue, FY 2019 Onwards (EUR Million)
- Table 32.16 Almac: Annual Revenue, FY 2019 Onwards (Pound Million)
- Table 32.17 Fresenius Kabi: Annual Revenues, FY 2019 Onwards (EUR Million)
- Table 32.18 Recipharm: Annual Revenues, FY 2019 Onwards (SEK Million)
- Table 32.19 Siegfried: Annual Revenues, FY 2019 Onwards (CHF Billion)
- Table 32.20 CMIC Group: Annual Revenues, FY 2019 Onwards (JPY Billion)
- Table 32.21 Nectar Lifesciences: Annual Revenues, FY 2019 Onwards (INR Billion)
- Table 32.22 Syngene: Annual Revenues, FY 2019 Onwards (INR Billion)
- Table 32.23 WuXi AppTec: Revenues, FY 2019 Onwards (RMB Billion)
- Table 32.24 Mergers and Acquisitions: Distribution by Year of Agreement, since 2017
- Table 32.25 Mergers and Acquisitions: Distribution by Type of Agreement
- Table 32.26 Mergers and Acquisitions: Distribution by Type of Acquisition
- Table 32.27 Mergers and Acquisitions: Distribution by Focus Area
- Table 32.28 Mergers and Acquisitions: Distribution by Type of Business Segment
- Table 32.29 Mergers and Acquisitions: Distribution by Type of Service Offered
- Table 32.30 Mergers and Acquisitions: Distribution by Scale of Operation
- Table 32.31 Mergers and Acquisitions: Distribution by Type of Acquisition and Scale of Operation
- Table 32.32 Mergers and Acquisitions: Distribution by Geography
- Table 32.33 Mergers and Acquisitions: Distribution by Location of Manufacturing Facility
- Table 32.34 Mergers and Acquisitions: Distribution by Key Value Drivers
- Table 32.35 Mergers and Acquisitions: Distribution by Year of Acquisitions and Key Value Drivers
- Table 32.36 Most Active Acquirers: Distribution by Number of Acquisitions
- Table 32.37 Key Acquirers: Distribution by Deal Multiples based on Revenue
- Table 32.38 Recent Expansions: Distribution by Year of Expansion, since 2017
- Table 32.39 Recent Expansions: Distribution by Type of Expansion
- Table 32.40 Recent Expansions: Distribution by Purpose of Expansion
- Table 32.41 Recent Expansions: Distribution by Year and Purpose of Expansion
- Table 32.42 Recent Expansions: Distribution by Type of Business Segment
- Table 32.43 Recent Expansions: Distribution by Type of API Manufactured
- Table 32.44 Recent Expansions: Distribution by Type of Service Offered
- Table 32.45 Recent Expansions: Distribution by Scale of Operation
- Table 32.46 Recent Expansions: Distribution by Capital Invested (USD Million)
- Table 32.47 Recent Expansions: Distribution by Purpose of Expansion and Capital Invested (USD Million)
- Table 32.48 Recent Expansions: Distribution by Location of Headquarters
- Table 32.49 Recent Expansions: Distribution by Capital Invested (USD Million) and Location of Headquarters
- Table 32.50 Recent Expansions: Distribution by Location of Manufacturing Facility
- Table 32.51 Most Active Players: Distribution by Number of Recent Expansions
- Table 32.52 Global Production Capacity for Pharmaceutical Contract Manufacturing: Distribution by Size of CMOs (Sample Data Set)
- Table 32.53 Global Production Capacity for Pharmaceutical Contract Manufacturing: Distribution by Size of CMOs
- Table 32.54 Global Production Capacity for Pharmaceutical Contract Manufacturing: Distribution by Location of Headquarters
- Table 32.55 Global Production Capacity for Pharmaceutical Contract Manufacturing: Distribution by Location of Manufacturing Facilities (Region-wise)
- Table 32.56 Demand Analysis: Annual Demand for Small Molecule APIs, till 2035 (Metric Ton)
- Table 32.57 Demand Analysis: Demand Analysis: Commercial Demand for Small Molecule APIs: Distribution by Geography, Current Year and 2035 (Metric Ton)
- Table 32.58 Demand Analysis: Commercial Demand for Small Molecule APIs in North America, till 2035 (Metric Ton)
- Table 32.59 Demand Analysis: Commercial Demand for Small Molecule APIs in Europe, till 2035 (Metric Ton)
- Table 32.60 Demand Analysis: Commercial Demand for Small Molecule APIs in Asia-Pacific, till 2035 (Metric Ton)
- Table 32.61 Demand Analysis: Commercial Demand for Small Molecule APIs in Rest of the World, till 2035 (Metric Ton)
- Table 32.62 Demand Analysis: Clinical Demand for Small Molecule APIs: Distribution by Trial Phase, till 2035 (Metric Ton)
- Table 32.63 Demand Analysis: Clinical Demand for Small Molecule APIs in Phase I Trials, till 2035 (Metric Ton)
- Table 32.64 Demand Analysis: Clinical Demand for Small Molecule APIs in Phase II Trials, till 2035 (Metric Ton)
- Table 32.65 Demand Analysis: Clinical Demand for Small Molecule APIs in Phase III Trials, till 2035 (Metric Ton)
- Table 32.66 Pharmaceutical Contract Manufacturing: Demand vs Capacity, till 2035
- Table 32.67 Global Pharmaceutical Contract Manufacturing Market, Historical Trends (since 2017) and Forecasted Estimates (till 2035) (USD Billion)
- Table 32.68 Global Pharmaceutical Contract Manufacturing Market, Forecasted Estimates (till 2035): Conservative Scenario (USD Billion)
- Table 32.69 Global Pharmaceutical Contract Manufacturing Market, Forecasted Estimates (till 2035): Optimistic Scenario (USD Billion)
- Table 32.70 Pharmaceutical Contract Manufacturing Market: Distribution by Type of Product Manufactured, Current Year and 2035
- Table 32.71 Pharmaceutical Contract Manufacturing Market for API & Intermediates: Historical Trends (since 2017) and Forecasted Estimates (till 2035) (USD Billion)
- Table 32.72 Pharmaceutical Contract Manufacturing Market for FDF: Historical Trends (since 2017) and Forecasted Estimates (till 2035) (USD Billion)
- Table 32.73 Pharmaceutical API Manufacturing Market: Distribution by Type of API, Current Year and 2035
- Table 32.74 Pharmaceutical API Contract Manufacturing Market for Generic API: Historical Trend (since 2017) and Forecasted Estimates (till 2035) (USD Billion)
- Table 32.75 Pharmaceutical API Contract Manufacturing Market for Originator API: Historical Trend (since 2017) and Forecasted Estimates (till 2035) (USD Billion)
- Table 32.76 Pharmaceutical API Contract Manufacturing Market: Distribution by API Potency, Current Year and 2035
- Table 32.77 Pharmaceutical API Contract Manufacturing Market for Low Potent API: Historical Trend (since 2017) and Forecasted Estimates (till 2035) (USD Billion)
- Table 32.78 Pharmaceutical API Contract Manufacturing Market for High Potent API: Historical Trend (since 2017) and Forecasted Estimates (till 2035) (USD Billion)
- Table 32.79 Pharmaceutical FDF Contract Manufacturing Market: Distribution by Type of FDF, Current Year and 2035
- Table 32.80 Pharmaceutical FDF Contract Manufacturing Market for Generic FDF: Historical Trends (since 2017) and Forecasted Estimates (till 2035) (USD Billion)
- Table 32.81 Pharmaceutical FDF Contract Manufacturing Market for Originator FDF: Historical Trends (since 2017) and Forecasted Estimates (till 2035) (USD Billion)
- Table 32.82 Pharmaceutical Contract Manufacturing Market: Distribution by Dosage Form, Current Year and 2035
- Table 32.83 Pharmaceutical FDF Contract Manufacturing Market for Oral Solids: Historical Trends (since 2017) and Forecasted Estimates (till 2035) (USD Billion)
- Table 32.84 Pharmaceutical FDF Contract Manufacturing Market for Liquids: Historical Trends (since 2017) and Forecasted Estimates (till 2035) (USD Billion)
- Table 32.85 Pharmaceutical FDF Contract Manufacturing Market for Emulsions: Historical Trends (since 2017) and Forecasted Estimates (till 2035) (USD Billion)
- Table 32.86 Pharmaceutical FDF Contract Manufacturing Market for Other Dosage Forms: Historical Trends (since 2017) and Forecasted Estimates (till 2035) (USD Billion)
- Table 32.87 Pharmaceutical Contract Manufacturing Market: Distribution by Type of Packaging Offered, Current Year and 2035
- Table 32.88 Pharmaceutical Contract Manufacturing Market for Bottles: Historical Trend (since 2017) and Forecasted Estimates (till 2035) (USD Billion)
- Table 32.89 Pharmaceutical Contract Manufacturing Market for Blisters: Historical Trend (since 2017) and Forecasted Estimates (till 2035) (USD Billion)
- Table 32.90 Pharmaceutical Contract Manufacturing Market for Parenteral: Historical Trend (since 2017) and Forecasted Estimates (till 2035) (USD Billion)
- Table 32.91 Pharmaceutical Contract Manufacturing Market for Parenteral: Historical Trend (since 2017) and Forecasted Estimates (till 2035) (USD Billion)
- Table 32.92 Pharmaceutical Contract Manufacturing Market for Others: Historical Trend (since 2017) and Forecasted Estimates (till 2035) (USD Billion)
- Table 32.93 Pharmaceutical Contract Manufacturing Market: Distribution by End-user, Current Year and 2035
- Table 32.94 Pharmaceutical Contract Manufacturing Market for Small Companies: Historical Trend (since 2017) and Forecasted Estimates (till 2035) (USD Billion)
- Table 32.95 Pharmaceutical Contract Manufacturing Market for Mid-sized Companies: Historical Trend (since 2017) and Forecasted Estimates (till 2035) (USD Billion)
- Table 32.96 Pharmaceutical Contract Manufacturing Market for Large and Very Large Companies: Historical Trend (since 2017) and Forecasted Estimates (till 2035) (USD Billion)
- Table 32.97 Pharmaceutical Contract Manufacturing Market: Distribution by Scale of Operation, Current Year and 2035
- Table 32.98 Pharmaceutical Contract Manufacturing Market for Clinical: Historical Trend (since 2017) and Forecasted Estimates (till 2035) (USD Billion)
- Table 32.99 Pharmaceutical Contract Manufacturing Market for Commercial: Historical Trend (since 2017) and Forecasted Estimates (till 2035) (USD Billion)
- Table 32.100 Pharmaceutical Contract Manufacturing Market: Distribution by Key Geographical Regions, Current Year and 2035
- Table 32.101 Pharmaceutical Contract Manufacturing Market in North America: Historical Trends (since 2017) and Forecasted Estimates (till 2035) (USD Billion)
- Table 32.102 Pharmaceutical Contract Manufacturing Market in Europe: Historical Trends (since 2017) and Forecasted Estimates (till 2035) (USD Billion)
- Table 32.103 Pharmaceutical Contract Manufacturing Market in Asia-Pacific: Historical Trends (since 2017) and Forecasted Estimates (till 2035) (USD Billion)
- Table 32.104 Pharmaceutical Contract Manufacturing Market in Latin America: Historical Trends (since 2017) and Forecasted Estimates (till 2035) (USD Billion)
- Table 32.105 Pharmaceutical Contract Manufacturing Market in Middle East and North Africa: Historical Trends (since 2017) and Forecasted Estimates (till 2035) (USD Billion)
List of Figures
- Figure 2.1 Research Methodology: Project Methodology
- Figure 2.2 Research Methodology: Forecast Methodology
- Figure 2.3 Research Methodology: Robust Quality Control
- Figure 2.4 Research Methodology: Key Market Segmentation
- Figure 3.1 Lessons Learnt from Past Recessions
- Figure 4.1 Executive Summary: Market Landscape
- Figure 4.2 Executive Summary: Mergers and Acquisitions
- Figure 4.3 Executive Summary: Recent Expansions
- Figure 4.4 Executive Summary: Capacity Analysis
- Figure 4.5 Executive Summary: Demand Analysis
- Figure 4.6 Executive Summary: Market Sizing and Opportunity Analysis
- Figure 5.1 Type of Third-party Manufacturers
- Figure 5.2 Outsourcing Opportunities in Pharmaceutical Value Chain
- Figure 5.3 Services Offered by CMOs
- Figure 5.4 Key Considerations while Selecting a CMO
- Figure 6.1 Key Regulatory Requirements for CMOs and CROs in India
- Figure 6.2 Regulatory Landscape for Pharmaceutical CMOs: Distribution by Type of Regulatory Authorities
- Figure 6.3 Bubble Analysis: Regional Regulatory Summary
- Figure 7.1 Pharmaceutical CMOs: Distribution by Year of Establishment
- Figure 7.2 Pharmaceutical CMOs: Distribution by Company Size
- Figure 7.3 Pharmaceutical CMOs: Distribution by Location of Headquarters (Region)
- Figure 7.4 Pharmaceutical CMOs: Distribution by Location of Headquarters (Country)
- Figure 7.5 Pharmaceutical CMOs: Distribution by Location of Manufacturing Facilities
- Figure 7.6 Pharmaceutical CMOs: Distribution by Product Manufacturing Capability
- Figure 7.7 Pharmaceutical CMOs: Distribution by Type of Product Manufactured
- Figure 7.8 Pharmaceutical CMOs: Distribution by Type of Service Offered
- Figure 7.9 Pharmaceutical CMOs: Distribution by Type of Finished Dosage Form Manufactured
- Figure 7.10 Pharmaceutical CMOs: Distribution by Type of Packaging Offered
- Figure 7.11 Pharmaceutical CMOs: Distribution by Scale of Operation
- Figure 8.1 Pharmaceutical CMOs: Distribution by Location of Manufacturing Facilities
- Figure 8.2 Pharmaceutical CMOs: Distribution of Pharmaceutical Contract Manufacturers by Scale of Operation
- Figure 8.3 Pharmaceutical Contract Manufacturing Facilities: North America Scenario
- Figure 8.4 Pharmaceutical Contract Manufacturing Facilities: Europe Scenario
- Figure 8.5 Pharmaceutical Contract Manufacturing Facilities: Asia-Pacific Scenario
- Figure 8.6 Pharmaceutical Contract Manufacturing Facilities: Rest of the World Scenario
- Figure 9.1 Catalent: Annual Revenue, FY 2019 Onwards (USD Billion)
- Figure 9.2 Aenova: Annual Revenue, FY 2019 Onwards (EUR Million)
- Figure 9.3 Almac: Annual Revenue, FY 2019 Onwards (Pound Million)
- Figure 9.4 Fresenius Kabi: Annual Revenues, FY 2019 Onwards (EUR Million)
- Figure 9.5 Recipharm: Annual Revenues, FY 2019 Onwards (SEK Million)
- Figure 9.6 Siegfried: Annual Revenues, FY 2019 Onwards (CHF Billion)
- Figure 9.7 CMIC Group: Annual Revenues, FY 2019 Onwards (JPY Billion)
- Figure 9.8 Nectar Lifesciences: Annual Revenues, FY 2019 Onwards (INR Billion)
- Figure 9.9 Syngene: Annual Revenues, FY 2019 Onwards (INR Billion)
- Figure 9.10 WuXi AppTec: Revenues, FY 2019 Onwards (RMB Billion)
- Figure 11.1 Make versus Buy Decision Making Framework
- Figure 11.2 Make versus Buy Decision Making: Possible Scenario Descriptions
- Figure 12.1 Mergers and Acquisitions: Distribution by Year of Agreement, since 2017
- Figure 12.2 Mergers and Acquisitions: Distribution by Type of Agreement
- Figure 12.3 Mergers and Acquisitions: Distribution by Type of Acquisition
- Figure 12.4 Mergers and Acquisitions: Distribution by Focus Area
- Figure 12.5 Mergers and Acquisitions: Distribution by Type of Business Segment
- Figure 12.6 Mergers and Acquisitions: Distribution by Type of Service Offered
- Figure 12.7 Mergers and Acquisitions: Distribution by Scale of Operation
- Figure 12.8 Mergers and Acquisitions: Distribution by Type of Acquisition and Scale of Operation
- Figure 12.9 Mergers and Acquisitions: Distribution by Geography
- Figure 12.10 Mergers and Acquisitions: Distribution by Location of Manufacturing Facility
- Figure 12.11 Mergers and Acquisitions: Distribution by Key Value Drivers
- Figure 12.12 Mergers and Acquisitions: Distribution by Year of Acquisitions and Key Value Drivers
- Figure 12.13 Most Active Acquirers: Distribution by Number of Acquisitions
- Figure 12.14 Key Acquirers: Distribution by Deal Multiples based on Revenue
- Figure 13.1 Recent Expansions: Distribution by Year of Expansion, since 2017
- Figure 13.2 Recent Expansions: Distribution by Type of Expansion
- Figure 13.3 Recent Expansions: Distribution by Purpose of Expansion
- Figure 13.4 Recent Expansions: Distribution by Year and Purpose of Expansion
- Figure 13.5 Recent Expansions: Distribution by Type of Business Segment
- Figure 13.6 Recent Expansions: Distribution by Type of API Manufactured
- Figure 13.7 Recent Expansions: Distribution by Type of Service Offered
- Figure 13.8 Recent Expansions: Distribution by Scale of Operation
- Figure 13.9 Recent Expansions: Distribution by Capital Invested (USD Million)
- Figure 13.10 Recent Expansions: Distribution by Purpose of Expansion and Capital Invested (USD Million)
- Figure 13.11 Recent Expansions: Distribution by Location of Headquarters
- Figure 13.12 Recent Expansions: Distribution by Capital Invested (USD Million) and Location of Headquarters
- Figure 13.13 Recent Expansions: Distribution by Location of Manufacturing Facility
- Figure 13.14 Most Active Players: Distribution by Number of Recent Expansions
- Figure 14.1 Global Production Capacity for Pharmaceutical Contract Manufacturing: Distribution by Size of CMOs (Sample Data Set)
- Figure 14.2 Global Production Capacity for Pharmaceutical Contract Manufacturing: Distribution by Size of CMOs
- Figure 14.3 Global Production Capacity for Pharmaceutical Contract Manufacturing: Distribution by Location of Headquarters
- Figure 14.4 Global Production Capacity for Pharmaceutical Contract Manufacturing: Distribution by Location of Manufacturing Facilities (Region-wise)
- Figure 15.1 Demand Analysis: Annual Demand for Small Molecule APIs, till 2035 (Metric Ton)
- Figure 15.2 Demand Analysis: Demand Analysis: Commercial Demand for Small Molecule APIs: Distribution by Geography, Current Year and 2035 (Metric Ton)
- Figure 15.3 Demand Analysis: Commercial Demand for Small Molecule APIs in North America, till 2035 (Metric Ton)
- Figure 15.4 Demand Analysis: Commercial Demand for Small Molecule APIs in Europe, till 2035 (Metric Ton)
- Figure 15.5 Demand Analysis: Commercial Demand for Small Molecule APIs in Asia-Pacific, till 2035 (Metric Ton)
- Figure 15.6 Demand Analysis: Commercial Demand for Small Molecule APIs in Rest of the World, till 2035 (Metric Ton)
- Figure 15.7 Demand Analysis: Clinical Demand for Small Molecule APIs: Distribution by Trial Phase, till 2035 (Metric Ton)
- Figure 15.8 Demand Analysis: Clinical Demand for Small Molecule APIs in Phase I Trials, till 2035 (Metric Ton)
- Figure 15.9 Demand Analysis: Clinical Demand for Small Molecule APIs in Phase II Trials, till 2035 (Metric Ton)
- Figure 15.10 Demand Analysis: Clinical Demand for Small Molecule APIs in Phase III Trials, till 2035 (Metric Ton)
- Figure 15.10 Pharmaceutical Contract Manufacturing: Demand vs Capacity, till 2035
- Figure 16.1 Pharmaceutical CMO: Market Drivers
- Figure 16.2 Pharmaceutical CMO: Market Restraints
- Figure 16.3 Pharmaceutical CMO: Market Opportunities
- Figure 16.4 Pharmaceutical CMO: Market Challenges
- Figure 17.1 Global Pharmaceutical Contract Manufacturing Market, Historical Trends (since 2017) and Forecasted Estimates (till 2035) (USD Billion)
- Figure 17.2 Global Pharmaceutical Contract Manufacturing Market, Forecasted Estimates (till 2035): Conservative Scenario (USD Billion)
- Figure 17.3 Global Pharmaceutical Contract Manufacturing Market, Forecasted Estimates (till 2035): Optimistic Scenario (USD Billion)
- Figure 18.1 Pharmaceutical Contract Manufacturing Market: Distribution by Type of Product Manufactured, Current Year and 2035
- Figure 18.2 Pharmaceutical Contract Manufacturing Market for API & Intermediates: Historical Trends (since 2017) and Forecasted Estimates (till 2035) (USD Billion)
- Figure 18.3 Pharmaceutical Contract Manufacturing Market for FDF: Historical Trends (since 2017) and Forecasted Estimates (till 2035) (USD Billion)
- Figure 19.1 Pharmaceutical API Contract Manufacturing Market: Distribution by Type of API, Current Year and 2035
- Figure 19.2 Pharmaceutical API Contract Manufacturing Market for Generic API: Historical Trend (since 2017) and Forecasted Estimates (till 2035) (USD Billion)
- Figure 19.3 Pharmaceutical API Contract Manufacturing Market for Originator API: Historical Trend (since 2017) and Forecasted Estimates (till 2035) (USD Billion)
- Figure 20.1 Pharmaceutical API Contract Manufacturing Market: Distribution by API Potency, Current Year and 2035
- Figure 20.2 Pharmaceutical API Contract Manufacturing Market for Low Potent API: Historical Trend (since 2017) and Forecasted Estimates (till 2035) (USD Billion)
- Figure 20.3 Pharmaceutical API Contract Manufacturing Market for High Potent API: Historical Trend (since 2017) and Forecasted Estimates (till 2035) (USD Billion)
- Figure 21.1 Pharmaceutical FDF Contract Manufacturing Market: Distribution by Type of FDF, Current Year and 2035
- Figure 21.2 Pharmaceutical FDF Contract Manufacturing Market for Generic FDF: Historical Trends (since 2017) and Forecasted Estimates (till 2035) (USD Billion)
- Figure 21.3 Pharmaceutical FDF Contract Manufacturing Market for Originator FDF: Historical Trends (since 2017) and Forecasted Estimates (till 2035) (USD Billion)
- Figure 22.1 Pharmaceutical Contract Manufacturing Market: Distribution by Dosage Form, Current Year and 2035
- Figure 22.2 Pharmaceutical FDF Contract Manufacturing Market for Oral Solids: Historical Trends (since 2017) and Forecasted Estimates (till 2035) (USD Billion)
- Figure 22.3 Pharmaceutical FDF Contract Manufacturing Market for Liquids: Historical Trends (since 2017) and Forecasted Estimates (till 2035) (USD Billion)
- Figure 22.4 Pharmaceutical FDF Contract Manufacturing Market for Emulsions: Historical Trends (since 2017) and Forecasted Estimates (till 2035) (USD Billion)
- Figure 22.5 Pharmaceutical FDF Contract Manufacturing Market for Other Dosage Forms: Historical Trends (since 2017) and Forecasted Estimates (till 2035) (USD Billion)
- Figure 23.1 Pharmaceutical Contract Manufacturing Market: Distribution by Type of Packaging Offered, Current Year and 2035
- Figure 23.2 Pharmaceutical Contract Manufacturing Market for Bottles: Historical Trend (since 2017) and Forecasted Estimates (till 2035) (USD Billion)
- Figure 23.3 Pharmaceutical Contract Manufacturing Market for Blisters: Historical Trend (since 2017) and Forecasted Estimates (till 2035) (USD Billion)
- Figure 23.4 Pharmaceutical Contract Manufacturing Market for Parenteral: Historical Trend (since 2017) and Forecasted Estimates (till 2035) (USD Billion)
- Figure 23.5 Pharmaceutical Contract Manufacturing Market for Parenteral: Historical Trend (since 2017) and Forecasted Estimates (till 2035) (USD Billion)
- Figure 23.6 Pharmaceutical Contract Manufacturing Market for Others: Historical Trend (since 2017) and Forecasted Estimates (till 2035) (USD Billion)
- Figure 24.1 Pharmaceutical Contract Manufacturing Market: Distribution by End-users, Current Year and 2035
- Figure 24.2 Pharmaceutical Contract Manufacturing Market for Small Companies: Historical Trend (since 2017) and Forecasted Estimates (till 2035) (USD Billion)
- Figure 24.3 Pharmaceutical Contract Manufacturing Market for Mid-sized Companies: Historical Trend (since 2017) and Forecasted Estimates (till 2035) (USD Billion)
- Figure 24.4 Pharmaceutical Contract Manufacturing Market for Large and Very Large Companies: Historical Trend (since 2017) and Forecasted Estimates (till 2035) (USD Billion)
- Figure 25.1 Pharmaceutical Contract Manufacturing Market: Distribution by Scale of Operation, Current Year and 2035
- Figure 25.2 Pharmaceutical Contract Manufacturing Market for Clinical: Historical Trend (since 2017) and Forecasted Estimates (till 2035) (USD Billion)
- Figure 25.3 Pharmaceutical Contract Manufacturing Market for Commercial: Historical Trend (since 2017) and Forecasted Estimates (till 2035) (USD Billion)
- Figure 26.1 Pharmaceutical Contract Manufacturing Market: Distribution by Key Geographical Regions, Current Year and 2035
- Figure 26.2 Pharmaceutical Contract Manufacturing Market in North America: Historical Trends (since 2017) and Forecasted Estimates (till 2035) (USD Billion)
- Figure 26.3 Pharmaceutical Contract Manufacturing Market in Europe: Historical Trends (since 2017) and Forecasted Estimates (till 2035) (USD Billion)
- Figure 26.4 Pharmaceutical Contract Manufacturing Market in Asia-Pacific: Historical Trends (since 2017) and Forecasted Estimates (till 2035) (USD Billion)
- Figure 26.5 Pharmaceutical Contract Manufacturing Market in Latin America: Historical Trends (since 2017) and Forecasted Estimates (till 2035) (USD Billion)
- Figure 26.6 Pharmaceutical Contract Manufacturing Market in Middle East and North Africa: Historical Trends (since 2017) and Forecasted Estimates (till 2035) (USD Billion)
- Figure 27.1 Pharmaceutical Contract Manufacturing Market: Distribution by Leading Players (USD Billion)
- Figure 28.1 Small Molecule and Large Molecule Drugs: Historical Trend of FDA Approval, since 2005
- Figure 28.2 Small Molecules versus Large Molecules: Comparison of Manufacturing Process
- Figure 29.1 Conclusion: Overall Pharmaceutical Contract Manufacturing Market Landscape
- Figure 29.2 Conclusion: Mergers and Acquisitions
- Figure 29.3 Conclusion: Recent Expansions
- Figure 29.4 Conclusion: Capacity Analysis
- Figure 29.5 Conclusion: Demand Analysis
- Figure 29.6 Conclusion: Market Sizing and Opportunity Analysis
 即用型 (RTU) 药品包装市场(第三版):产业趋势及全球预测(至 2035 年)-依容器类型、封盖类型、製造材料和主要地区划分抗体药物偶联物 (ADC) 合约生产市场(第七版):依研发阶段、製程组件、有效载荷、抗体同型、标靶适应症、抗体来源、连接子和主要地区划分——产业趋势及全球预测至 2035 年最后填充医药品受託製造市场:2035年前的产业趋势和全球预测 - 各最后填充服务形式,FDF,API滴定率,一次用包装容器,各地区,主要企业
 即用型药品包装市场分析及预测(至2034年):类型、产品、服务、技术、材料类型、应用、设备、最终用户、流程、解决方案
 医疗保健契约製造市场按服务类型、产品类型、分子类型、治疗领域、最终用户和公司规模划分-全球预测,2025-2032年医药契约製造和研发服务市场(按服务类型和最终用户划分)-2025-2032年全球预测医药契约製造市场按服务类型、分子类型、剂型、客户类型、治疗领域、合约类型、製造规模和製程类型划分 - 全球预测,2025-2032 年合约研究与生产服务市场(按服务类型、技术、治疗领域、应用和最终用户划分)—2025-2032年全球预测抗体契约製造市场:下游-2025-2032年全球预测按服务类型、分子类型、产品类型、自动化程度、企业规模和最终用户分類的全球医药契约製造市场预测(2025-2032年)