


 |
市场调查报告书
商品编码
1624835
mRNA疫苗及治疗药的全球市场:各应用领域,各适应疾病,各地区:2035年前的产业趋势全球预测mRNA Vaccine and Therapeutics Market by Application Area, Target Disease Indication and Geographical Regions : Industry Trends and Global Forecasts, Till 2035 |
||||||
到 2035 年,全球 mRNA 疫苗和治疗药物市场预计将达到 19.9 亿美元,这主要是由于用于治疗传染病的 mRNA 疫苗和治疗药物的预期批准。
信使核糖核酸 (mRNA) 是一种单链核糖核酸 (RNA),在传递蛋白质生产的遗传讯息方面发挥重要作用。 mRNA 携带从 DNA 链到核醣体的蛋白质合成编码指令,这些指令在核醣体中被翻译并加工成功能性蛋白质。
近年来,mRNA 技术彻底改变了製药业,用于预防和治疗各种疾病和病症。 COVID-19 疫苗的成功为 mRNA 疫苗和治疗方法铺平了道路。值得注意的是,在过去几年中,已有超过 170 项与基于 mRNA 的治疗/疫苗相关的临床试验註册。多项临床前和临床研究已经证明了这些平台的有效性,过去两年发表了各种研究论文。这表明利益相关者正在该领域进行广泛的开发努力。目前,超过 45 家产业参与者正在致力于开发适用于多种适应症的 mRNA 候选药物。
COVID-19疫苗的成功,研究活动的活跃,mRNA医药品候补的丰富的开发平台(管线),一般认为今后10年,牵引全球mRNA疫苗及治疗药市场的可能性高(贵)。
本报告提供全球mRNA疫苗及治疗药市场相关调查,提供市场概要,以及各应用领域,各适应疾病,各地区的趋势,及加入此市场的主要企业简介等资讯。
目录
第1章 序文
第2章 调查手法
第3章 经济以及其他的计划特有的考虑事项
第4章 摘要整理
第5章 简介
第6章 市场形势
第7章 竞争情形
第8章 企业竞争力分析
第8章 把欧洲作为据点的mRNA疫苗及治疗药开发商
第8章 在亚太地区及其他地区里(上)放置据点的mRNA疫苗及治疗药开发商
第9章 企业简介
第10章 大型製药公司的配合措施
第11章 Start-Ups的健康指标
第12章 临床试验的分析
第13章 伙伴关係和合作
第14章 资金筹措与投资分析
第15章 专利分析
第16章 对市场的影响分析:促进因素,阻碍因素,机会,课题
第17章 全球mRNA疫苗及治疗药市场
第18章 mRNA疫苗及治疗药市场(各应用领域)
第19章 mRNA疫苗及治疗药市场(各适应疾病)
第20章 mRNA疫苗及治疗药市场(各地区)
第21章 结论
第22章 执行洞察
第23章 附录1:表格形式的资料
第24章 附录2:业·团体一览
MRNA VACCINE AND THERAPEUTICS MARKET: OVERVIEW
As per Roots Analysis, the global mRNA vaccine and therapeutics market is estimated to be worth USD 1.99 billion by 2035, primarily driven by the anticipated approval of mRNA vaccines and therapeutics intended for the treatment of infectious diseases.
The market sizing and opportunity analysis has been segmented across the following parameters:
Application Area
- COVID-19
- Other Indications
Target Disease Indication
- Influenza
- Respiratory Syncytial Virus Infection
- Cytomegalovirus Diseases
Key Geographical Regions
- North America
- Europe
- Asia-Pacific
- Latin America
- Rest of the World
MRNA VACCINE AND THERAPEUTICS MARKET: GROWTH AND TRENDS
Messenger ribonucleic acid (mRNA) is a form of single-stranded ribonucleic acid (RNA) that is crucial role in transferring genetic information for protein production. The mRNA carries the coding instructions for protein synthesis from a DNA strand to the ribosomes, where these instructions are translated and processed into functional proteins.
In recent years, mRNA technology has revolutionized the pharmaceutical industry to prevent and treat a wide array of diseases and disorders. The success of COVID-19 vaccines has paved the path for mRNA vaccines and therapeutics. It is worth highlighting that, in the past few years, more than 170 clinical trials related to mRNA-based therapeutics / vaccines have been registered. Multiple preclinical and clinical studies show the efficacy of these platforms which have been published in the last two years across different research articles. This demonstrates the extensive development efforts being undertaken by stakeholders in this domain. At present, over 45 industry players are engaged in the development of mRNA drug candidates for a wide range of disease indications.
The success of COVID-19 vaccines, growing research activity and the rich pipeline of mRNA drug candidates is likely to drive the global mRNA vaccine and therapeutics market in the coming decade.
MRNA VACCINE AND THERAPEUTICS MARKET: KEY INSIGHTS
The report delves into the current state of the mRNA vaccine and therapeutics market and identifies potential growth opportunities within the industry. Some key findings from the report include:
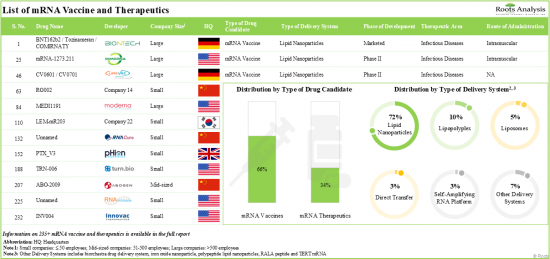
1. Presently, over 235 mRNA drug candidates are available in the market or under development; majority of these drug candidates are vaccines using lipid nanoparticles as delivery systems.
2. The pipeline features several drugs, which are being investigated across different phases of development; 60% of the drug candidates are designed to be administered via intramuscular routes.
3. The current market landscape of mRNA vaccine and therapeutics developers is fragmented, featuring the presence of both new entrants and established players; majority of these players are based in the US.
4. Stakeholders are actively upgrading their existing capabilities to further enhance their respective product pipeline and comply with the evolving industry benchmarks.
5. The growing interest of stakeholders is evident from the surge in partnership activity; clinical trial agreements emerged as the most prevalent partnership model adopted by drug developers.
6. Several investors, having realized the opportunity within this upcoming segment, have invested over USD 11 billion across various funding rounds.
7. More than 345,000 patients have been recruited / enrolled in clinical trials registered for various mRNA-based therapies, across different geographies.
8. Over 430 patents related to mRNA vaccine and therapeutics have been filed / granted by industry and non-industry stakeholders, indicating the growing intellectual capital in this domain.
9. Big pharma players have undertaken several initiatives, ranging from proprietary product development to strategic investments, to tap the lucrative opportunity in this rapidly growing market.
10. The projected opportunity for mRNA vaccine and therapeutics market is likely to be driven by the increasing research and development for mRNA-based drugs focused on non-COVID indications.
MRNA VACCINE AND THERAPEUTICS MARKET: KEY SEGMENTS
Several indications, such as Influenza, Respiratory Syncytial Virus, Cytomegalovirus, are the Expected to Drive the mRNA Vaccine and Therapeutics Market
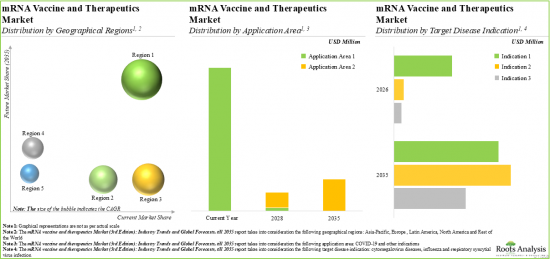
Based on the application area, the market is segmented into COVID-19 and other indications. Owing to their proven efficacy against the COVID-19 infection, the vaccines and therapeutics developed for COVID-19 infection have captured the majority of the market share. However, the anticipated approval of mRNA vaccines for other indications is likely to drive the market in the coming decade.
Currently, Influenza Segment Occupies the Largest Share of the mRNA Vaccine and Therapeutics Market
Based on the target disease indication, the market is segmented into influenza, respiratory syncytial virus infection and cytomegalovirus diseases. It is worth highlighting that the vaccines and therapeutics developed for influenza are likely to drive the market in the coming decade. This can be attributed to the rise in investment in the research and development of influenza vaccines, along with growing awareness among governments and non-profit organizations about the importance of influenza prevention and control.
North America Accounts for the Largest Share of the Market
Based on key geographical regions, the market is segmented into North America, Europe, Asia-Pacific, Latin America and Rest of the World. It is worth highlighting that the market for North America holds the maximum share of the mRNA vaccines and therapeutics market. This trend is likely to remain the same in the coming decade.
Example Players in the mRNA Vaccine and Therapeutics Market
- Arcturus Therapeutics
- BioNTech
- CureVac
- Ethris
- IMMORNA
- Moderna
- Providence Therapeutics
- RNACure
- Suzhou Abogen Biosciences
- Turn Biotechnologies
- Gennova
- Innovac Therapeutics
- Kernal Biologics
- Pantherna Therapeutics
- pHion Therapeutics
- Recode Therapeutics
- Rejuvenation Technologies
- RNAimmune
- Strand Therapeutics
- Walvax
- Ziphius Vaccines
Primary Research Overview
The opinions and insights presented in this study were influenced by discussions conducted with multiple stakeholders. The research report features detailed transcripts of interviews held with the following industry stakeholders:
- Business Development Manager, Canvax
- Senior Director, Business Development, eTheRNA
- Team Leader, GC Biopharma
MRNA VACCINE AND THERAPEUTICS MARKET: RESEARCH COVERAGE
- Market Sizing and Opportunity Analysis: The report features an in-depth analysis of the mRNA vaccine and therapeutics market, focusing on key market segments, including [A] application area, [B] target disease indication and [C] key geographical regions.
- Market Landscape (Drug Therapies): A comprehensive evaluation of mRNA therapeutics and vaccines, considering various parameters, such as [A] phase of development, [B] type of drug candidate, [C] therapeutic area, [D] type of delivery system, [E] type of molecule encoded and [F] route of administration.
- Market Landscape (Drug Developers): A comprehensive evaluation of companies involved in the development of mRNA vaccine and therapeutics, considering various parameters, such as [A] year of establishment, [B] company size (in terms of number of employees), [C] location of headquarters, [D] regional landscape and [E] key players engaged in this domain.
- Company Competitiveness Analysis: A comprehensive competitive analysis of mRNA vaccine and therapeutic developers, examining factors such as [A] developer strength, [B] pipeline strength and [C] number of therapeutic areas targeted.
- Company Profiles: In-depth profiles of key industry players engaged in the development of mRNA vaccine and therapeutics, focusing on [A] company overviews, [B] financial information, [C] mRNA vaccines and therapeutics pipeline, [D] recent developments and [E] an informed future outlook.
- Big Pharma Analysis: A comprehensive examination of various mRNA focused initiatives undertaken by major pharmaceutical companies. It includes a heat map representation that highlights mRNA therapeutics and vaccines under development (in partnership with core mRNA-focused entities), along with information on [A] funding amount raised, [B] partnership activity, and [C] diversity of product portfolio, as well as a spider web representation, comparing the initiatives of big pharmaceutical players on the basis of multiple relevant parameters.
- Start-up Health Indexing: An analysis of the startup companies engaged in this domain based on several relevant parameters, such as [A] number of candidates in discovery, [B] preclinical and clinical phases of development. In addition, it provides details on amount raised, number of investors and number of deals inked.
- Clinical Trial Analysis: Examination of completed, ongoing, and planned clinical studies of various mRNA vaccines and therapeutics based on several relevant parameters, such as [A] trial registration year, [B] trial status, [C] trial phase, [D] therapeutic area, [E] study design, [F] type of sponsor / collaborator, [G] leading industry players (in terms of number of trials conducted), [H] enrolled patient population and [I] geography.
- Partnerships and Collaborations: An analysis of partnerships established in this sector, since 2013, based on several relevant parameters, such as year of partnership, type of partnership, therapeutic area, most active players (in terms of number of deals inked) and regional distribution of partnership activity.
- Funding and Investment Analysis: A detailed evaluation of the investments made in the mRNA vaccines and therapeutics domain, encompassing seed financing, venture capital, IPOs, secondary offerings, debt, grants and other offerings based on several parameters, such as [A] year of funding, [B] type of funding, [C] amount invested, therapeutic area, most active players (in terms of number of funding instances and amount invested) and key investors (in terms of number of funding instances).
- Patent Analysis: Detailed analysis of various patents filed / granted related to mRNA therapeutics and vaccines several relevant parameters, such as [A] type of patent, [B] publication year, [C] geographical region, [D] CPC symbols, [E] leading industry players (in terms of the number of patents filed / granted) and [F] patent valuation.
- Market Impact Analysis: The report analyzes various factors such as drivers, restraints, opportunities, and challenges affecting market growth.
KEY QUESTIONS ANSWERED IN THIS REPORT
- How many companies are currently engaged in this market?
- Which are the leading companies in this market?
- What kind of partnership models are commonly adopted by industry stakeholders?
- What amount has been invested in this domain?
- What factors are likely to influence the evolution of this market?
- What is the current and future market size?
- What is the CAGR of this market?
- How is the current and future market opportunity likely to be distributed across key market segments?
REASONS TO BUY THIS REPORT
- The report provides a comprehensive market analysis, offering detailed revenue projections of the overall market and its specific sub-segments. This information is valuable to both established market leaders and emerging entrants.
- Stakeholders can leverage the report to gain a deeper understanding of the competitive dynamics within the market. By analyzing the competitive landscape, businesses can make informed decisions to optimize their market positioning and develop effective go-to-market strategies.
- The report offers stakeholders a comprehensive overview of the market, including key drivers, barriers, opportunities, and challenges. This information empowers stakeholders to stay abreast of market trends and make data-driven decisions to capitalize on growth prospects.
ADDITIONAL BENEFITS
- Complimentary PPT Insights Packs
- Complimentary Excel Data Packs for all Analytical Modules in the Report
- 10% Free Content Customization
- Detailed Report Walkthrough Session with Research Team
- Free Updated report if the report is 6-12 months old or older
TABLE OF CONTENTS
1. PREFACE
- 1.1. Introduction
- 1.2. Market Share Insights
- 1.3. Key Market Insights
- 1.4. Research Coverage
- 1.5. Key Questions Answered
- 1.6. Chapter Outlines
2. RESEARCH METHODOLOGY
- 2.1. Chapter Overview
- 2.2. Research Assumptions
- 2.2.1. Market Landscape and Market Trends
- 2.2.2. Market Forecast and Opportunity Analysis
- 2.2.3. Comparative Analysis
- 2.3. Database Building
- 2.3.1. Data Collection
- 2.3.2. Data Validation
- 2.3.3. Data Analysis
- 2.4. Project Methodology
- 2.4.1. Secondary Research
- 2.4.1.1. Annual Reports
- 2.4.1.2. Academic Research Papers
- 2.4.1.3. Company Websites
- 2.4.1.4. Investor Presentations
- 2.4.1.5. Regulatory Filings
- 2.4.1.6. White Papers
- 2.4.1.7. Industry Publications
- 2.4.1.8. Conferences and Seminars
- 2.4.1.9. Government Portals
- 2.4.1.10. Media and Press Releases
- 2.4.1.11. Newsletters
- 2.4.1.12. Industry Databases
- 2.4.1.13. Roots Proprietary Databases
- 2.4.1.14. Paid Databases and Sources
- 2.4.1.15. Social Media Portals
- 2.4.1.16. Other Secondary Sources
- 2.4.2. Primary Research
- 2.4.2.1. Types of Primary Research
- 2.4.2.1.1. Qualitative Research
- 2.4.2.1.2. Quantitative Research
- 2.4.2.1.3. Hybrid Approach
- 2.4.2.2. Advantages of Primary Research
- 2.4.2.3. Techniques for Primary Research
- 2.4.2.3.1. Interviews
- 2.4.2.3.2. Surveys
- 2.4.2.3.3. Focus Groups
- 2.4.2.3.4. Observational Research
- 2.4.2.3.5. Social Media Interactions
- 2.4.2.4. Key Opinion Leaders Considered in Primary Research
- 2.4.2.4.1. Company Executives (CXOs)
- 2.4.2.4.2. Board of Directors
- 2.4.2.4.3. Company Presidents and Vice Presidents
- 2.4.2.4.4. Research and Development Heads
- 2.4.2.4.5. Technical Experts
- 2.4.2.4.6. Subject Matter Experts
- 2.4.2.4.7. Scientists
- 2.4.2.4.8. Doctors and Other Healthcare Providers
- 2.4.2.5. Ethics and Integrity
- 2.4.2.5.1. Research Ethics
- 2.4.2.5.2. Data Integrity
- 2.4.2.1. Types of Primary Research
- 2.4.3. Analytical Tools and Databases
- 2.4.1. Secondary Research
3. ECONOMIC AND OTHER PROJECT SPECIFIC CONSIDERATIONS
- 3.1. Chapter Overview
- 3.2. Market Dynamics
- 3.2.1. Time Period
- 3.2.1.1. Historical Trends
- 3.2.1.2. Current and Future Estimates
- 3.2.2. Currency Coverage and Foreign Exchange Rate
- 3.2.2.1. Major Currencies Affecting the Market
- 3.2.2.2. Factors Affecting Currency Fluctuations and Foreign Exchange Rates
- 3.2.2.3. Impact of Foreign Exchange Rate Volatility on the Market
- 3.2.2.4. Strategies for Mitigating Foreign Exchange Risks
- 3.2.3. Trade Policies
- 3.2.3.1. Impact of Trade Barriers on the Market
- 3.2.3.2. Strategies for Mitigating the
- 3.2.1. Time Period
Risks associated with Trade Barriers
- 3.2.4. Recession
- 3.2.4.1. Historical Analysis of Past Recessions and Lessons Learnt
- 3.2.4.2. Assessment of Current Economic Conditions and Potential Impact on the Market
- 3.2.5. Inflation
- 3.2.5.1. Measurement and Analysis of Inflationary Pressures in the Economy
- 3.2.5.2. Potential Impact of Inflation on the Market Evolution
4. EXECUTIVE SUMMARY
5. INTRODUCTION
- 5.1. Chapter Overview
- 5.2. mRNA Therapeutics
- 5.2.1. Advantages of mRNA Therapeutics
- 5.2.2. Key Applications of mRNA Therapeutics
- 5.3. mRNA Vaccines
- 5.3.1. Advantages of mRNA Vaccines
- 5.3.2. Key Applications of mRNA Vaccines
- 5.4. mRNA Delivery Routes
- 5.5. mRNA Delivery Strategies
- 5.6. Key Challenges Associated with mRNA Vaccine and Therapeutics
- 5.7. Future Perspectives
6. MARKET LANDSCAPE
- 6.1. Chapter Overview
- 6.2. mRNA Vaccine and Therapeutics: Overall Market Landscape
- 6.2.1. Analysis by Phase of Development
- 6.2.2. Analysis by Type of Drug Candidate
- 6.2.3. Analysis by Therapeutic Area
- 6.2.4. Analysis by Phase of Development and Therapeutic Area
- 6.2.5. Analysis by Type of Delivery System
- 6.2.6. Analysis by Type of Molecule Encoded
- 6.2.7. Analysis by Route of Administration
- 6.2.8. Analysis by Therapeutic Area and Route of Administration
- 6.2.9. Analysis by Phase of Development, Therapeutic Area and Route of Administration
7. COMPETITIVE LANDSCAPE
- 7.1. Chapter Overview
- 7.2. mRNA Vaccine and Therapeutics: List of Developers
- 7.2.1. Analysis by Year of Establishment
- 7.2.2. Analysis by Company Size
- 7.2.3. Analysis by Location of Headquarters
- 7.2.4. Key Players: Analysis by Number of Drug Candidates
- 7.2.5. Key Players: Analysis by Phase of Development
- 7.2.6. Key Players: Analysis by Therapeutic Area
8. COMPANY COMPETITIVENESS ANALYSIS
- 8.1. Chapter Overview
- 8.2. Assumptions and Parameters
- 8.3. Methodology
- 8.4. mRNA Vaccine and Therapeutics Developers: Company Competitiveness Analysis
- 8.4.1. mRNA Vaccine and Therapeutics Developers based in North America
8. 4.2. mRNA Vaccine and Therapeutics Developers based in Europe
8. 4.3. mRNA Vaccine and Therapeutics Developers based in Asia-Pacific and Rest of the World
9. COMPANY PROFILES
- 9.1. Chapter Overview
- 9.2. Leading Companies in mRNA Vaccine and Therapeutics Market
- 9.2.1. Arcturus Therapeutics
- 9.2.1.1. Company Overview
- 9.2.1.2. Financial Information
- 9.2.1.3. Pipeline Overview
- 9.2.1.4. Recent Developments and Future Outlook
- 9.2.2. BioNTech
- 9.2.2.1. Company Overview
- 9.2.2.2. Financial Information
- 9.2.2.3. Pipeline Overview
- 9.2.2.4. Recent Developments and Future Outlook
- 9.2.3. CureVac
- 9.2.3.1. Company Overview
- 9.2.3.2. Financial Information
- 9.2.3.3. Pipeline Overview
- 9.2.3.4. Recent Developments and Future Outlook
- 9.2.4. Ethris
- 9.2.4.1. Company Overview
- 9.2.4.2. Pipeline Overview
- 9.2.4.3. Recent Developments and Future Outlook
- 9.2.5. Immorna
- 9.2.5.1. Company Overview
- 9.2.5.2. Pipeline Overview
- 9.2.5.3. Recent Developments and Future Outlook
- 9.2.6. Moderna
- 9.2.6.1. Company Overview
- 9.2.6.2. Financial Information
- 9.2.6.3. Pipeline Overview
- 9.2.6.4. Recent Developments and Future Outlook
- 9.2.7. Providence Therapeutics
- 9.2.7.1. Company Overview
- 9.2.7.2. Pipeline Overview
- 9.2.7.3. Recent Developments and Future Outlook
- 9.2.8. Suzhou Abogen Biosciences
- 9.2.8.1. Company Overview
- 9.2.8.2. Pipeline Overview
- 9.2.8.3. Recent Developments and Future Outlook
- 9.2.1. Arcturus Therapeutics
- 9.3. Other Leading Players in mRNA Vaccine and Therapeutics Market
- 9.3.1. Gennova Biopharmaceuticals
- 9.3.1.1. Company Overview
- 9.3.1.2. Pipeline Overview
- 9.3.2. Innovac Therapeutics
- 9.3.2.1. Company Overview
- 9.3.2.2. Pipeline Overview
- 9.3.3. Kernal Biologics
- 9.3.3.1. Company Overview
- 9.3.3.2. Pipeline Overview
- 9.3.4. Pantherna Therapeutics
- 9.3.4.1. Company Overview
- 9.3.4.2. Pipeline Overview
- 9.3.5. pHion Therapeutics
- 9.3.5.1. Company Overview
- 9.3.5.2. Pipeline Overview
- 9.3.6. Recode Therapeutics
- 9.3.6.1. Company Overview
- 9.3.6.2. Pipeline Overview
- 9.3.7. Rejuvenation Technologies
- 9.3.7.1. Company Overview
- 9.3.7.2. Pipeline Overview
- 9.3.8. RNACure
- 9.3.8.1. Company Overview
- 9.3.8.2. Pipeline Overview
- 9.3.9. RNAimmune
- 9.3.9.1. Company Overview
- 9.3.9.2. Pipeline Overview
- 9.3.10. Strand Therapeutics
- 9.3.10.1. Company Overview
- 9.3.10.2. Pipeline Overview
- 9.3.11. Turn Biotechnologies
- 9.3.11.1. Company Overview
- 9.3.11.3. Pipeline Overview
- 9.3.12. Walvax Biotechnology
- 9.3.12.1. Company Overview
- 9.3.12.2. Pipeline Overview
- 9.3.13. Ziphius Vaccines
- 9.3.13.1. Company Overview
- 9.3.13.2. Pipeline Overview
- 9.3.1. Gennova Biopharmaceuticals
10. BIG PHARMA INITIATIVES
- 10.1. Chapter Overview
- 10.2. Scope and Methodology
- 10.3. mRNA Related Initiatives of Big Pharmaceutical Players
- 10.3.1. Analysis by Portfolio Diversity
- 10.3.2. Analysis by Phase of Development
- 10.3.3. Analysis by Target Therapeutic Area
- 10.4. Benchmarking Analysis: Big Pharma Players
- 10.4.1. Spider Web Analysis: Amgen
- 10.4.2. Spider Web Analysis: AstraZeneca
- 10.4.3. Spider Web Analysis: Bayer
- 10.4.4. Spider Web Analysis: BioNTech
- 10.4.5. Spider Web Analysis: Eli Lilly
- 10.4.6. Spider Web Analysis: Gilead Sciences
- 10.4.7. Spider Web Analysis: GlaxoSmithKline
- 10.4.8. Spider Web Analysis: Merck
- 10.4.9. Spider Web Analysis: Moderna
- 10.4.10. Spider Web Analysis: Novartis
- 10.4.11. Spider Web Analysis: Novo Nordisk
- 10.4.12. Spider Web Analysis: Pfizer
- 10.4.13. Spider Web Analysis: Roche
- 10.4.14. Spider Web Analysis: Sanofi
- 10.4.15. Spider Web Analysis: Takeda
- 10.5. Concluding Remarks
11. START-UP HEALTH INDEXING
- 11.1. Chapter Overview
- 11.2. Start-ups focused on mRNA Vaccine and Therapeutics
- 11.2.1. Analysis by Location of Headquarters
- 11.3. Benchmarking of Start-ups
- 11.4. Start-up Health Indexing
- 11.4.1. Analysis by Supplier Strength
- 11.4.2. Analysis by Pipeline Maturity
- 11.4.3. Analysis by Pipeline Strength
- 11.4.4. Analysis by Financial Investments
- 11.4.5. Analysis by Partnership Activity
- 11.4.6. Start-ups Health Indexing: Roots Analysis Perspective
12. CLINICAL TRIAL ANALYSIS
- 12.1. Chapter Overview
- 12.2. Scope and Methodology
- 12.3. mRNA Vaccine and Therapeutics: Clinical Trial Analysis
- 12.3.1. Analysis by Trial Registration Year
- 12.3.2. Analysis by Trial Status
- 12.3.3. Analysis by Trial Phase
- 12.3.4. Analysis by Trial Registration Year and Trial Status
- 12.3.5. Analysis by Trial Registration Year and Trial Phase
- 12.3.6. Analysis by Trial Status and Trial Phase
- 12.3.7. Analysis of Enrolled Patient Population by Trial Registration Year
- 12.3.8. Analysis by Study Design
- 12.3.9. Analysis by Type of Sponsor / Collaborator
- 12.3.10. Most Active Players: Analysis by Number of Registered Trials
- 12.3.11. Analysis by Therapeutic Area
- 12.3.12. Analysis by Number of Registered Trials and Geography
- 12.3.13. Analysis by Number of Registered Trials, Trial Status and Geography
- 12.3.14. Analysis of Enrolled Patient Population by Geography
13. PARTNERSHIPS AND COLLABORATIONS
- 13.1. Chapter Overview
- 13.2. Partnership Models
- 13.3. mRNA Vaccine and Therapeutics: Partnerships and Collaborations
- 13.3.1. Analysis by Year of Partnership
- 13.3.2. Analysis by Type of Partnership
- 13.3.3. Analysis by Year and Type of Partnership
- 13.3.4. Analysis by Therapeutic Area
- 13.3.5. Analysis by Type of Partnership and Therapeutic Area
- 13.3.6. Most Active Players: Analysis by Number of Partnerships
- 13.3.7. Analysis by Geography
- 13.3.7.1. Intercontinental and Intracontinental Agreements
- 13.3.7.2. Local and International Agreements
14. FUNDING AND INVESTMENT ANALYSIS
- 14.1. Chapter Overview
- 14.2. Types of Funding
- 14.3. mRNA Vaccine and Therapeutics: Funding and Investments
- 14.3.1. Analysis by Year of Funding
- 14.3.2. Analysis by Amount Invested
- 14.3.3. Analysis by Type of Funding
- 14.3.4. Analysis by Year and Type of Funding
- 14.3.5. Analysis of Funding Instances and Amount Invested by Therapeutic Area
- 14.3.6. Analysis by Geography
- 14.3.7. Most Active Players: Analysis by Number of Funding Instances
- 14.3.8. Most Active Players: Analysis by Total Amount Raised
- 14.3.9. Most Active Investors: Analysis by Number of Funding Instances
- 14.3.10. Analysis of Amount Invested by Year and Type of Funding
15. PATENT ANALYSIS
- 15.1. Chapter Overview
- 15.2. Scope and Methodology
- 15.3. mRNA Vaccine and Therapeutics: Patent Analysis
- 15.3.1. Analysis by Type of Patent
- 15.3.2. Analysis by Patent Publication Year
- 15.3.3. Analysis of Granted Patents by Publication Year
- 15.3.4. Analysis of Patent Applications by Publication Year
- 15.3.5. Analysis of Granted Patents and Patent Applications by Publication Year
- 15.3.6. Analysis by Publication Year and Type of Applicant
- 15.3.7. Analysis by Patent Jurisdiction
- 15.3.8. Analysis by Patent Age
- 15.3.9. Analysis by CPC Symbols
- 15.3.10. Leading Players: Analysis by Number of Patents
- 15.3.11. Leading Inventors: Analysis by Number of Patents
- 15.4. Patent Benchmarking Analysis
- 15.4.1. Analysis of Patent Characteristics (CPC Codes) by Leading Industry Players
- 15.5. mRNA Vaccine and Therapeutics: Patent Valuation Analysis
16. MARKET IMPACT ANALYSIS: DRIVERS, RESTRAINTS, OPPORTUNITIES AND CHALLENGES
- 16.1. Chapter Overview
- 16.2. Market Drivers
- 16.3. Market Restraints
- 16.4. Market Opportunities
- 16.5. Market Challenges
- 16.6. Conclusion
17. GLOBAL mRNA VACCINE AND THERAPEUTICS MARKET
- 17.1. Chapter Overview
- 17.2. Assumptions and Methodology
- 17.3. Global mRNA Vaccine and Therapeutics Market, till 2035
- 17.3.1. Scenario Analysis
- 17.3.1.1. Conservative Scenario
- 17.3.1.2. Optimistic Scenario
- 17.3.1. Scenario Analysis
- 17.4. Key Market Segmentations
18. mRNA VACCINE AND THERAPEUTICS MARKET, BY APPLICATION AREA
- 18.1. Chapter Overview
- 18.2. Key Assumptions and Methodology
- 18.3. mRNA Vaccine and Therapeutics Market: Distribution by Application Area, 2024, 2028 and 2035
- 18.3.1. mRNA Vaccine and Therapeutics Market for COVID-19, till 2035
- 18.3.2. mRNA Vaccine and Therapeutics Market for Other Indications, till 2035
- 18.4. Data Triangulation and Validation
19. mRNA VACCINE AND THERAPEUTICS MARKET, BY TARGET DISEASE INDICATION
- 19.1. Chapter Overview
- 19.2. Key Assumptions and Methodology
- 19.3. mRNA Vaccine and Therapeutics Market: Distribution by Target Disease Indication, 2026, 2030 and 2035
- 19.3.1. mRNA Vaccine and Therapeutics Market for Influenza, till 2035
- 19.3.2. mRNA Vaccine and Therapeutics Market for Respiratory Syncytial Virus Infection, till 2035
- 19.3.3. mRNA Vaccine and Therapeutics Market for Cytomegalovirus Disease, till 2035
- 19.4. Data Triangulation and Validation
20. mRNA VACCINE AND THERAPEUTICS MARKET, BY GEOGRAPHICAL REGIONS
- 20.1. Chapter Overview
- 20.2. Key Assumptions and Methodology
- 20.3. mRNA Vaccine and Therapeutics Market: Distribution by Geographical Regions, 2024, 2028 and 2035
- 20.3.1. mRNA Vaccine and Therapeutics Market in North America, till 2035
- 20.3.1.1. mRNA Vaccine and Therapeutics Market in the US, till 2035
- 20.3.1.2. mRNA Vaccine and Therapeutics Market in Canada, till 2035
- 20.3.2. mRNA Vaccine and Therapeutics Market in Europe, till 2035
- 20.3.2.1. mRNA Vaccine and Therapeutics Market in Germany, till 2035
- 20.3.2.2. mRNA Vaccine and Therapeutics Market in the UK, till 2035
- 20.3.2.3. mRNA Vaccine and Therapeutics Market in France, till 2035
- 20.3.2.4. mRNA Vaccine and Therapeutics Market in Italy, till 2035
- 20.3.2.5. mRNA Vaccine and Therapeutics Market in Spain, till 2035
- 20.3.2.6. mRNA Vaccine and Therapeutics Market in Belgium, till 2035
- 20.3.3. mRNA Vaccine and Therapeutics Market in Asia-Pacific, till 2035
- 20.3.3.1. mRNA Vaccine and Therapeutics Market in China, till 2035
- 20.3.3.2. mRNA Vaccine and Therapeutics Market in India, till 2035
- 20.3.3.3. mRNA Vaccine and Therapeutics Market in Japan, till 2035
- 20.3.3.4. mRNA Vaccine and Therapeutics Market in Philippines, till 2035
- 20.3.3.5. mRNA Vaccine and Therapeutics Market in Australia, till 2035
- 20.3.4. mRNA Vaccine and Therapeutics Market in Latin America, till 2035
- 20.3.4.1. mRNA Vaccine and Therapeutics Market in Brazil, till 2035
- 20.3.5. mRNA Vaccine and Therapeutics Market in Rest of the World, till 2035
- 20.3.1. mRNA Vaccine and Therapeutics Market in North America, till 2035
- 20.4. Data Triangulation and Validation
21. CONCLUSION
22. EXECUTIVE INSIGHTS
- 22.1. Chapter Overview
- 22.2. Canvax
- 22.2.1. Company Snapshot
- 22.2.2. Interview Transcript: Business Development Manager
- 22.3. eTheRNA
- 22.3.1. Company Snapshot
- 22.3.2. Interview Transcript: Senior Director, Business Development
- 22.4. GC Biopharma
- 22.4.1. Company Snapshot
- 22.4.2. Interview Transcript: Team Leader
23. APPENDIX 1: TABULATED DATA
24. APPENDIX 2: LIST OF COMPANIES AND ORGANIZATIONS
List of Tables
- Table 6.1 mRNA Vaccine and Therapeutics: Overall Market Landscape
- Table 6.2 mRNA Vaccine and Therapeutics: Information on Type of Delivery System
- Table 6.3 mRNA Vaccine and Therapeutics: Information on Type of Molecule Encoded
- Table 6.4 mRNA Vaccine and Therapeutics: Information on Route of Administration
- Table 7.1 mRNA Vaccine and Therapeutics Developers: List of Companies
- Table 9.1 mRNA Vaccine and Therapeutics Developers: List of Companies Profiled
- Table 9.2 Arcturus Therapeutics: Company Overview
- Table 9.3 Arcturus Therapeutics: Pipeline Overview
- Table 9.4 Arcturus Therapeutics: Recent Developments and Future Outlook
- Table 9.5 BioNTech: Company Overview
- Table 9.6 BioNTech: Pipeline Overview
- Table 9.7 BioNTech: Recent Developments and Future Outlook
- Table 9.8 CureVac: Company Overview
- Table 9.9 CureVac: Pipeline Overview
- Table 9.10 CureVac: Recent Developments and Future Outlook
- Table 9.11 Ethris: Company Overview
- Table 9.12 Ethris: Pipeline Overview
- Table 9.13 Ethris: Recent Developments and Future Outlook
- Table 9.14 Immorna: Company Overview
- Table 9.15 Immorna: Pipeline Overview
- Table 9.16 Immorna: Recent Developments and Future Outlook
- Table 9.17 Moderna: Company Overview
- Table 9.18 Moderna: Pipeline Overview
- Table 9.19 Moderna: Recent Developments and Future Outlook
- Table 9.20 Providence Therapeutics: Company Overview
- Table 9.21 Providence Therapeutics: Pipeline Overview
- Table 9.22 Providence Therapeutics: Recent Developments and Future Outlook
- Table 9.23 Suzhou Abogen Biosciences: Company Overview
- Table 9.24 Suzhou Abogen Biosciences: Pipeline Overview
- Table 9.25 Suzhou Abogen Biosciences: Recent Developments and Future Outlook
- Table 9.26 Gennova Biopharmaceuticals: Company Overview
- Table 9.27 Gennova Biopharmaceuticals: Pipeline Overview
- Table 9.28 Innovac Therapeutics: Company Overview
- Table 9.29 Innovac Therapeutics: Pipeline Overview
- Table 9.30 Kernal Biologics: Company Overview
- Table 9.31 Kernal Biologics: Pipeline Overview
- Table 9.32 Pantherna Therapeutics: Company Overview
- Table 9.33 Pantherna Therapeutics: Pipeline Overview
- Table 9.34 pHion Therapeutics: Company Overview
- Table 9.35 pHion Therapeutics: Pipeline Overview
- Table 9.36 Recode Therapeutics: Company Overview
- Table 9.37 Recode Therapeutics: Pipeline Overview
- Table 9.38 Rejuvenation Technologies: Company Overview
- Table 9.39 Rejuvenation Technologies: Pipeline Overview
- Table 9.40 RNACure: Company Overview
- Table 9.41 RNACure: Pipeline Overview
- Table 9.42 RNAimmune: Company Overview
- Table 9.43 RNAimmune: Pipeline Overview
- Table 9.44 Strand Therapeutics: Company Overview
- Table 9.45 Strand Therapeutics: Pipeline Overview
- Table 9.46 Turn Biotechnologies: Company Overview
- Table 9.47 Turn Biotechnologies: Pipeline Overview
- Table 9.48 Walvax Biotechnology: Company Overview
- Table 9.49 Walvax Biotechnology: Pipeline Overview
- Table 9.50 Ziphius Vaccines: Company Overview
- Table 9.51 Ziphius Vaccines: Pipeline Overview
- Table 11.1 mRNA Vaccine and Therapeutics Start-ups: Information on Location of Headquarters
- Table 13.1 mRNA Vaccine and Therapeutics: List of Partnerships and Collaborations
- Table 13.2 mRNA Vaccine and Therapeutics: Information on Type of Agreement (Country and Region), since 2013
- Table 14.1 mRNA Vaccine and Therapeutics: List of Funding and Investments
- Table 15.1 Patent Analysis: Top CPC Sections
- Table 15.2 Patent Analysis: Top CPC Symbols
- Table 15.3 Patent Analysis: Top CPC Codes
- Table 15.4 Patent Portfolio: Summary of Benchmarking Analysis
- Table 15.5 Patent Analysis: Categorization based on Weighted Valuation Scores
- Table 15.6 Patent Portfolio: List of Leading Patents (by Highest Relative Valuation)
- Table 17.1 mRNA Vaccine and Therapeutics: Expected Launch Year of Advance Stage Drug Candidates
- Table 22.1 Canvax: Key Highlights
- Table 22.2 eTheRNA: Key Highlights
- Table 22.3 GC Biopharma: Key Highlights
- Table 23.1 mRNA Vaccine and Therapeutics: Distribution by Phase of Development
- Table 23.2 mRNA Vaccine and Therapeutics: Distribution by Type of Drug Candidate
- Table 23.3 mRNA Vaccine and Therapeutics: Distribution by Therapeutic Area
- Table 23.4 mRNA Vaccine and Therapeutics: Distribution by Phase of Development and Therapeutic Area
- Table 23.5 mRNA Vaccine and Therapeutics: Distribution by Type of Delivery System
- Table 23.6 mRNA Vaccine and Therapeutics: Distribution by Type of Molecule Encoded
- Table 23.7 mRNA Vaccine and Therapeutics: Distribution by Route of Administration
- Table 23.8 mRNA Vaccine and Therapeutics: Distribution by Therapeutic Area and Route of Administration
- Table 23.9 mRNA Vaccine and Therapeutics Developers: Distribution by Year of Establishment
- Table 23.10 mRNA Vaccine and Therapeutics Developers: Distribution by Company Size
- Table 23.11 mRNA Vaccine and Therapeutics Developers: Distribution by Location of Headquarters
- Table 23.12 Key Players: Distribution by Number of Drug Candidates
- Table 23.13 Key Players: Distribution by Phase of Development
- Table 23.14 Key Players: Distribution by Therapeutic Area
- Table 23.15 Start-up Health Indexing: Distribution by Location of Headquarters
- Table 23.16 Start-up Health Indexing: Distribution by Supplier Strength
- Table 23.17 Start-up Health Indexing: Distribution by Pipeline Maturity
- Table 23.18 Start-up Health Indexing: Distribution by Pipeline Strength
- Table 23.19 Start-up Health Indexing: Distribution by Financial Investments
- Table 23.20 Start-up Health Indexing: Distribution by Partnership Activity
- Table 23.21 Clinical Trial Analysis: Distribution by Trial Registration Year, since 2006
- Table 23.22 Clinical Trial Analysis: Distribution by Trial Status
- Table 23.23 Clinical Trial Analysis: Distribution by Trial Phase
- Table 23.24 Clinical Trial Analysis: Distribution by Trial Registration Year and Trial Status
- Table 23.25 Clinical Trial Analysis: Distribution by Trial Status and Trial Phase
- Table 23.26 Clinical Trial Analysis: Distribution of Enrolled Patient Population by Trial Registration Year, since 2006
- Table 23.27 Clinical Trial Analysis: Distribution by Study Design
- Table 23.28 Clinical Trial Analysis: Distribution by Type of Sponsor / Collaborator
- Table 23.29 Most Active Players: Distribution by Number of Registered Trials
- Table 23.30 Clinical Trial Analysis: Distribution by Therapeutic Area
- Table 23.31 Clinical Trial Analysis: Distribution by Number of Registered Trials and Geography
- Table 23.32 Clinical Trial Analysis: Distribution by Number of Registered Trials, Trial Status and Geography
- Table 23.33 Clinical Trial Analysis: Distribution of Enrolled Patient Population by Geography
- Table 23.34 Partnerships and Collaborations: Cumulative Year-wise Trend, since 2013
- Table 23.35 Partnerships and Collaborations: Distribution by Type of Partnership
- Table 23.36 Partnerships and Collaborations: Distribution by Therapeutic Area
- Table 23.37 Most Active Players: Distribution by Number of Partnerships
- Table 23.38 Partnerships and Collaborations: Local and International Agreements
- Table 23.39 Funding and Investment Analysis: Cumulative Year-wise Trend of Funding Instances, since 2010
- Table 23.40 Funding and Investment Analysis: Distribution of Amount Invested, since 2010 (USD Million)
- Table 23.41 Funding and Investment Analysis: Distribution of Funding Instances by Type of Funding
- Table 23.42 Funding and Investment Analysis: Distribution of Amount Invested by Type of Funding (USD Million)
- Table 23.43 Funding and Investment Analysis: Distribution by Year and Type of Funding
- Table 23.44 Funding and Investment Analysis: Distribution of Funding Instances and Amount Invested by Therapeutic Area
- Table 23.45 Funding and Investment Analysis: Distribution of Funding Instances and Amount Invested by Region
- Table 23.46 Funding and Investment Analysis: Distribution of Funding Instances by Country
- Table 23.47 Most Active Players: Distribution by Number of Funding Instances
- Table 23.48 Most Active Players: Distribution by Total Amount Raised (USD Million)
- Table 23.49 Most Active Investors: Distribution by Number of Funding Instances
- Table 23.50 Patent Analysis: Distribution by Type of Patent
- Table 23.51 Patent Analysis: Cumulative Distribution by Patent Publication Year, since 2016
- Table 23.52 Patent Analysis: Distribution of Granted Patents by Publication Year, since 2016
- Table 23.53 Patent Analysis: Distribution of Patent Applications by Publication Year, since 2016
- Table 23.54 Patent Analysis: Distribution by Granted Patents and Patent Applications by Publication Year, since 2016
- Table 23.55 Patent Analysis: Distribution of Patents by Publication Year and Type of Applicant, since 2016
- Table 23.56 Patent Analysis: Distribution by Patent Jurisdiction
- Table 23.57 Patent Analysis: Distribution by Patent Age
- Table 23.58 Patent Analysis: Leading Industry Players
- Table 23.59 Patent Analysis: Leading Non-Industry Players
- Table 23.60 Leading Inventors: Distribution by Number of Patents
- Table 23.61 Patent Analysis: Valuation Analysis
- Table 23.62 Global mRNA Vaccine and Therapeutics Market, Historical Trends, since 2020 (USD Million)
- Table 23.63 Global mRNA Vaccine and Therapeutics Market, till 2035, Conservative, Base and Optimistic Scenarios (USD Million)
- Table 23.64 mRNA Vaccine and Therapeutics Market: Distribution by Application Area, 2024, 2028 and 2035 (USD Million)
- Table 23.65 mRNA Vaccine and Therapeutics Market for COVID-19, till 2035, Conservative, Base and Optimistic Scenarios (USD Million)
- Table 23.66 mRNA Vaccine and Therapeutics Market for Other Indications, till 2035, Conservative, Base and Optimistic Scenarios (USD Million)
- Table 23.67 mRNA Vaccine and Therapeutics Market: Distribution by Target Disease Indication, 2026, 2030 and 2035 (USD Million)
- Table 23.68 mRNA Vaccine and Therapeutics Market for Influenza, till 2035, Conservative, Base and Optimistic Scenarios (USD Million)
- Table 23.69 mRNA Vaccine and Therapeutics Market for Respiratory Syncytial Virus Infection, till 2035, Conservative, Base and Optimistic Scenarios (USD Million)
- Table 23.70 mRNA Vaccine and Therapeutics Market for Cytomegalovirus Disease, till 2035, Conservative, Base and Optimistic Scenarios (USD Million)
- Table 23.71 mRNA Vaccine and Therapeutics Market: Distribution by Geographical Regions, 2024, 2028 and 2035 (USD Million)
- Table 23.72 mRNA Vaccine and Therapeutics Market in North America, till 2035, Conservative, Base and Optimistic Scenarios (USD Million)
- Table 23.73 mRNA Vaccine and Therapeutics Market in the US, till 2035, Conservative, Base and Optimistic Scenarios (USD Million)
- Table 23.74 mRNA Vaccine and Therapeutics Market in Canada, till 2035, Conservative, Base and Optimistic Scenarios (USD Million)
- Table 23.75 mRNA Vaccine and Therapeutics Market in Europe, till 2035, Conservative, Base and Optimistic Scenarios (USD Million)
- Table 23.76 mRNA Vaccine and Therapeutics Market in Germany, till 2035, Conservative, Base and Optimistic Scenarios (USD Million)
- Table 23.77 mRNA Vaccine and Therapeutics Market in the UK, till 2035, Conservative, Base and Optimistic Scenarios (USD Million)
- Table 23.78 mRNA Vaccine and Therapeutics Market in France, till 2035, Conservative, Base and Optimistic Scenarios (USD Million)
- Table 23.79 mRNA Vaccine and Therapeutics Market in Italy, till 2035, Conservative, Base and Optimistic Scenarios (USD Million)
- Table 23.80 mRNA Vaccine and Therapeutics Market in Spain, till 2035, Conservative, Base and Optimistic Scenarios (USD Million)
- Table 23.81 mRNA Vaccine and Therapeutics Market in Belgium, till 2035, Conservative, Base and Optimistic Scenarios (USD Million)
- Table 23.82 mRNA Vaccine and Therapeutics Market in Asia-Pacific, till 2035, Conservative, Base and Optimistic Scenarios (USD Million)
- Table 23.83 mRNA Vaccine and Therapeutics Market in China, till 2035, Conservative, Base and Optimistic Scenarios (USD Million)
- Table 23.84 mRNA Vaccine and Therapeutics Market in India, till 2035, Conservative, Base and Optimistic Scenarios (USD Million)
- Table 23.85 mRNA Vaccine and Therapeutics Market in Japan, till 2035, Conservative, Base and Optimistic Scenarios (USD Million)
- Table 23.86 mRNA Vaccine and Therapeutics Market in Philippines, till 2035, Conservative, Base and Optimistic Scenarios (USD Million)
- Table 23.87 mRNA Vaccine and Therapeutics Market in Australia, till 2035, Conservative, Base and Optimistic Scenarios (USD Million)
- Table 23.88 mRNA Vaccine and Therapeutics Market in Latin America, till 2035, Conservative, Base and Optimistic Scenarios (USD Million)
- Table 23.89 mRNA Vaccine and Therapeutics Market in Brazil, till 2035, Conservative, Base and Optimistic Scenarios (USD Million)
- Table 23.90 mRNA Vaccine and Therapeutics Market in Rest of the World, till 2035, Conservative, Base and Optimistic Scenarios (USD Million)
List of Figures
- Figure 2.1 Research Methodology: Project Methodology
- Figure 2.2 Research Methodology: Data Sources for Secondary Research
- Figure 3.1 Lessons Learnt from Past Recessions
- Figure 4.1 Executive Summary: Current Market Landscape
- Figure 4.2 Executive Summary: Developer Landscape
- Figure 4.3 Executive Summary: Clinical Trial Analysis
- Figure 4.4 Executive Summary: Partnerships and Collaborations
- Figure 4.5 Executive Summary: Funding and Investment Analysis
- Figure 4.6 Executive Summary: Patent Analysis
- Figure 4.7 Executive Summary: Market Forecast and Opportunity Analysis
- Figure 5.1 Historical Evolution of mRNA
- Figure 5.2 Key Applications of mRNA Therapeutics
- Figure 6.1 mRNA Vaccine and Therapeutics: Distribution by Phase of Development
- Figure 6.2 mRNA Vaccine and Therapeutics: Distribution by Type of Drug Candidate
- Figure 6.3 mRNA Vaccine and Therapeutics: Distribution by Therapeutic Area
- Figure 6.4 mRNA Vaccine and Therapeutics: Distribution by Phase of Development and Therapeutic Area
- Figure 6.5 mRNA Vaccine and Therapeutics: Distribution by Type of Delivery System
- Figure 6.6 mRNA Vaccine and Therapeutics: Distribution by Type of Molecule Encoded
- Figure 6.7 mRNA Vaccine and Therapeutics: Distribution by Route of Administration
- Figure 6.8 mRNA Vaccine and Therapeutics: Distribution by Therapeutic Area and Route of Administration
- Figure 6.9 mRNA Vaccine and Therapeutics: Distribution by Phase of Development, Therapeutic Area and Route of Administration
- Figure 7.1 mRNA Vaccine and Therapeutics Developers: Distribution by Year of Establishment
- Figure 7.2 mRNA Vaccine and Therapeutics Developers: Distribution by Company Size
- Figure 7.3 mRNA Vaccine and Therapeutics Developers: Distribution by Location of Headquarters
- Figure 7.4 Key Players: Distribution by Number of Drug Candidates
- Figure 7.5 Key Players: Distribution by Phase of Development
- Figure 7.6 Key Players: Distribution by Therapeutic Area
- Figure 8.1 Company Competitiveness Analysis: mRNA Vaccine and Therapeutics Developers based in North America
- Figure 8.2 Company Competitiveness Analysis: mRNA Vaccine and Therapeutics Developers based in Europe
- Figure 8.3 Company Competitiveness Analysis: mRNA Vaccine and Therapeutics Developers based in Asia-Pacific and Rest of the World
- Figure 9.1 Arcturus Therapeutics: Business Segment-wise Revenues and Consolidated Financial Details (USD Million)
- Figure 9.2 BioNTech: Business Segment-wise Revenues and Consolidated Financial Details (EUR Million)
- Figure 9.3 CureVac: Annual Revenues and Consolidated Financial Details (EUR Million)
- Figure 9.4 Moderna: Business Segment-wise Revenues and Consolidated Financial Details (EUR Million)
- Figure 10.1 Big Pharma Players: Distribution of Top Pharmaceutical Companies
- Figure 10.2 Big Pharma Players: Distribution by Portfolio Diversity
- Figure 10.3 Big Pharma Players: Distribution by Phase of Development
- Figure 10.4 Big Pharma Players: Distribution by Target Therapeutic Area
- Figure 10.5 Spider Web Analysis: Amgen
- Figure 10.6 Spider Web Analysis: AstraZeneca
- Figure 10.7 Spider Web Analysis: Bayer
- Figure 10.8 Spider Web Analysis: BioNTech
- Figure 10.9 Spider Web Analysis: Eli Lilly
- Figure 10.10 Spider Web Analysis: Gilead Sciences
- Figure 10.11 Spider Web Analysis: GlaxoSmithKline
- Figure 10.12 Spider Web Analysis: Merck
- Figure 10.13 Spider Web Analysis: Moderna
- Figure 10.14 Spider Web Analysis: Novartis
- Figure 10.15 Spider Web Analysis: Novo Nordisk
- Figure 10.16 Spider Web Analysis: Pfizer
- Figure 10.17 Spider Web Analysis: Roche
- Figure 10.18 Spider Web Analysis: Sanofi
- Figure 10.19 Spider Web Analysis: Takeda
- Figure 11.1 Start-up Health Indexing: Distribution by Location of Headquarters
- Figure 11.2 Start-up Health Indexing: Distribution by Supplier Strength
- Figure 11.3 Start-up Health Indexing: Distribution by Pipeline Maturity
- Figure 11.4 Start-up Health Indexing: Distribution by Pipeline Strength
- Figure 11.5 Start-up Health Indexing: Distribution by Financial Investments
- Figure 11.6 Start-up Health Indexing: Distribution by Partnership Activity
- Figure 11.7 Start-up Health Indexing: Roots Analysis Perspective
- Figure 11.8 Start-up Health Indexing: Leading Companies
- Figure 12.1 Clinical Trial Analysis: Distribution by Trial Registration Year, since 2006
- Figure 12.2 Clinical Trial Analysis: Distribution by Trial Status
- Figure 12.3 Clinical Trial Analysis: Distribution by Trial Phase
- Figure 12.4 Clinical Trial Analysis: Distribution by Trial Registration Year and Trial Status
- Figure 12.5 Clinical Trial Analysis: Distribution by Trial Registration Year and Trial Phase
- Figure 12.6 Clinical Trial Analysis: Distribution by Trial Status and Trial Phase
- Figure 12.7 Clinical Trial Analysis: Distribution of Enrolled Patient Population by Trial Registration Year
- Figure 12.8 Clinical Trial Analysis: Distribution by Study Design
- Figure 12.9 Clinical Trial Analysis: Distribution by Type of Sponsor / Collaborator
- Figure 12.10 Most Active Players: Distribution by Number of Registered Trials
- Figure 12.11 Clinical Trial Analysis: Distribution by Therapeutic Area
- Figure 12.12 Clinical Trial Analysis: Distribution by Number of Registered Trials and Geography
- Figure 12.13 Clinical Trial Analysis: Distribution by Number of Registered Trials, Trial Status and Geography
- Figure 12.14 Clinical Trial Analysis: Distribution of Enrolled Patient Population by Geography
- Figure 13.1 Partnerships and Collaborations: Cumulative Year-wise Trend, since 2013
- Figure 13.2 Partnerships and Collaborations: Distribution by Type of Partnership
- Figure 13.3 Partnerships and Collaborations: Distribution by Year and Type of Partnership
- Figure 13.4 Partnerships and Collaborations: Distribution by Therapeutic Area
- Figure 13.5 Partnerships and Collaborations: Distribution by Type of Partnership and Therapeutic Area
- Figure 13.6 Most Active Players: Distribution by Number of Partnerships
- Figure 13.7 Partnerships and Collaborations: Intercontinental and Intracontinental Agreements
- Figure 13.8 Partnerships and Collaborations: Local and International Agreements
- Figure 14.1 Funding and Investment Analysis: Cumulative Year-wise Trend, since 2010
- Figure 14.2 Funding and Investment Analysis: Distribution of Amount Invested, since 2010 (USD Million)
- Figure 14.3 Funding and Investment Analysis: Distribution of Funding Instances by Type of Funding
- Figure 14.4 Funding and Investment Analysis: Distribution of Amount Invested by Type of Funding (USD Million)
- Figure 14.5 Funding and Investment Analysis: Distribution by Year and Type of Funding
- Figure 14.6 Funding and Investment Analysis: Distribution of Funding Instances and Amount Invested by Therapeutic Area
- Figure 14.7 Funding and Investment Analysis: Distribution of Funding Instances and Amount Invested by Region
- Figure 14.8 Funding and Investment Analysis: Distribution of Funding Instances by Country
- Figure 14.9 Most Active Players: Distribution by Number of Funding Instances
- Figure 14.10 Most Active Players: Distribution by Total Amount Raised (USD Million)
- Figure 14.11 Most Active Investors: Distribution by Number of Funding Instances
- Figure 14.12 Funding and Investment Analysis: Distribution of Amount Invested by Year and Type of Funding
- Figure 15.1 Patent Analysis: Distribution by Type of Patent
- Figure 15.2 Patent Analysis: Distribution by Patent Publication Year, since 2016
- Figure 15.3 Patent Analysis: Cumulative Distribution of Granted Patents by Publication Year, since 2016
- Figure 15.4 Patent Analysis: Cumulative Distribution of Patent Applications by Publication Year, since 2016
- Figure 15.5 Patent Analysis: Distribution of Granted Patents and Patent Applications by Publication Year, since 2016
- Figure 15.6 Patent Analysis: Cumulative Distribution of Patents by Publication Year and Type of Applicant, since 2016
- Figure 15.7 Patent Analysis: Distribution by Patent Jurisdiction
- Figure 15.8 Patent Analysis: Distribution by Patent Age
- Figure 15.9 Patent Analysis: Distribution by CPC Sections
- Figure 15.10 Patent Analysis: Leading Industry Players
- Figure 15.11 Patent Analysis: Leading Non-Industry Players
- Figure 15.12 Leading Inventors: Distribution by Number of Patents
- Figure 15.13 Patent Benchmarking: Distribution of Leading Industry Players by Patent Characteristics (CPC Codes)
- Figure 15.14 Patent Analysis: Patent Valuation
- Figure 16.1 mRNA Vaccine and Therapeutics: Market Drivers
- Figure 16.2 mRNA Vaccine and Therapeutics: Market Restraints
- Figure 16.3 mRNA Vaccine and Therapeutics: Market Opportunities
- Figure 16.4 mRNA Vaccine and Therapeutics: Market Challenges
- Figure 17.1 Global mRNA Vaccine and Therapeutics Market, till 2035 (USD Million)
- Figure 17.2 Global mRNA Vaccine and Therapeutics Market, till 2035: Conservative Scenario (USD Million)
- Figure 17.3 Global mRNA Vaccine and Therapeutics Market, till 2035: Optimistic Scenario (USD Million)
- Figure 18.1 mRNA Vaccine and Therapeutics Market: Distribution by Application Area, 2024, 2028 and 2035
- Figure 18.2 mRNA Vaccine and Therapeutics Market for COVID-19, till 2035 (USD Million)
- Figure 18.3 mRNA Vaccine and Therapeutics Market for Other Indications, till 2035 (USD Million)
- Figure 19.1 mRNA Vaccine and Therapeutics Market: Distribution by Target Disease Indication, 2026, 2030 and 2035
- Figure 19.2 mRNA Vaccine and Therapeutics Market for Influenza, till 2035 (USD Million)
- Figure 19.3 mRNA Vaccine and Therapeutics Market for Respiratory Syncytial Virus Infection, till 2035 (USD Million)
- Figure 19.4 mRNA Vaccine and Therapeutics Market for Cytomegalovirus Diseases, till 2035 (USD Million)
- Figure 20.1 mRNA Vaccine and Therapeutics Market: Distribution by Geographical Regions, 2024, 2028 and 2035
- Figure 20.2 mRNA Vaccine and Therapeutics Market in North America, till 2035 (USD Million)
- Figure 20.3 mRNA Vaccine and Therapeutics Market in the US, till 2035 (USD Million)
- Figure 20.4 mRNA Vaccine and Therapeutics Market in Canada, till 2035 (USD Million)
- Figure 20.5 mRNA Vaccine and Therapeutics Market in Europe, till 2035 (USD Million)
- Figure 20.6 mRNA Vaccine and Therapeutics Market in Germany, till 2035 (USD Million)
- Figure 20.7 mRNA Vaccine and Therapeutics Market in the UK, till 2035 (USD Million)
- Figure 20.8 mRNA Vaccine and Therapeutics Market in France, till 2035 (USD Million)
- Figure 20.9 mRNA Vaccine and Therapeutics Market in Italy, till 2035 (USD Million)
- Figure 20.10 mRNA Vaccine and Therapeutics Market in Spain, till 2035 (USD Million)
- Figure 20.11 mRNA Vaccine and Therapeutics Market in Belgium, till 2035 (USD Million)
- Figure 20.12 mRNA Vaccine and Therapeutics Market in Asia-Pacific, till 2035 (USD Million)
- Figure 20.13 mRNA Vaccine and Therapeutics Market in China, till 2035 (USD Million)
- Figure 20.14 mRNA Vaccine and Therapeutics Market in India, till 2035 (USD Million)
- Figure 20.15 mRNA Vaccine and Therapeutics Market in Japan, till 2035 (USD Million)
- Figure 20.16 mRNA Vaccine and Therapeutics Market in Philippines, till 2035 (USD Million)
- Figure 20.17 mRNA Vaccine and Therapeutics Market in Australia, till 2035 (USD Million)
- Figure 20.18 mRNA Vaccine and Therapeutics Market in Latin America, till 2035 (USD Million)
- Figure 20.19 mRNA Vaccine and Therapeutics Market in Brazil, till 2035 (USD Million)
- Figure 20.20 mRNA Vaccine and Therapeutics Market in Rest of the World, till 2035 (USD Million)
- Figure 21.1 Concluding Remarks: Market Landscape
- Figure 21.2 Concluding Remarks: Clinical Trial Analysis
- Figure 21.3 Concluding Remarks: Partnerships and Collaborations
- Figure 21.4 Concluding Remarks: Funding and Investment Analysis
- Figure 21.5 Concluding Remarks: Patent Analysis
- Figure 21.6 Concluding Remarks: Market Forecast and Opportunity Analysis
 下一代疫苗技术市场分析及预测(至2035年):按类型、产品类型、技术、应用、最终用户、组件、设备、製程、部署类型和解决方案划分
 全球mRNA疫苗市场:市场规模、占有率、成长率、产业分析、依类型、应用和地区划分的考量因素以及未来预测(2026-2034)
 动物mRNA疫苗:全球市场份额和排名、总收入和需求预测(2025-2031年)
 全球mRNA疫苗和疗法市场:预测至2032年-按产品、结构、递送系统、给药途径、应用、最终用户和地区进行分析
 mRNA 疫苗市场-全球产业规模、份额、趋势、机会和预测,按 mRNA 类型、应用、地区和竞争细分,2020-2030 年自扩增 RNA 合成市场-全球产业规模、份额、趋势、机会和预测(按产品与服务、应用、最终用户、地区和竞争细分,2020-2030 年)
 mRNA 疫苗和治疗市场报告(按疫苗类型、治疗类型、疫苗製造、应用、最终用户和地区)2025 年至 2033 年
 全球自扩增 RNA 合成市场:市场规模、份额、趋势分析(按产品/服务、应用、最终用途和地区)、细分市场预测(2025-2030 年)
 mRNA 疫苗市场按技术类型、给药途径、製造流程、疫苗分类、应用领域、最终用户和分销管道划分 - 2025 年至 2030 年全球预测
 mRNA 疫苗和治疗市场规模、占有率、趋势、行业分析报告(按类型、应用、治疗类型、最终用户和地区)- 市场预测,2025-2034 年