


 |
市场调查报告书
商品编码
1643957
可再生/永续的实验用塑胶製品市场: 各塑胶类型,各聚合物类型,各塑胶产品类型,各终端用户,与各地区:2035年前的产业趋势与全球预测Renewable / Sustainable Laboratory Plasticware Market: Industry Trends and Global Forecasts, till 2035 - Distribution by Type of Plastic, Type of Polymer, Type of Plasticware, End User and Geography |
||||||
全球永续实验室塑胶市场规模预计将从目前的 4.7 亿美元成长到 2035 年的 26.9 亿美元,预测期内的复合年增长率为 19%。
永续/可再生塑胶实验室器具是指在设计时注重在整个生命週期内减少对环境的影响的实验室器具。该实验室用具旨在减少对传统实验室塑胶的依赖,传统实验室塑胶完全由石化产品製成,而石化产品是塑胶废物的主要来源。研究表明,生物医学和科学实验室每年产生约 550 万吨塑胶垃圾。这凸显了实验室设备生产中采用环保材料的迫切需求。
永续实验室塑胶产品采用至少 90% 经过认证的生物基原料塑胶製成。这些环保选择还具有更高的可回收性、可生物降解性和可重复使用性。采用永续实验室耗材不仅可以大幅减少科学研究和工业实验室运作的生态足迹,还能解决日益增加的监管压力和永续发展目标。此外,采用永续实验室用具有助于维持实验室环境所需的最高品质、安全和性能标准。永续实验室用具的例子包括生物基/可生物降解的塑胶实验室用具、再生实验室塑胶和其他可回收实验室用品。
在对更环保解决方案的需求、实验室塑胶的持续创新以及对塑胶实验室器具可持续性的日益关注的推动下,全球范围内对可再生/可持续实验室塑胶的采用正在增加。此外,向环保实验室设备的转变已成为一种必要而非选择,进一步推动了永续实践的整合,并为未来几年市场的稳定成长奠定了基础。
本报告提供全球可再生/永续的实验用塑胶製品市场相关调查,提供市场概要,以及各塑胶类型,各聚合物类型,各塑胶产品类型,各终端用户,各地区的趋势,及加入此市场的主要企业简介等资讯。
目录
章节I:报告概要
第1章 范围和目的
第2章 调查手法
第3章 市场动态
第4章 宏观经济指标
章节II:定性的洞察
第5章 摘要整理
第6章 简介
章节III:市场概要
第7章 市场形势:可再生/永续的实验用塑胶製品供应商
章节IV:企业简介
第8章 企业简介
- 章概要
- Corning
- Diversified Biotech
- Eppendorf
- Green Elephant Biotech
- Labcon
- Polycarbin
- QIAGEN
- Thermo Fisher Scientific
第5章 市场趋势与策略工具
第9章 可再生/永续的实验用塑胶製品市场:进行中的宏观趋势概要
第10章 价值链分析
第6章 市场机会分析
第11章 对市场的影响分析:促进因素,阻碍因素,机会,课题
第12章 全球可再生/永续的实验用塑胶製品市场
第13章 可再生/永续的实验用塑胶製品市场(各塑胶类型)
第14章 可再生/永续的实验用塑胶製品市场(各类聚合物)
第15章 可再生/永续的实验用塑胶製品市场(各塑胶产品类型)
第16章 可再生/永续的实验用塑胶製品市场(各终端用户)
第17章 可再生/永续的实验用塑胶製品市场(各地区)
第8章 其他的垄断的洞察
第18章 来自1次调查的洞察
第9章 附录
第19章 表格形式的资料
第20章 企业·团体一览
SUSTAINABLE LABORATORY PLASTICWARE MARKET:
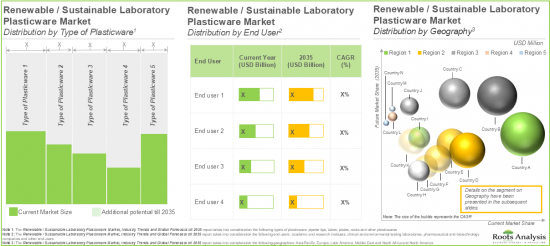
As per Roots Analysis, the global sustainable laboratory plasticware market size is estimated to grow from USD 0.47 billion in the current year to USD 2.69 billion by 2035, at a CAGR of 19% during the forecast period, till 2035.
The opportunity for the sustainable laboratory plasticware market has been distributed across the following segments:
- Type of Plastic
- Bioplastic
- Recycled Plastic
- Other Plastics
- Type of Polymer
- Polyethylene
- Polypropylene
- Polystyrene
- Other Polymers
- Type of Plasticware
- Pipette Tips
- Tubes
- Plates
- Racks
- Other Plasticwares
- End User
- Academic and Research Institutes
- Clinical and Environmental Testing Laboratories
- Pharmaceutical and Biotechnology Companies
- Other End Users
- Geography
- North America (US, Canada)
- Europe (Germany, France, Italy, UK, Netherlands, Spain)
- Asia-Pacific (China, India, Japan)
- Latin America (Argentina, Brazil)
- MENA (Egypt, Saudi Arabia and UAE)
RENEWABLE / SUSTAINABLE LABORATORY PLASTICWARE MARKET: GROWTH AND TRENDS
Sustainable / renewable plastic labware refers to lab products designed with an emphasis on reducing environmental impact throughout their life cycle. This labware aims to lower the dependency on traditional lab plastics, which are solely derived from petrochemicals contributing significantly to plastic waste. Research indicates that biomedical and scientific labs generate around 5.5 million tons of plastic waste annually. This highlights the urgent need for the adoption of eco-friendly materials for the production of labware.
Sustainable laboratory plasticwares are produced using at least 90% certified plastic from bio-based raw materials. These eco-friendly options also feature enhanced recyclability, biodegradability, and reusability. The adoption of sustainable lab consumables not only significantly reduces the ecological footprint of scientific research and industrial laboratory operations but also addresses the growing regulatory pressures and sustainability goals. Additionally, adopting sustainable labware maintains the highest standards of quality, safety, and performance essential in laboratory settings. Examples of sustainable labware include bio-based / biodegradable laboratory plasticware, recycled lab plastics, and other recyclable laboratory supplies.
Driven by the need for greener solutions, ongoing innovations in laboratory plasticware, and a rising focus on plastic labware sustainability, the adoption of renewable / sustainable laboratory plasticwares is increasing globally. Moreover, the shift toward eco-friendly labware has become a necessity rather than a choice, further driving the integration of sustainable practices and positioning the market for steady growth in the forthcoming years.
RENEWABLE / SUSTAINABLE LABORATORY PLASTICWARE MARKET: KEY INSIGHTS
The report delves into the current state of the renewable / sustainable laboratory plasticware market and identifies potential growth opportunities within the industry. Some key findings from the report include:
1.Several companies across the world are providing a diverse range of eco-friendly plastic labwares for various industrial applications, creating new avenues to reduce dependence on fossil fuels
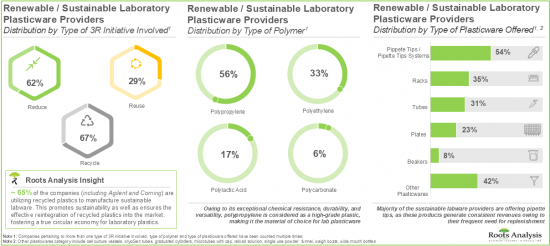
2.Close to 55% of the sustainable laboratory plasticware providers offer pipette tips / pipette tips systems made from different eco-friendly polymers, while adhering to the principles of the 3Rs (Reduce, Reuse, Recycle).
3.Sustainable / renewable laboratory plasticware market is experiencing significant growth, driven by increasing demand for eco-friendly labware and mounting regulatory pressure on laboratories to adopt sustainable materials.
4.Given the rising adoption of sustainable lab plastics and ongoing innovations in the domain, the renewable / sustainable laboratory plasticware market is anticipated to witness a growth of 19.0% till 2035.
5.The market opportunity is projected to be well distributed across various segments, such as type of plasticware, end users and geography; Asia-Pacific is anticipated to grow at a higher CAGR during the forecast period.
RENEWABLE / SUSTAINABLE LABORATORY PLASTICWARE MARKET: KEY SEGMENTS
Recycled Plastics based Labware is the Fastest Growing Segment of the Renewable / Sustainable Laboratory Plasticware Market
Based on the type of plastic, the global market for renewable / sustainable laboratory plasticware is segmented into bioplastic, recycled plastic and other plastics. Currently, the majority share of the renewable / sustainable laboratory plasticware market is captured by bioplastic based labware segment. It is worth mentioning that the recycled plastics based labware segment is likely to grow at a relatively higher CAGR in the coming years.
Polypropylene is Likely to Dominate the Renewable / Sustainable Laboratory Plasticware Market During the Forecast Period
Based on the type of polymer, the global market for renewable / sustainable laboratory plasticware is distributed across various types of polymers, such as polyethylene, polypropylene, polystyrene and other polymers. Currently, the polypropylene segment holds a majority share of the market and is expected to grow at a substantial rate during the forecast period. This can be attributed to various properties of polypropylene, including chemical resistance, durability, and versatility across a wide range of laboratory applications, making it the preferred material for plasticware production.
Pipette Tips is Likely to Hold the Largest Share of the Renewable / Sustainable Laboratory Plasticware Market During the Forecast Period
Based on the type of plasticware, the global market for renewable / sustainable laboratory plasticware is segmented into pipette tips, tubes, plates, racks and other plasticwares. Currently, the pipette tips segment is likely to dominate and drive overall market growth. It is likely to witness substantial growth during the forecast period. This can be attributed to continuous revenues generated from pipette tips and substantial innovations to develop sustainable tips, including those made from compostable and recyclable materials.
Academic and Research Institutes Segment is Likely to Grow at a Relatively Faster Pace During the Forecast Period
Based on the end users, the global market for renewable / sustainable laboratory plasticware is segmented across academic and research institutes, clinical and environmental testing laboratories, pharmaceutical and biotechnology companies and other end users. While the pharmaceutical and biotechnology segment is expected to dominate the overall market, it is worth highlighting that the academic and research institutes segment is expected to grow at a relatively higher CAGR.
Europe Accounts for the Largest Share of the Market
Based on geography, the market is segmented into North America, Europe, Asia-Pacific, Latin America and Middle East and North Africa. In the current scenario, Europe is likely to capture the largest market share. However, the renewable / sustainable laboratory plasticware market in Asia-Pacific is expected to grow at a higher CAGR during the forecast period.
Example Players in the Renewable / Sustainable Laboratory Plasticware Market
- Accumax Lab Devices
- Agilent
- Biotix
- BRAND
- Corning
- Diversified Biotech
- Eppendorf
- Gilson
- Green Elephant Biotech
- Greiner Bio-One
- Labcon
- METTLER TOLEDO
- Polycarbin
- QIAGEN
- Thermo Fisher Scientific
RENEWABLE / SUSTAINABLE LABORATORY PLASTICWARE MARKET: RESEARCH COVERAGE
The report on renewable / sustainable laboratory plasticware market features insights into various sections, including:
- Market Sizing and Opportunity Analysis: An in-depth analysis of the renewable / sustainable laboratory plasticware market, focusing on key market segments, including [A] type of plastic, [B] type of polymer, [C] type of plasticware, [D] end user, and [E] geography.
- Market Impact Analysis: A thorough analysis of various factors, such as drivers, restraints, opportunities, and existing challenges that are likely to impact market growth.
- Renewable / Sustainable Laboratory Plasticware Providers Market Landscape: A comprehensive evaluation of companies offering renewable / sustainable laboratory plasticware, based on several relevant parameters, such as [A] year of establishment, [B] company size, [C] location of headquarters, [D] type of 3R initiative involved, [E] type of polymer, and [F] type of plasticware offered.
- Company Profiles: Elaborate profiles of prominent players engaged in this domain across various geographies, featuring details regarding [A] company overviews, [B] sustainable laboratory plasticware portfolio, [C] recent developments and [D] an informed future outlook.
- Megatrends: An evaluation of ongoing megatrends in sustainable plastic labware industry, including [A] adoption of bio-based and biodegradable materials, [B] technological innovations in material science, [C] optimizing the plastic content in labware, [D] shift towards reusable labware, [E] emphasis on circular economy initiatives and [F] the evolving regulatory guidelines.
- Value Chain Analysis: A detailed analysis of the value chain including various steps involved in the production of renewable / sustainable laboratory plasticwares, along with the stakeholders involved at each step.
KEY QUESTIONS ANSWERED IN THIS REPORT
- How many companies are currently engaged in this market?
- Which are the leading companies in this market?
- What factors are likely to influence the evolution of this market?
- What is the current and future market size?
- What is the CAGR of this market?
- How is the current and future market opportunity likely to be distributed across key market segments?
REASONS TO BUY THIS REPORT
- The report provides a comprehensive market analysis, offering detailed revenue projections of the overall market and its specific sub-segments. This information is valuable to both established market leaders and emerging entrants.
- Stakeholders can leverage the report to gain a deeper understanding of the competitive dynamics within the market. By analyzing the competitive landscape, businesses can make informed decisions to optimize their market positioning and develop effective go-to-market strategies.
- The report offers stakeholders a comprehensive overview of the market, including key drivers, barriers, opportunities, and challenges. This information empowers stakeholders to stay abreast of market trends and make data-driven decisions to capitalize on growth prospects.
ADDITIONAL BENEFITS
- Complimentary PPT Insights Packs
- Complimentary Excel Data Packs for all Analytical Modules in the Report
- 10% Free Content Customization
- Detailed Report Walkthrough Session with Research Team
- Free Updated report if the report is 6-12 months old or older
TABLE OF CONTENTS
SECTION I: REPORT OVERVIEW
1. SCOPE AND OBJECTIVES
- 1.1. Context
- 1.2. Project Objectives
2. RESEARCH METHODOLOGY
- 2.1. Research Assumptions
- 2.1.1. Market Landscape and Market Trends
- 2.1.2. Market Forecast and Opportunity Analysis
- 2.1.3. Comparative Analysis
- 2.2. Database Building
- 2.2.1. Data Collection
- 2.2.2. Data Validation
- 2.2.3. Data Analysis
- 2.3. Project Methodology
- 2.3.1. Project Commencement
- 2.3.2. Secondary Research
- 2.3.2.1. Annual Reports
- 2.3.2.2. Academic Research Papers
- 2.3.2.3. Company Websites
- 2.3.2.4. Investor Presentations and Regulatory Filings
- 2.3.2.5. White Papers
- 2.3.2.6. Industry Publications
- 2.3.2.7. Conferences and Seminars
- 2.3.2.8. Government Portals
- 2.3.2.9. Media and Press Releases
- 2.3.2.10. Newsletters
- 2.3.2.11. Industry and Paid Databases
- 2.3.2.12. Roots Proprietary Databases
- 2.3.3. Primary Research
- 2.3.4. Data Analysis and Interpretation
- 2.3.5. Market Forecast and Validation
- 2.3.6. Report Compilation
- 2.4. Research Ethics and Integrity
- 2.5. Analytical Tools and Databases
- 2.6. Robust Quality Control Framework
3. MARKET DYNAMICS
- 3.1. Forecast Methodology
- 3.1.1. Top-Down Approach
- 3.1.2. Bottom-Up Approach
- 3.1.3. Hybrid Approach
- 3.2. Market Assessment Framework
- 3.2.1. Total Addressable Market (TAM)
- 3.2.2. Serviceable Addressable Market (SAM)
- 3.2.3. Serviceable Obtainable Market (SOM)
- 3.2.4. Currently Acquired Market (CAM)
- 3.3. Forecasting Tools and Techniques
- 3.3.1. Qualitative Forecasting
- 3.3.2. Correlation
- 3.3.3. Regression
- 3.3.4. Extrapolation
- 3.3.5. Convergence
- 3.3.6. Sensitivity Analysis
- 3.3.7. Scenario Planning
- 3.3.8. Data Visualization
- 3.3.9. Time Series Analysis
- 3.3.10. Forecast Error Analysis
- 3.4. Key Considerations
- 3.4.1. Demographics
- 3.4.2. Economic Factors
- 3.4.3. Competitive Landscape
- 3.4.4. Government Regulations and Policies
- 3.4.5. R&D Investment
- 3.4.6. Technological Factors
- 3.4.7. Industry Consolidation
- 3.4.8. Supply Chain
- 3.4.9. Market Access
- 3.4.10. Pandemics / Unforeseen Disruptions Impact
4. MACRO-ECONOMIC INDICATORS
- 4.1. Market Dynamics
- 4.1.1. Time Period
- 4.1.1.1. Historical Trends
- 4.1.1.2. Current and Forecasted Estimates
- 4.2.2. Currency Coverage
- 4.2.2.1. Overview of Major Currencies Affecting the Market
- 4.2.2.2. Impact of Currency Fluctuations on the Industry
- 4.2.3. Foreign Exchange Impact
- 4.2.3.1. Evaluation of Foreign Exchange Rates and Their Impact on Market
- 4.2.3.2. Strategies for Mitigating Foreign Exchange Risk
- 4.2.4. Recession
- 4.2.4.1. Historical Analysis of Past Recessions and Lessons Learnt
- 4.2.4.2. Assessment of Current Economic Conditions and Potential Impact on the Market
- 4.2.5. Inflation
- 4.2.5.1. Measurement and Analysis of Inflationary Pressures in the Economy
- 4.2.5.2. Potential Impact of Inflation on the Market Evolution
- 4.2.6. Other Indicators
- 4.2.6.1. War Impact Analysis
- 4.2.6.2. Cross-border Dynamics
- 4.2.6.3. Consumer Spendings and Gross Domestic Product
- 4.2.6.4. Stock Market Performance
- 4.1.1. Time Period
SECTION II: QUALITATIVE INSIGHTS
5. EXECUTIVE SUMMARY
6. INTRODUCTION
- 6.1. An Overview of Renewable / Sustainable Laboratory Plasticware
- 6.2. Production Process of Renewable / Sustainable Laboratory Plasticware
- 6.3. Types of Renewable / Sustainable Plastics for Labware Production
- 6.4. Advantages of Renewable / Sustainable Laboratory Plasticwares
- 6.5. Applications of Renewable / Sustainable Laboratory Plasticwares
- 6.6. Key Challenges in Renewable / Sustainable Laboratory Plasticware Domain
- 6.7. Future Perspectives
SECTION III: MARKET OVERVIEW
7. MARKET LANDSCAPE: RENEWABLE / SUSTAINABLE LABORATORY PLASTICWARE PROVIDERS
- 7.1. Methodology and Key Parameters
- 7.2. Renewable / Sustainable Laboratory Plasticware Providers: Overall Market Landscape
- 7.2.1. Analysis by Year of Establishment
- 7.2.2. Analysis by Company Size
- 7.2.3. Analysis by Location of Headquarters
- 7.2.4. Analysis by Type of 3R Initiative Involved
- 7.2.5. Analysis by Type of Polymer
- 7.2.6. Analysis by Type of Plasticware Offered
SECTION IV: COMPANY PROFILES
8. COMPANY PROFILES
- 8.1. Chapter Overview
- 8.2. Corning
- 8.2.1. Company Overview
- 8.2.2. Company Mission
- 8.2.3. Company Footprint
- 8.2.4. Management Team
- 8.2.5. Contact Details
- 8.2.6. Operating Business Segments
- 8.2.7. Renewable / Sustainable Laboratory Plasticware Portfolio
- 8.2.8. Recent Developments and Future Outlook
- 8.3. Diversified Biotech
- 8.3.1. Company Overview
- 8.3.2. Company Mission
- 8.3.3. Company Footprint
- 8.3.4. Management Team
- 8.3.5. Contact Details
- 8.3.6. Renewable / Sustainable Laboratory Plasticware Portfolio
- 8.3.7. Recent Developments and Future Outlook
- 8.4. Eppendorf
- 8.4.1. Company Overview
- 8.4.2. Company Mission
- 8.4.3. Company Footprint
- 8.4.4. Management Team
- 8.4.5. Contact Details
- 8.4.6. Operating Business Segments
- 8.4.7. Renewable / Sustainable Laboratory Plasticware Portfolio
- 8.4.8. Recent Developments and Future Outlook
- 8.5. Green Elephant Biotech
- 8.5.1. Company Overview
- 8.5.2. Company Mission
- 8.5.3. Company Footprint
- 8.5.4. Management Team
- 8.5.5. Contact Details
- 8.5.6. Renewable / Sustainable Laboratory Plasticware Portfolio
- 8.5.7. Recent Developments and Future Outlook
- 8.6. Labcon
- 8.6.1. Company Overview
- 8.6.2. Company Mission
- 8.6.3. Company Footprint
- 8.6.4. Management Team
- 8.6.5. Contact Details
- 8.6.6. Renewable / Sustainable Laboratory Plasticware Portfolio
- 8.6.7. Recent Developments and Future Outlook
- 8.7. Polycarbin
- 8.7.1. Company Overview
- 8.7.2. Company Mission
- 8.7.3. Company Footprint
- 8.7.4. Management Team
- 8.7.5. Contact Details
- 8.7.6. Renewable / Sustainable Laboratory Plasticware Portfolio
- 8.7.7. Recent Developments and Future Outlook
- 8.8. QIAGEN
- 8.8.1. Company Overview
- 8.8.2. Company Mission
- 8.8.3. Company Footprint
- 8.8.4. Management Team
- 8.8.5. Contact Details
- 8.8.6. Operating Business Segments
- 8.8.7. Renewable / Sustainable Laboratory Plasticware Portfolio
- 8.8.8. Recent Developments and Future Outlook
- 8.9. Thermo Fisher Scientific
- 8.9.1. Company Overview
- 8.9.2. Company Mission
- 8.9.3. Company Footprint
- 8.9.4. Management Team
- 8.9.5. Contact Details
- 8.9.6. Operating Business Segments
- 8.9.7. Renewable / Sustainable Laboratory Plasticware Portfolio
SECTION V: MARKET TRENDS AND STRATEGIC TOOLS
9. RENEWABLE / SUSTAINABLE LABORATORY PLASTICWARE MARKET: OVERVIEW OF ONGOING MEGA TRENDS
- 9.1. Megatrends in the Renewable / Sustainable Laboratory Plasticware Market
- 9.1.1. Adoption of Bio-Based and Biodegradable Materials
- 9.1.2. Technological Innovations in Material Science
- 9.1.3. Optimizing the Plastic Content in Labware
- 9.1.4. Shift Towards Reusable Labware
- 9.1.5. Emphasis on Circular Economy Initiatives
- 9.1.6. Evolving Regulatory Guidelines
10. VALUE CHAIN ANALYSIS
SECTION VI: MARKET OPPORTUNITY ANALYSIS
11. MARKET IMPACT ANALYSIS: DRIVERS, RESTRAINTS, OPPORTUNITIES AND CHALLENGES
- 11.1. Market Drivers
- 11.2. Market Restraints
- 11.3. Market Opportunities
- 11.4. Market Challenges
12. GLOBAL RENEWABLE / SUSTAINABLE LABORATORY PLASTICWARE MARKET
- 12.1. Key Assumptions and Methodology
- 12.2. Global Renewable / Sustainable Laboratory Plasticware Market, Historical Trends (Since 2020) and Forecasted Estimates (Till 2035)
- 12.2.1. Multivariate Scenario Analysis
- 12.2.1.1. Conservative Scenario
- 12.2.1.2. Optimistic Scenario
- 12.2.1. Multivariate Scenario Analysis
- 12.3. Key Market Segmentations
13. RENEWABLE / SUSTAINABLE LABORATORY PLASTICWARE MARKET, BY TYPE OF PLASTIC
- 13.1. Key Assumptions and Methodology
- 13.2. Renewable / Sustainable Laboratory Plasticware Market: Distribution by Type of Plastic
- 13.2.1. Renewable / Sustainable Laboratory Plasticware Market for Bioplastics, Historical Trends (Since 2020) and Forecasted Estimates (Till 2035)
- 13.2.2. Renewable / Sustainable Laboratory Plasticware Market for Recycled Plastics, Historical Trends (Since 2020) and Forecasted Estimates (Till 2035)
- 13.2.3. Renewable / Sustainable Laboratory Plasticware Market for Other Plastics, Historical Trends (Since 2020) and Forecasted Estimates (Till 2035)
- 13.3. Data Triangulation and Validation
14. RENEWABLE / SUSTAINABLE LABORATORY PLASTICWARE MARKET, BY TYPE OF POLYMER
- 14.1. Key Assumptions and Methodology
- 14.2. Renewable / Sustainable Laboratory Plasticware Market: Distribution by Type of Polymer
- 14.2.1. Renewable / Sustainable Laboratory Plasticware Market for Polyethylene, Historical Trends (Since 2020) and Forecasted Estimates (Till 2035)
- 14.2.2. Renewable / Sustainable Laboratory Plasticware Market for Polypropylene, Historical Trends (Since 2020) and Forecasted Estimates (Till 2035)
- 14.2.3. Renewable / Sustainable Laboratory Plasticware Market for Polystyrene, Historical Trends (Since 2020) and Forecasted Estimates (Till 2035)
- 14.2.4. Renewable / Sustainable Laboratory Plasticware Market for Other Polymers, Historical Trends (Since 2020) and Forecasted Estimates (Till 2035)
- 14.3. Data Triangulation and Validation
15. RENEWABLE / SUSTAINABLE LABORATORY PLASTICWARE MARKET, BY TYPE OF PLASTICWARE
- 15.1. Key Assumptions and Methodology
- 15.2. Renewable / Sustainable Laboratory Plasticware Market: Distribution by Type of Plasticware
- 15.2.1. Renewable / Sustainable Laboratory Plasticware Market for Pipette Tips, Historical Trends (Since 2020) and Forecasted Estimates (Till 2035)
- 15.2.2. Renewable / Sustainable Laboratory Plasticware Market for Plates, Historical Trends (Since 2020) and Forecasted Estimates (Till 2035)
- 15.2.3. Renewable / Sustainable Laboratory Plasticware Market for Racks, Historical Trends (Since 2020) and Forecasted Estimates (Till 2035)
- 15.2.4. Renewable / Sustainable Laboratory Plasticware Market for Tubes, Historical Trends (Since 2020) and Forecasted Estimates (Till 2035)
- 15.2.5. Renewable / Sustainable Laboratory Plasticware Market for Other Plasticwares, Historical Trends (Since 2020) and Forecasted Estimates (Till 2035)
- 15.3. Data Triangulation and Validation
16. RENEWABLE / SUSTAINABLE LABORATORY PLASTICWARE MARKET, BY END USERS
- 16.1. Key Assumptions and Methodology
- 16.2. Renewable / Sustainable Laboratory Plasticware Market: Distribution by End Users
- 16.2.1. Renewable / Sustainable Laboratory Plasticware Market for Academic and Research Institutes, Historical Trends (Since 2020) and Forecasted Estimates (Till 2035)
- 16.2.2. Renewable / Sustainable Laboratory Plasticware Market for Clinical and Environmental Testing Laboratories, Historical Trends (Since 2020) and Forecasted Estimates (Till 2035)
- 16.2.3. Renewable / Sustainable Laboratory Plasticware Market for Pharmaceutical and Biotechnology Companies, Historical Trends (Since 2020) and Forecasted Estimates (Till 2035)
- 16.2.4. Renewable / Sustainable Laboratory Plasticware Market for Other End Users, Historical Trends (Since 2020) and Forecasted Estimates (Till 2035)
- 16.3. Data Triangulation and Validation
17. RENEWABLE / SUSTAINABLE LABORATORY PLASTICWARE MARKET, BY GEOGRAPHY
- 17.1. Key Assumptions and Methodology
- 17.2. Renewable / Sustainable Laboratory Plasticware Market: Distribution by Geography
- 17.2.1. Renewable / Sustainable Laboratory Plasticware Market in North America, Historical Trends (Since 2020) and Forecasted Estimates (Till 2035)
- 17.2.1.1. Renewable / Sustainable Laboratory Plasticware Market in the US, Historical Trends (Since 2020) and Forecasted Estimates (Till 2035)
- 17.2.1.2. Renewable / Sustainable Laboratory Plasticware Market in Canada, Historical Trends (Since 2020) and Forecasted Estimates (Till 2035)
- 17.2.2. Renewable / Sustainable Laboratory Plasticware Market in Europe, Historical Trends (Since 2020) and Forecasted Estimates (Till 2035)
- 17.2.2.1. Renewable / Sustainable Laboratory Plasticware Market in France, Historical Trends (Since 2020) and Forecasted Estimates (Till 2035)
- 17.2.2.2. Renewable / Sustainable Laboratory Plasticware Market in Germany, Historical Trends (Since 2020) and Forecasted Estimates (Till 2035)
- 17.2.2.3. Renewable / Sustainable Laboratory Plasticware Market in Italy, Historical Trends (Since 2020) and Forecasted Estimates (Till 2035)
- 17.2.2.4. Renewable / Sustainable Laboratory Plasticware Market in Netherlands, Historical Trends (Since 2020) and Forecasted Estimates (Till 2035)
- 17.2.2.5. Renewable / Sustainable Laboratory Plasticware Market in Spain, Historical Trends (Since 2020) and Forecasted Estimates (Till 2035)
- 17.2.2.6. Renewable / Sustainable Laboratory Plasticware Market in the UK, Historical Trends (Since 2020) and Forecasted Estimates (Till 2035)
- 17.2.3. Renewable / Sustainable Laboratory Plasticware Market in Asia-Pacific, Historical Trends (Since 2020) and Forecasted Estimates (Till 2035)
- 17.2.3.1. Renewable / Sustainable Laboratory Plasticware Market in China, Historical Trends (Since 2020) and Forecasted Estimates (Till 2035)
- 17.2.3.2. Renewable / Sustainable Laboratory Plasticware Market in India, Historical Trends (Since 2020) and Forecasted Estimates (Till 2035)
- 17.2.3.3. Renewable / Sustainable Laboratory Plasticware Market in Japan, Historical Trends (Since 2020) and Forecasted Estimates (Till 2035)
- 17.2.4. Renewable / Sustainable Laboratory Plasticware Market in Latin America, Historical Trends (Since 2020) and Forecasted Estimates (Till 2035)
- 17.2.4.1. Renewable / Sustainable Laboratory Plasticware Market in Argentina, Historical Trends (Since 2020) and Forecasted Estimates (Till 2035)
- 17.2.4.2. Renewable / Sustainable Laboratory Plasticware Market in Brazil, Historical Trends (Since 2020) and Forecasted Estimates (Till 2035)
- 17.2.5. Renewable / Sustainable Laboratory Plasticware Market in MENA, Historical Trends (Since 2020) and Forecasted Estimates (Till 2035)
- 17.2.5.1. Renewable / Sustainable Laboratory Plasticware Market in Egypt, Historical Trends (Since 2020) and Forecasted Estimates (Till 2035)
- 17.2.5.2. Renewable / Sustainable Laboratory Plasticware Market in Saudi Arabia, Historical Trends (Since 2020) and Forecasted Estimates (Till 2035)
- 17.2.5.3. Renewable / Sustainable Laboratory Plasticware Market in UAE, Historical Trends (Since 2020) and Forecasted Estimates (Till 2035)
- 17.2.1. Renewable / Sustainable Laboratory Plasticware Market in North America, Historical Trends (Since 2020) and Forecasted Estimates (Till 2035)
- 17.3. Market Dynamics Assessment: Renewable / Sustainable Laboratory Plasticware Market by Geography
- 17.3.1. Market Movement Analysis
- 17.3.2. Penetration-Growth (P-G) Matrix
- 17.4. Data Triangulation and Validation
SECTION VIII: OTHER EXCLUSIVE INSIGHTS
18. INSIGHTS FROM PRIMARY RESEARCH
SECTION IX: APPENDIX
19. TABULATED DATA
20. LIST OF COMPANIES AND ORGANIZATIONS
List of Tables
- Table 6.1 List of Companies Offering Renewable / Sustainable Laboratory Plasticware
- Table 6.2 List of Companies Offering Renewable / Sustainable Laboratory Plasticwares: Information on Type of 3R Initiative Involved, ACT Label, Sustainable Raw Materials of Plastic, Type of Polymer and Type of Plasticware Offered
- Table 19.1 Renewable / Sustainable Laboratory Plasticware Providers: Distribution by Year of Establishment
- Table 19.2 Renewable / Sustainable Laboratory Plasticware Providers: Distribution by Company Size
- Table 19.3 Renewable / Sustainable Laboratory Plasticware Providers: Distribution by Location of Headquarters
- Table 19.4 Renewable / Sustainable Laboratory Plasticware Providers: Distribution by Type of 3R Initiative Involved
- Table 19.5 Renewable / Sustainable Laboratory Plasticware Providers: Distribution by Type of Polymer
- Table 19.6 Renewable / Sustainable Laboratory Plasticware Providers: Distribution by Type of Plasticware Offered
- Table 19.7 Global Renewable / Sustainable Laboratory Plasticware Market, Historical Trends (Since 2020) and Forecasted Estimates (Till 2035) (USD Billion)
- Table 19.8 Global Renewable / Sustainable Laboratory Plasticware Market, Forecasted Estimates (Till 2035): Conservative Scenario (USD Billion)
- Table 19.9 Global Renewable / Sustainable Laboratory Plasticware Market, Forecasted Estimates (Till 2035): Optimistic Scenario (USD Billion)
- Table 19.10 Renewable / Sustainable Laboratory Plasticware Market: Distribution by Type of Plastic (USD Million)
- Table 19.11 Renewable / Sustainable Laboratory Plasticware Market for Bioplastics, Historical Trends (Since 2020) and Forecasted Estimates (Till 2035) (USD Million)
- Table 19.12 Renewable / Sustainable Laboratory Plasticware Market for Recycled Plastics, Historical Trends (Since 2020) and Forecasted Estimates (Till 2035) (USD Million)
- Table 19.13 Renewable / Sustainable Laboratory Plasticware Market for Other Plastics, Historical Trends (Since 2020) and Forecasted Estimates (Till 2035) (USD Million)
- Table 19.14 Renewable / Sustainable Laboratory Plasticware Market: Distribution by Type of Polymer (USD Million)
- Table 19.15 Renewable / Sustainable Laboratory Plasticware Market for Polyethylene, Historical Trends (Since 2020) and Forecasted Estimates (Till 2035) (USD Million)
- Table 19.16 Renewable / Sustainable Laboratory Plasticware Market for Polypropylene, Historical Trends (Since 2020) and Forecasted Estimates (Till 2035) (USD Million)
- Table 19.17 Renewable / Sustainable Laboratory Plasticware Market for Polystyrene, Historical Trends (Since 2020) and Forecasted Estimates (Till 2035) (USD Million)
- Table 19.18 Renewable / Sustainable Laboratory Plasticware Market for Other Polymers, Historical Trends (Since 2020) and Forecasted Estimates (Till 2035) (USD Million)
- Table 19.19 Renewable / Sustainable Laboratory Plasticware Market: Distribution by Type of Plasticware (USD Million)
- Table 19.20 Renewable / Sustainable Laboratory Plasticware Market for Pipette Tips, Historical Trends (Since 2020) and Forecasted Estimates (Till 2035) (USD Million)
- Table 19.21 Renewable / Sustainable Laboratory Plasticware Market for Plates, Historical Trends (Since 2020) and Forecasted Estimates (Till 2035) (USD Million)
- Table 19.22 Renewable / Sustainable Laboratory Plasticware Market for Racks, Historical Trends (Since 2020) and Forecasted Estimates (Till 2035) (USD Million
- Table 19.23 Renewable / Sustainable Laboratory Plasticware Market for Tubes, Historical Trends (Since 2020) and Forecasted Estimates (Till 2035) (USD Million
- Table 19.24 Renewable / Sustainable Laboratory Plasticware Market for Other Plasticwares, Historical Trends (Since 2020) and Forecasted Estimates (Till 2035) (USD Million)
- Table 19.25 Renewable / Sustainable Laboratory Plasticware Market: Distribution by End Users (USD Million)
- Table 19.26 Renewable / Sustainable Laboratory Plasticware Market for Academic and Research Institutes, Historical Trends (Since 2020) and Forecasted Estimates (Till 2035) (USD Million)
- Table 19.27 Renewable / Sustainable Laboratory Plasticware Market for Clinical and Environmental Testing Laboratories, Historical Trends (Since 2020) and Forecasted Estimates (Till 2035) (USD Million)
- Table 19.28 Renewable / Sustainable Laboratory Plasticware Market for Pharmaceutical and Biotechnology Companies, Historical Trends (Since 2020) and Forecasted Estimates (Till 2035) (USD Million)
- Table 19.29 Renewable / Sustainable Laboratory Plasticware Market for Other End Users, Historical Trends (Since 2020) and Forecasted Estimates (Till 2035) (USD Million)
- Table 19.30 Renewable / Sustainable Laboratory Plasticware Market: Distribution by Geography (USD Million)
- Table 19.31 Renewable / Sustainable Laboratory Plasticware Market in North America, Historical Trends (Since 2020) and Forecasted Estimates (Till 2035) (USD Million)
- Table 19.32 Renewable / Sustainable Laboratory Plasticware Market in the US, Historical Trends (Since 2020) and Forecasted Estimates (Till 2035) (USD Million)
- Table 19.33 Renewable / Sustainable Laboratory Plasticware Market in Canada, Historical Trends (Since 2020) and Forecasted Estimates (Till 2035) (USD Million)
- Table 19.34 Renewable / Sustainable Laboratory Plasticware Market in Europe, Historical Trends (Since 2020) and Forecasted Estimates (Till 2035) (USD Million)
- Table 19.35 Renewable / Sustainable Laboratory Plasticware Market in France, Historical Trends (Since 2020) and Forecasted Estimates (Till 2035) (USD Million)
- Table 19.36 Renewable / Sustainable Laboratory Plasticware Market in Germany, Historical Trends (Since 2020) and Forecasted Estimates (Till 2035) (USD Million)
- Table 19.37 Renewable / Sustainable Laboratory Plasticware Market in Italy, Historical Trends (Since 2020) and Forecasted Estimates (Till 2035) (USD Million)
- Table 19.38 Renewable / Sustainable Laboratory Plasticware Market in Netherlands, Historical Trends (Since 2020) and Forecasted Estimates (Till 2035) (USD Million)
- Table 19.39 Renewable / Sustainable Laboratory Plasticware Market in Spain, Historical Trends (Since 2020) and Forecasted Estimates (Till 2035) (USD Million)
- Table 19.40 Renewable / Sustainable Laboratory Plasticware Market in the UK, Historical Trends (Since 2020) and Forecasted Estimates (Till 2035) (USD Million)
- Table 19.41 Renewable / Sustainable Laboratory Plasticware Market in Asia-Pacific, Historical Trends (Since 2020) and Forecasted Estimates (Till 2035) (USD Million)
- Table 19.42 Renewable / Sustainable Laboratory Plasticware Market in China, Historical Trends (Since 2020) and Forecasted Estimates (Till 2035) (USD Million)
- Table 19.43 Renewable / Sustainable Laboratory Plasticware Market in India, Historical Trends (Since 2020) and Forecasted Estimates (Till 2035) (USD Million)
- Table 19.44 Renewable / Sustainable Laboratory Plasticware Market in Japan, Historical Trends (Since 2020) and Forecasted Estimates (Till 2035) (USD Million)
- Table 19.45 Renewable / Sustainable Laboratory Plasticware Market in Latin America, Historical Trends (Since 2020) and Forecasted Estimates (Till 2035) (USD Million)
- Table 19.46 Renewable / Sustainable Laboratory Plasticware Market in Argentina, Historical Trends (Since 2020) and Forecasted Estimates (Till 2035) (USD Million)
- Table 19.47 Renewable / Sustainable Laboratory Plasticware Market in Brazil, Historical Trends (Since 2020) and Forecasted Estimates (Till 2035) (USD Million)
- Table 19.48 Renewable / Sustainable Laboratory Plasticware Market in MENA, Historical Trends (Since 2020) and Forecasted Estimates (Till 2035) (USD Million)
- Table 19.49 Renewable / Sustainable Laboratory Plasticware Market in Egypt, Historical Trends (Since 2020) and Forecasted Estimates (Till 2035) (USD Million)
- Table 19.50 Renewable / Sustainable Laboratory Plasticware Market in Saudi Arabia, Historical Trends (Since 2020) and Forecasted Estimates (Till 2035) (USD Million)
- Table 19.51 Renewable / Sustainable Laboratory Plasticware Market in UAE, Historical Trends (Since 2020) and Forecasted Estimates (Till 2035) (USD Million)
List of Figures
- Figure 2.1 Research Methodology: Project Methodology
- Figure 2.2 Research Methodology: Data Sources for Secondary Research
- Figure 2.3 Research Methodology: Robust Quality Control Framework
- Figure 3.1 Market Dynamics: Forecast Methodology
- Figure 3.2 Market Dynamics: Market Assessment Framework
- Figure 3.3 Market Dynamics: Example List of Parameters
- Figure 4.1 Historical Analysis of Past Recessions and Lessons Learnt
- Figure 5.1 Executive Summary: Market Landscape
- Figure 5.2 Executive Summary: Market Forecast and Opportunity Analysis
- Figure 6.1 Production Process of Renewable / Sustainable Laboratory Plasticware
- Figure 7.1 Renewable / Sustainable Laboratory Plasticware Providers: Distribution by Year of Establishment
- Figure 7.2 Renewable / Sustainable Laboratory Plasticware Providers: Distribution by Company Size
- Figure 7.3 Renewable / Sustainable Laboratory Plasticware Providers: Distribution by Location of Headquarters
- Figure 7.4 Renewable / Sustainable Laboratory Plasticware Providers: Distribution by Type of 3R Initiative Involved
- Figure 7.5 Renewable / Sustainable Laboratory Plasticware Providers: Distribution by Type of Polymer
- Figure 7.6 Renewable / Sustainable Laboratory Plasticware Providers: Distribution by Type of Plasticware Offered
- Figure 9.1 Schematic Representation of Ongoing Megatrends
- Figure 12.1 Global Renewable / Sustainable Laboratory Plasticware Market, Historical Trends (Since 2020) and Forecasted Estimates (Till 2035) (USD Billion)
- Figure 12.2 Global Renewable / Sustainable Laboratory Plasticware Market, Forecasted Estimates (Till 2035): Conservative Scenario (USD Billion)
- Figure 12.3 Global Renewable / Sustainable Laboratory Plasticware Market, Forecasted Estimates (Till 2035): Optimistic Scenario (USD Billion)
- Figure 13.1 Renewable / Sustainable Laboratory Plasticware Market: Distribution by Type of Plastic
- Figure 13.2 Renewable / Sustainable Laboratory Plasticware Market for Bioplastics, Historical Trends (Since 2020) and Forecasted Estimates (Till 2035) (USD Million)
- Figure 13.3 Renewable / Sustainable Laboratory Plasticware Market for Recycled Plastics, Historical Trends (Since 2020) and Forecasted Estimates (Till 2035) (USD Million)
- Figure 13.4 Renewable / Sustainable Laboratory Plasticware Market for Other Plastics, Historical Trends (Since 2020) and Forecasted Estimates (Till 2035) (USD Million)
- Figure 14.1 Renewable / Sustainable Laboratory Plasticware Market: Distribution by Type of Polymer
- Figure 14.2 Renewable / Sustainable Laboratory Plasticware Market for Polyethylene, Historical Trends (Since 2020) and Forecasted Estimates (Till 2035) (USD Million)
- Figure 14.3 Renewable / Sustainable Laboratory Plasticware Market for Polypropylene, Historical Trends (Since 2020) and Forecasted Estimates (Till 2035) (USD Million)
- Figure 14.4 Renewable / Sustainable Laboratory Plasticware Market for Polystyrene, Historical Trends (Since 2020) and Forecasted Estimates (Till 2035) (USD Million)
- Figure 14.5 Renewable / Sustainable Laboratory Plasticware Market for Other Polymers, Historical Trends (Since 2020) and Forecasted Estimates (Till 2035) (USD Million)
- Figure 15.1 Renewable / Sustainable Laboratory Plasticware Market: Distribution by Type of Plasticware
- Figure 15.2 Renewable / Sustainable Laboratory Plasticware Market for Pipette Tips, Historical Trends (Since 2020) and Forecasted Estimates (Till 2035) (USD Million)
- Figure 15.3 Renewable / Sustainable Laboratory Plasticware Market for Plates, Historical Trends (Since 2020) and Forecasted Estimates (Till 2035) (USD Million)
- Figure 15.4 Renewable / Sustainable Laboratory Plasticware Market for Racks, Historical Trends (Since 2020) and Forecasted Estimates (Till 2035) (USD Million)
- Figure 15.5 Renewable / Sustainable Laboratory Plasticware Market for Tubes, Historical Trends (Since 2020) and Forecasted Estimates (Till 2035) (USD Million)
- Figure 15.6 Renewable / Sustainable Laboratory Plasticware Market for Other Plasticwares, Historical Trends (Since 2020) and Forecasted Estimates (Till 2035) (USD Million)
- Figure 16.1 Renewable / Sustainable Laboratory Plasticware Market: Distribution by End Users
- Figure 16.2 Renewable / Sustainable Laboratory Plasticware Market for Academic and Research Institutes, Historical Trends (Since 2020) and Forecasted Estimates (Till 2035) (USD Million)
- Figure 16.3 Renewable / Sustainable Laboratory Plasticware Market for Clinical and Environmental Testing Laboratories, Historical Trends (Since 2020) and Forecasted Estimates (Till 2035) (USD Million)
- Figure 16.4 Renewable / Sustainable Laboratory Plasticware Market for Pharmaceutical and Biotechnology Companies, Historical Trends (Since 2020) and Forecasted Estimates (Till 2035) (USD Million)
- Figure 16.5 Renewable / Sustainable Laboratory Plasticware Market for Other End Users, Historical Trends (Since 2020) and Forecasted Estimates (Till 2035) (USD Million)
- Figure 17.1 Renewable / Sustainable Laboratory Plasticware Market: Distribution by Geography
- Figure 17.2 Renewable / Sustainable Laboratory Plasticware Market in North America, Historical Trends (Since 2020) and Forecasted Estimates (Till 2035) (USD Million)
- Figure 17.3 Renewable / Sustainable Laboratory Plasticware Market in the US, Historical Trends (Since 2020) and Forecasted Estimates (Till 2035) (USD Million)
- Figure 17.4 Renewable / Sustainable Laboratory Plasticware Market in Canada, Historical Trends (Since 2020) and Forecasted Estimates (Till 2035) (USD Million)
- Figure 17.5 Renewable / Sustainable Laboratory Plasticware Market in Europe, Historical Trends (Since 2020) and Forecasted Estimates (Till 2035) (USD Million)
- Figure 17.6 Renewable / Sustainable Laboratory Plasticware Market in France, Historical Trends (Since 2020) and Forecasted Estimates (Till 2035) (USD Million)
- Figure 17.7 Renewable / Sustainable Laboratory Plasticware Market in Germany, Historical Trends (Since 2020) and Forecasted Estimates (Till 2035) (USD Million)
- Figure 17.8 Renewable / Sustainable Laboratory Plasticware Market in Italy, Historical Trends (Since 2020) and Forecasted Estimates (Till 2035) (USD Million)
- Figure 17.9 Renewable / Sustainable Laboratory Plasticware Market in Netherlands, Historical Trends (Since 2020) and Forecasted Estimates (Till 2035) (USD Million)
- Figure 17.10 Renewable / Sustainable Laboratory Plasticware Market in Spain, Historical Trends (Since 2020) and Forecasted Estimates (Till 2035) (USD Million)
- Figure 17.11 Renewable / Sustainable Laboratory Plasticware Market in the UK, Historical Trends (Since 2020) and Forecasted Estimates (Till 2035) (USD Million)
- Figure 17.12 Renewable / Sustainable Laboratory Plasticware Market in Asia-Pacific, Historical Trends (Since 2020) and Forecasted Estimates (Till 2035) (USD Million)
- Figure 17.13 Renewable / Sustainable Laboratory Plasticware Market in China, Historical Trends (Since 2020) and Forecasted Estimates (Till 2035) (USD Million) Figure 17.14 Renewable / Sustainable Laboratory Plasticware Market in India, Historical Trends (Since 2020) and Forecasted Estimates (Till 2035) (USD Million)
- Figure 17.15 Renewable / Sustainable Laboratory Plasticware Market in Japan, Historical Trends (Since 2020) and Forecasted Estimates (Till 2035) (USD Million)
- Figure 17.16 Renewable / Sustainable Laboratory Plasticware Market in Latin America, Historical Trends (Since 2020) and Forecasted Estimates (Till 2035) (USD Million)
- Figure 17.17 Renewable / Sustainable Laboratory Plasticware Market in Argentina, Historical Trends (Since 2020) and Forecasted Estimates (Till 2035) (USD Million)
- Figure 17.18 Renewable / Sustainable Laboratory Plasticware Market in Brazil, Historical Trends (Since 2020) and Forecasted Estimates (Till 2035) (USD Million)
- Figure 17.19 Renewable / Sustainable Laboratory Plasticware Market in MENA, Historical Trends (Since 2020) and Forecasted Estimates (Till 2035) (USD Million)
- Figure 17.20 Renewable / Sustainable Laboratory Plasticware Market in Egypt, Historical Trends (Since 2020) and Forecasted Estimates (Till 2035) (USD Million)
- Figure 17.21 Renewable / Sustainable Laboratory Plasticware Market in Saudi Arabia, Historical Trends (Since 2020) and Forecasted Estimates (Till 2035) (USD Million)
- Figure 17.22 Renewable / Sustainable Laboratory Plasticware Market in UAE, Historical Trends (Since 2020) and Forecasted Estimates (Till 2035) (USD Million)
- Figure 17.23 Market Movement Analysis
- Figure 17.24 Penetration-Growth (P-G) Matrix
 生物分解性材料市场分析及预测(至2034年):类型、产品、应用、技术、组件、材料类型、製程、最终用户、功能、安装类型
 生物分解性塑胶市场材料类型、供应来源、降解技术、生产流程、产品类型、分销管道和应用划分-2025-2030 年全球预测
 生物分解性泡沫市场:依材料类型、依最终用途产业、按泡沫类型、按地区生物基塑胶包装市场机会、成长动力、产业趋势分析及 2025 - 2034 年预测
 生物分解性塑胶市场报告:趋势、预测和竞争分析(至 2031 年)
 2025年生物分解性塑胶全球市场报告
 可生物降解塑胶薄膜市场 - 全球产业规模、份额、趋势、机会与预测,按类型、应用、最终用户、地区和竞争细分,2020-2030 年预测
 生物分解性塑胶市场(按类型、最终用途行业和地区划分)- 预测至 2029 年
 生物分解性塑胶包装市场规模、份额及成长分析(按类型、应用和地区)- 产业预测 2025-2032可生物降解塑胶市场:市场分析和预测至 2033 年 - 按类型、产品、应用、材料类型、技术、最终用户、流程、功能、