


 |
市场调查报告书
商品编码
1643961
抗肥胖药市场:各分子类型,各使用活性化合物,各作用机制,各促效剂类型,各作用途径,各给药途径,各地区,预测销售额,与主要加入企业:2035年前的产业趋势与全球预测Anti-Obesity Drugs Market by Type of Molecule, Active Compound Used, Mechanism of Action, Type of Agonist, Action Pathway, Route of Administration, Geographical Regions, Sales Forecast and Key Players: Industry Trends and Global Forecasts, till 2035 |
||||||
全球抗肥胖药物市场规模预计将从目前的 128 亿美元增长到 2035 年的 1049 亿美元,预计将从目前的 128 亿美元增长到 2035 年的 1049 亿美元,在预测期内增长 21.1%。
肥胖是一种以体内脂肪极度堆积为特征的慢性疾病,对个人的健康造成重大风险。根据世界卫生组织(WHO)的数据,肥胖是全球第五大死因。为了因应新兴市场日益增长的担忧,目前市场上有多种药物可供销售,或处于不同研发阶段。
抗肥胖药物,也称为减肥药,包括几种专门设计用于帮助个人控制肥胖和治疗相关疾病(如糖尿病和心血管疾病)的药物治疗方法。这些药物透过多种机制发挥作用,包括抑制食慾、抑制脂肪吸收和提高代谢率。医疗专业人员会根据每位患者的具体情况,选择合适的减重药物,并考虑合併症和代谢功能的潜在风险。此外,新型化合物的开发和药物配方及给药系统的进步也导致了更有效、更安全的抗肥胖药物的出现。
全球肥胖率不断上升,以及人们对糖尿病、心血管疾病的影响此外,对肥胖长期管理的日益重视预计将推动抗肥胖药物市场的大幅成长,为未来几年的利害关係人提供重大机会。
到 2035 年,抗肥胖药物市场预计将以 21.1% 的复合年增长率 (CAGR) 成长,预计到 2035 年北美将占据市场的大部分占有率 (~60%)。
本报告提供全球抗肥胖药市场相关调查,提供市场概要,以及各分子类型,各使用活性化合物,各作用机制,各促效剂类型,各作用途径,各给药途径,各地区的趋势,及加入此市场的主要企业简介等资讯。
目录
第1章 背景
第2章 调查手法
第3章 市场动态
第4章 经济以及其他的计划特有的考虑事项
第5章 摘要整理
第6章 简介
第7章 市场形势:抗肥胖药
第8章 企业简介:以北美作为据点的抗肥胖药开发企业
第9章 企业简介:以欧洲作为据点的抗肥胖药开发企业
第10章 企业简介:据点在亚太地区及全球其他地区的抗肥胖药开发企业
第11章 大型製药公司的配合措施
第12章 对市场的影响分析:促进因素,阻碍因素,机会,课题
第13章 全球抗肥胖药市场
第14章 抗肥胖药市场,各分子类型
第15章 抗肥胖药市场,各使用活性化合物
第16章 抗肥胖药市场,各作用机制
第17章 抗肥胖药市场,各促效剂类型
第18章 抗肥胖药市场,各作用途径
第19章 抗肥胖药市场,各给药途径
第20章 抗肥胖药市场,各地区
第21章 抗肥胖药市场,成药及第三阶段临床试验药的销售额预测
- 成药:预测销售额
- 第三阶段药:预测销售额
第22章 抗肥胖药市场,主要企业
第23章 附录1:表格形式的资料
第24章 附录2:企业·团体一览
ANTI-OBESITY DRUGS MARKET:
As per Roots Analysis, the global anti-obesity drugs market size is estimated to grow from USD 12.8 billion in the current year to USD 104.9 billion by 2035, at a CAGR of 21.1% during the forecast period, till 2035.
The opportunity for anti-obesity drugs market has been distributed across the following segments:
- Type of Molecule
- Biologics
- Small Molecules
- Active Compound Used
- Tirzepatide
- Semaglutide
- Retatrutide
- Survodutide
- Cagrilintide and Semaglutide
- Orforglipron
- Liraglutide
- Other Active Compounds
- Mechanism of Action
- GLP-1 Agonist / GIP Agonist
- GLP-1 Agonist / GCGR Agonist
- GLP-1 Agonist
- GLP-1 Agonist / Amylin Analogue
- GLP-1 / GCGR / GIP Agonist
- Other Mechanisms of Action
- Type of Agonist
- Single-Agonist
- Dual-Agonist
- Tri-Agonist
- Action Pathway
- Centrally Acting
- Peripherally Acting
- Centrally Acting and Peripherally Acting
- Route of Administration
- Oral
- Parenteral
- Geographical Regions
- North America
- Europe
- Asia-Pacific
- Latin America
- Sales Forecast
- Contrave / Mysimba
- Feisumei
- Imcivree
- LOMAIRA
- QSYMIA
- Saxenda
- Wegovy / Ozempic
- Zepbound / Mounjaro
- BI 456906
- CagriSema
- HM11260C
- HRS-9531
- IBI362
- LM-008
- LY3437943
- LY3502970
- TG103
- Semaglutide 7.2 mg (Subcutaneous)
- Semaglutide (Oral)
- XW003
- Key Players
ANTI-OBESITY DRUGS MARKET: GROWTH AND TRENDS
Obesity is a chronic disease, which is characterized by the extreme accumulation of body fat, posing significant health risks to individuals. According to the World Health Organization, obesity is the fifth-leading cause of mortality worldwide. In order to curb this growing concern, various medications are currently available in the market or are being investigated across different phases of development.
Anti-obesity drugs, also referred to as weight loss drugs, include several pharmaceutical treatments designed specifically to assist individuals aiming to manage obesity and treat associated concerns, such as diabetes mellitus and cardiovascular disorders. These drugs work through several mechanisms, including appetite suppression, inhibition of fat absorption, and enhancement of metabolic rate. The selection of appropriate anti-obesity drugs is tailored to each patient's profile, taking into account their co-morbidities and potential risks to metabolic functions, as determined by healthcare professionals. Additionally, the development of novel compounds coupled with ongoing advancements in drug formulation and delivery systems, have led to the emergence of more effective and safer anti-obesity medications.
With rising global obesity rates and increased awareness of the associated health risks including diabetes, cardiovascular diseases, and certain cancers, the demand for effective anti-obesity drugs has surged. Moreover, with a growing emphasis on long-term management of obesity, the anti-obesity drugs market is poised to grow significantly, thus offering significant opportunities to stakeholders in the coming years.
ANTI-OBESITY DRUGS MARKET: KEY INSIGHTS
The report delves into the current state of the anti-obesity market and identifies potential growth opportunities within the industry. The key takeaways of the report are:
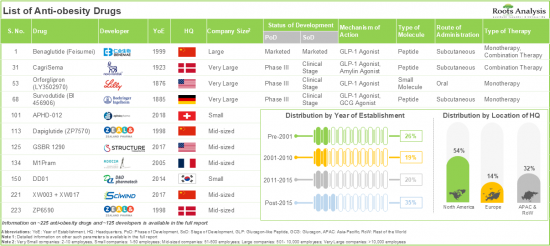
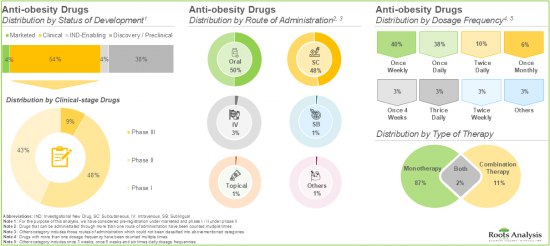
1.Currently, close to 225 drugs are marketed / being developed for the management of obesity; around 50% of these can be administered through oral route
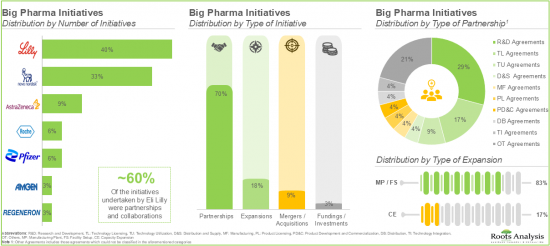
2.A sizeable proportion (70%) of big pharma players have entered into various partnerships in order to expand their anti-obesity drug portfolios; majority of these partnerships (~30%) were research and development agreements
3.The growing awareness among patients about the health risks, associated with obesity coupled with its increasing prevalence, is driving the anti-obesity market and positioning it for steady growth in the foreseeable future
4.The anti-obesity drugs market is anticipated to grow at an annualized rate (CAGR) of 21.1%, till 2035; North America is expected to capture the majority share (~60%) of the market by 2035
5.Currently, the centrally acting anti-obesity drugs dominate the market; notably, parenteral route of administration is expected to capture the majority share (~85%) in market by 2035
ANTI-OBESITY DRUGS MARKET: KEY SEGMENTS
Small Molecules is the Fastest Growing Segment of the Anti-obesity Drugs Market
Based on the type of molecule, the global market for anti-obesity is segmented into biologics and small molecules. Currently, the small molecules segment occupies the highest share in the overall market. However, the landscape is likely to evolve as biologics emerge as a promising and more effective alternative that can target the underlying biological pathways associated with obesity.
Semaglutide is Likely to Hold the Largest Share of the Anti-obesity Drugs Market During the Forecast Period
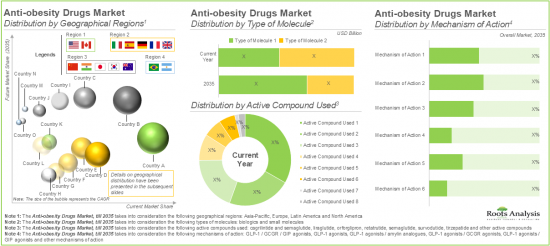
Based on the active compound used, the global market for anti-obesity is segmented into Tirzepatide, Semaglutide, Retatrutide, Survodutide, Cagrilintide and Semaglutide, Orforglipron, Liraglutide, and other active compounds. Currently, Semaglutide leads the anti-obesity drugs market, and this can be attributed to its strong efficacy in weight management and diabetes control. However, owing to significant research progress, tirzepatide has gained attention for its dual action as both a GLP-1 and GIP receptor agonist, demonstrating superior weight loss results in clinical trials.
Anti-Obesity Drugs Market for GLP-1 agonist is Likely to Grow at a Relatively Faster Pace During the Forecast Period
Based on the mechanism of action, the global market for anti-obesity is segmented across GLP-1 agonist / GIP agonist, GLP-1 agonist / GCGR agonist, GLP-1 agonist, GLP-1 agonist / amylin analogue, GLP-1 / GCGR / GIP agonist and other mechanisms of action. Presently, the market is dominated by GLP-1 agonists, due to their ability to mimic hormone glucagon-like peptide 1 (GLP-1), thereby promoting significant weight loss.
Anti-Obesity Drugs Market for Single Agonist is Likely to Grow at a Higher CAGR During the Forecast Period
Based on the type of agonist, the global market for anti-obesity is segmented into single-agonist, dual-agonist and tri-agonist. Currently, single agonist captures the maximum anti-obesity drugs market share owing to its user-friendliness for facilitating patient adherence.
Anti-Obesity Drugs Catering to Centrally Acting Pathways is Likely to Dominate the Anti-Obesity Drugs Market During the Forecast Period
Based on the action pathway, the global market for anti-obesity is distributed across centrally acting, peripherally acting and, centrally and peripherally acting pathways. Presently, centrally acting segment captures the highest anti-obesity drugs market share and is expected to dominate the market during the forecast period. It is important to note that despite ongoing research into alternative pathways, robust clinical evidence supporting the efficacy of centrally acting agents ensures their continued dominance in the market.
Parenteral Route Hold the Largest Share of the Anti-Obesity Drugs Market
Based on the routes of administration, the global market for anti-obesity is segmented into oral and parenteral. Currently, the parenteral route captures the majority share of the market, owing to its rapid onset of action and higher bioavailability compared to oral formulations.
North America Accounts for the Largest Share of the Market
Based on geographical regions, the market is segmented into North America, Europe, Asia-Pacific, and Latin America. In the current scenario, North America is likely to capture the largest market share. This can be attributed to a high prevalence of obesity and related comorbidities, driving the demand for effective treatment options. Additionally, the region benefits from advanced healthcare infrastructure, significant investment in pharmaceutical research, and robust regulatory frameworks that facilitate the development and approval of new therapies.
Example Players in the Anti-Obesity Drugs Market
- Eli Lilly
- Pfizer
- Regeneron
- Kallyope
- CinFina Pharma
- Viking Therapeutics
- AstraZeneca
- Novo Nordisk
- Roche
- Adocia
- Boehringer Ingelheim
- Zealand Pharma
- Hanmi Pharm
- Jiangsu Hengrui Pharmaceuticals
- Gmax Biopharma
- PegBio
- QL Biopharm
- Sciwind Biosciences
ANTI-OBESITY DRUGS MARKET: RESEARCH COVERAGE
The report on anti-obesity drugs market features insights on various sections, including:
- Market Sizing and Opportunity Analysis: An in-depth analysis of current market opportunity and the future growth potential of anti-obesity drugs market, focusing on key market segments, including [A] type of molecule, [B] active compound used, [C] mechanism of action, [D] type of agonist, [E] action pathway, [F] route of administration, and [G] geographical regions.
- Market Impact Analysis: A thorough analysis of various factors, such as [A] drivers, [B] restraints, [C] opportunities, and [D] existing challenges that are likely to impact market growth.
- Market Landscape: A comprehensive evaluation of companies engaged in anti-obesity domain, based on several relevant parameters, such as [A] stage of development, [B] type of molecule, [C] mechanism of action, [D] type of agonist, [E] route of administration, [F] dosage frequency, and [G] type of therapy.
- Anti-obesity Drug Developer Landscape: The report features a list of players engaged in the anti-obesity drug domain, along with analyses based on [A] year of establishment, [B] company size, and [C] location of headquarters, and [D] most active players.
- Company Profiles: In-depth profiles of key industry players in the anti-obesity drug domain, featuring information on [A] company overview, [B] financial information (if available), [C] metaverse in healthcare portfolio, [D] recent developments, and [E] future outlook statements.
- Big Pharma Players: An insightful review of various anti-obesity initiatives undertaken by big pharma players, highlighting trends across various parameters, such as [A] year of initiative, [B] type of initiative, [C] number of partnerships, [D] type of partnership, and [E] type of expansion.
KEY QUESTIONS ANSWERED IN THIS REPORT
- How many companies are currently engaged in this market?
- Which are the leading companies in this market?
- What factors are likely to influence the evolution of this market?
- What is the current and future market size?
- What is the CAGR of this market?
- How is the current and future market opportunity likely to be distributed across key market segments?
REASONS TO BUY THIS REPORT
- The report provides a comprehensive market analysis, offering detailed revenue projections of the overall market and its specific sub-segments. This information is valuable to both established market leaders and emerging entrants.
- Stakeholders can leverage the report to gain a deeper understanding of the competitive dynamics within the market. By analyzing the competitive landscape, businesses can make informed decisions to optimize their market positioning and develop effective go-to-market strategies.
- The report offers stakeholders a comprehensive overview of the market, including key drivers, barriers, opportunities, and challenges. This information empowers stakeholders to stay abreast of market trends and make data-driven decisions to capitalize on growth prospects.
ADDITIONAL BENEFITS
- Complimentary PPT Insights Packs
- Complimentary Excel Data Packs for all Analytical Modules in the Report
- 10% Free Content Customization
- Detailed Report Walkthrough Session with Research Team
- Free Updated report if the report is 6-12 months old or older
TABLE OF CONTENTS
1. BACKGROUND
- 1.1. Context
- 1.2. Project Objectives
2. RESEARCH METHODOLOGY
- 2.1. Chapter Overview
- 2.2. Research Assumptions
- 2.3. Project Methodology
- 2.4. Forecast Methodology
- 2.5. Robust Quality Control
- 2.6. Key Factors
- 2.6.1. Demographics
- 2.6.2. Economic Factors
- 2.6.3. Competitive Landscape
- 2.6.4. Government Regulations and Healthcare Policies
- 2.6.5. R&D Investment
- 2.6.6. Technological Factors
- 2.6.7. Industry Consolidation
- 2.6.8. Supply Chain
- 2.6.9. Market Access
- 2.6.10. COVID Impact / Related Factors
- 2.6.11. Market Access
- 2.6.12. COVID Impact / Related Factors
- 2.6.13. Patient Advocacy and Influence
- 2.6.14. Healthcare Infrastructure
3. MARKET DYNAMICS
- 3.1. Chapter Overview
- 3.2. Forecast Methodology
- 3.2.1. Top-Down Approach
- 3.2.2. Botton-Up Approach
- 3.2.3. Hybrid Approach
- 3.3. Market Assessment Framework
- 3.3.1. Total Addressable Market (TAM)
- 3.3.2. Serviceable Addressable Market (SAM)
- 3.3.3. Serviceable Obtainable Market (SOM)
- 3.3.4. Currently Acquired Market (CAM)
- 3.4. Forecasting Tools and Techniques
- 3.4.1. Qualitative Forecasting
- 3.4.2. Correlation
- 3.4.3. Regression
- 3.4.4. Extrapolation
- 3.4.5. Convergence
- 3.4.6. Sensitivity Analysis
- 3.4.7. Scenario Planning
- 3.4.8. Data Visualization
- 3.4.9. Time Series Analysis
- 3.4.10. Forecast Error Analysis
- 3.5. Key Considerations
- 3.5.1. Demographics
- 3.5.2. Government Regulations
- 3.5.3. Reimbursement Scenarios
- 3.5.4. Market Access
- 3.5.5. Supply Chain
- 3.5.6. Industry Consolidation
- 3.5.7. Pandemic / Unforeseen Disruptions Impact
- 3.6. Key Market Segments
- 3.7. Robust Quality Control
- 3.8. Limitations
4. ECONOMIC AND OTHER PROJECT SPECIFIC CONSIDERATIONS
- 4.1. Chapter Overview
- 4.2. Market Dynamics
- 4.2.1. Time Period
- 4.2.1.1. Historical Trends
- 4.2.1.2. Current and Forecasted Estimates
- 4.2.2. Currency Coverage
- 4.2.2.1. Overview of Major Currencies Affecting the Market
- 4.2.2.2. Impact of Currency Fluctuations on the Industry
- 4.2.3. Foreign Exchange Impact
- 4.2.3.1. Evaluation of Foreign Exchange Rates and Their Impact on Market
- 4.2.3.2. Strategies for Mitigating Foreign Exchange Risk
- 4.2.4. Recession
- 4.2.4.1. Historical Analysis of Past Recessions and Lessons Learnt
- 4.2.4.2. Assessment of Current Economic Conditions and Potential Impact on the Market
- 4.2.5. Inflation
- 4.2.5.1. Measurement and Analysis of Inflationary Pressures in the Economy
- 4.2.5.2. Potential Impact of Inflation on the Market Evolution
- 4.2.1. Time Period
5. EXECUTIVE SUMMARY
6. INTRODUCTION
- 6.1. Overview of Anti-Obesity Drugs
- 6.2. Health Risks Linked with Long-term Obesity
- 6.3. Currently Approved Anti-Obesity Drug Classes
- 6.4. Challenges Associated with Anti-Obesity Drugs
- 6.5. Future Perspectives
7. MARKET LANDSCAPE: ANTI-OBESITY DRUGS
- 7.1. Market Landscape: Anti-Obesity Drugs
- 7.1.1. Analysis by Status of Development
- 7.1.2. Analysis by Type of Molecule
- 7.1.3. Analysis by Mechanism of Action
- 7.1.4. Analysis by Type of Agonist
- 7.1.5. Analysis by Route of Administration
- 7.1.6. Analysis by Dosage Frequency
- 7.1.7. Analysis by Type of Therapy
- 7.2. Developer Landscape: Anti-Obesity Drugs
- 7.2.1. Analysis by Year of Establishment
- 7.2.2. Analysis by Company Size
- 7.2.3. Analysis by Location of Headquarters
- 7.2.4. Analysis by Headquarters (Country) and Status of Development
- 7.2.5. Most Active Developers: Analysis by Number of Drug Candidates
8. COMPANY PROFILES: ANTI-OBESITY DRUG DEVELOPERS BASED IN NORTH AMERICA
- 8.1. Chapter Overview
- 8.2. Detailed Company Profiles
- 8.2.1. Eli Lilly
- 8.2.1.1. Company Details
- 8.2.1.2. Pipeline Portfolio
- 8.2.1.3. Financial Details
- 8.2.1.4. Recent Developments and Future Outlook
- 8.2.2. Pfizer
- 8.2.3. Regeneron
- 8.2.1. Eli Lilly
- 8.3. Brief Company Profiles
- 8.3.1. CinFina Pharma
- 8.3.1.1. Company Details
- 8.3.1.2. Pipeline Portfolio
- 8.3.2. Kallyope
- 8.3.3. Viking Therapeutics
- 8.3.1. CinFina Pharma
9. COMPANY PROFILES: ANTI-OBESITY DRUG DEVELOPERS BASED IN EUROPE
- 9.1. Chapter Overview
- 9.2. Detailed Company Profiles
- 9.2.1. AstraZeneca
- 9.2.1.1. Company Details
- 9.2.1.2. Pipeline Portfolio
- 9.2.1.3. Financial Details
- 9.2.1.4. Recent Developments and Future Outlook
- 9.2.2. Novo Nordisk
- 9.2.3. Roche
- 9.2.1. AstraZeneca
- 9.3. Brief Company Profiles
- 9.3.1. Adocia
- 9.3.1.1. Company Details
- 9.3.1.2. Pipeline Portfolio
- 9.3.2. Boehringer Ingelheim
- 9.3.3. Zealand Pharma
- 9.3.1. Adocia
10. COMPANY PROFILES: ANTI-OBESITY DRUG DEVELOPERS BASED IN ASIA-PACIFIC AND REST OF THE WORLD
- 10.1. Chapter Overview
- 10.2. Detailed Company Profiles
- 10.2.1. Hanmi Pharmaceuticals
- 10.2.1.1. Company Details
- 10.2.1.2. Pipeline Portfolio
- 10.2.1.3. Financial Details
- 10.2.1.4. Recent Developments and Future Outlook
- 10.2.2. Jiangsu Hengrui Pharmaceuticals
- 10.2.1. Hanmi Pharmaceuticals
- 10.3. Brief Company Profiles
- 10.3.1. Gmax Biopharma
- 10.3.1.1. Company Details
- 10.3.1.2. Pipeline Portfolio
- 10.3.2. PegBio
- 10.3.3. QL Biopharm
- 10.3.4. Sciwind Biosciences
- 10.3.1. Gmax Biopharma
11. BIG PHARMA INITIATIVES
- 11.1. Methodology
- 11.2. Big Pharma Players: Anti-obesity focused Initiatives
- 11.2.1. Analysis of Big Pharma Players by Number of Initiatives
- 11.2.2. Analysis by Year of Initiative
- 11.2.3. Analysis by Big Pharma Player by Year of Initiative and Number of Initiatives
- 11.2.4. Analysis by Type of Initiative
- 11.2.5. Analysis by Year and Type of Initiative
- 11.2.6. Analysis by Big Pharma Player and Type of Initiative
- 11.2.7. Analysis by Big Pharma Player and Number of Partnerships
- 11.2.8. Analysis by Type of Partnership
- 11.2.9. Analysis by Type of Expansion
- 11.2.10. Analysis by Big Pharma Player by Region and Number of Initiatives
- 11.2.11. Benchmarking of Big Pharma Players
12. MARKET IMPACT ANALYSIS: DRIVERS, RESTRAINTS, OPPORTUNITIES AND CHALLENGES
- 12.1. Chapter Overview
- 12.2. Market Drivers
- 12.3. Market Restraints
- 12.4. Market Opportunities
- 12.5. Market Challenges
13. GLOBAL ANTI-OBESITY DRUGS MARKET
- 13.1. Forecast Methodology and Key Assumptions
- 13.2. Global Anti-Obesity Drugs Market, Historical Trends (Since 2019) and Forecasted Estimates (Till 2035) (USD Billion)
- 13.2.1. Scenario Analysis
- 13.2.1.1. Conservative Scenario
- 13.2.1.2. Optimistic Scenario
- 13.2.1. Scenario Analysis
- 13.3. Key Market Segmentations
14. ANTI-OBESITY DRUGS MARKET, BY TYPE OF MOLECULE
- 14.1. Anti-Obesity Drugs Market: Distribution by Type of Molecule
- 14.1.1. Anti-Obesity Drugs Market for Biologics, Historical Trends (since 2019) and Forecasted Estimates (till 2035)
- 14.1.2. Anti-Obesity Drugs Market for Small Molecules, Historical Trends (since 2019) and Forecasted Estimates (till 2035)
15. ANTI-OBESITY DRUGS MARKET, BY ACTIVE COMPOUND USED
- 15.1. Anti-Obesity Drugs Market: Distribution by Active Compound Used
- 15.1.1. Anti-Obesity Drugs Market for Tirzepatide, Historical Trends (since 2019) and Forecasted Estimates (till 2035)
- 15.1.2. Anti-Obesity Drugs Market for Semaglutide, Historical Trends (since 2019) and Forecasted Estimates (till 2035)
- 15.1.3. Anti-Obesity Drugs Market for Retatrutide, Historical Trends (since 2019) and Forecasted Estimates (till 2035)
- 15.1.4. Anti-Obesity Drugs Market for Survodutide, Historical Trends (since 2019) and Forecasted Estimates (till 2035)
- 15.1.5. Anti-Obesity Drugs Market for Cagrilintide and Semglutide, Historical Trends (since 2019) and Forecasted Estimates (till 2035)
- 15.1.6. Anti-Obesity Drugs Market for Orforglipron, Historical Trends (since 2019) and Forecasted Estimates (till 2035)
- 15.1.7. Anti-Obesity Drugs Market for Liraglutide, Historical Trends (since 2019) and Forecasted Estimates (till 2035)
- 15.1.8. Anti-Obesity Drugs Market for other active compounds used, Historical Trends (since 2019) and Forecasted Estimates (till 2035)
16. ANTI-OBESITY DRUGS MARKET, BY MECHANISM OF ACTION
- 16.1. Anti-Obesity Drugs Market: Distribution by Mechanism of Action
- 16.1.1. Anti-Obesity Drugs Market for GLP-1 Agonist / GIP Agonist, Historical Trends (since 2019) and Forecasted Estimates (till 2035)
- 16.1.2. Anti-Obesity Drugs Market for GLP-1 Agonist, Historical Trends (since 2019) and Forecasted Estimates (till 2035)
- 16.1.3. Anti-Obesity Drugs Market for GLP-1 Agonist / GCGR Agonist, Historical Trends (since 2019) and Forecasted Estimates (till 2035)
- 16.1.4. Anti-Obesity Drugs Market for GLP-1 / GCGR / GIP Agonist, Historical Trends (since 2019) and Forecasted Estimates (till 2035)
- 16.1.5. Anti-Obesity Drugs Market for GLP-1 Agonist / Amylin Analogue, Historical Trends (since 2019) and Forecasted Estimates (till 2035)
- 16.1.6. Anti-Obesity Drugs Market for Other Mechanisms of Action, Historical Trends (since 2019) and Forecasted Estimates (till 2035)
17. ANTI-OBESITY DRUGS MARKET, BY TYPE OF AGONIST
- 17.1. Anti-Obesity Drugs Market: Distribution by Type of Agonist
- 17.1.1. Anti-Obesity Drugs Market for Single-Agonist, Historical Trends (since 2019) and Forecasted Estimates (till 2035)
- 17.1.2. Anti-Obesity Drugs Market for Dual-Agonist, Historical Trends (since 2019) and Forecasted Estimates (till 2035)
- 17.1.3. Anti-Obesity Drugs Market for Tri-Agonist, Historical Trends (since 2019) and Forecasted Estimates (till 2035)
18. ANTI-OBESITY DRUGS MARKET, BY ACTION PATHWAY
- 18.1. Anti-Obesity Drugs Market: Distribution by Action Pathway
- 18.1.1. Anti-Obesity Drugs Market for Centrally Acting Drugs, Historical Trends (since 2019) and Forecasted Estimates (till 2035)
- 18.1.2. Anti-Obesity Drugs Market for Peripherally Acting Drugs, Historical Trends (since 2019) and Forecasted Estimates (till 2035)
- 18.1.3. Anti-Obesity Drugs Market for Centrally Acting and Peripherally Acting Drugs, Historical Trends (since 2019) and Forecasted Estimates (till 2035)
19. ANTI-OBESITY DRUGS MARKET, BY ROUTE OF ADMINISTRATION
- 19.1. Anti-Obesity Drugs Market: Distribution by Route of Administration
- 19.1.1. Anti-Obesity Drugs Market for Oral Administration, Historical Trends (since 2019) and Forecasted Estimates (till 2035)
- 19.1.2. Anti-Obesity Drugs Market for Parenteral Administration, Historical Trends (since 2019) and Forecasted Estimates (till 2035)
20. ANTI-OBESITY DRUGS MARKET, BY GEOGRAPHICAL REGIONS
- 20.1. Anti-Obesity Drugs Market: Distribution by Geographical Regions
- 20.1.1. Anti-Obesity Drugs Market in North America, Historical Trends (since 2019) and Forecasted Estimates (till 2035)
- 20.1.2. Anti-Obesity Drugs Market in Europe, Historical Trends (since 2019) and Forecasted Estimates (till 2035)
- 20.1.3. Anti-Obesity Drugs Market in Asia-Pacific, Historical Trends (since 2019) and Forecasted Estimates (till 2035)
- 20.1.4. Anti-Obesity Drugs Market in Latin America, Historical Trends (since 2019) and Forecasted Estimates (till 2035)
21. ANTI-OBESITY DRUGS MARKET, SALES FORECAST OF MARKETED AND PHASE III DRUGS
- 21.1. Marketed Drugs: Sales Forecast
- 21.1.1. Contrave / Mysimba (Naltrexone, Bupropion)
- 21.1.2. Feisumei (Beinaglutide)
- 21.1.3. Imcivree (Setmelanotide)
- 21.1.4. LOMAIRA (Phentermine Hydrochloride)
- 21.1.5. QSYMIA (Phentermine and Topiramate)
- 21.1.6. Saxenda (Liraglutide)
- 21.1.7. Wegovy / Ozempic (Semaglutide)
- 21.1.8. Zepbound / Mounjaro (Tirzepatide)
- 21.2. Phase III Drugs: Sales Forecast
- 21.2.1. BI 456906 (Survodutide)
- 21.2.2. CagriSema (Cagrilintide and Semaglutide)
- 21.2.3. HM11260C (Efpeglenatide)
- 21.2.4. HRS-9531
- 21.2.5. IBI362 (Mazdutide)
- 21.2.6. LM-008
- 21.2.7. LY3437943 (Retatrutide)
- 21.2.8. LY3502970 (Orforglipron)
- 21.2.9. TG103
- 21.2.10. Semaglutide 7.2 mg (Subcutaneous)
- 21.2.11. Semaglutide (Oral)
- 21.2.12. XW003
22. ANTI-OBESITY DRUGS MARKET, BY KEY PLAYERS
- 22.1. Anti-Obesity Drugs Market: Distribution of Key Players
23. APPENDIX 1: TABULATED DATA
24. APPENDIX 2: LIST OF COMPANIES AND ORGANIZATIONS
List of Tables
- Table 7.1 List of Anti-Obesity Drugs
- Table 7.2 List of Anti-Obesity Drug Developers
- Table 8.1 Eli Lily: Pipeline Portfolio
- Table 8.2 Eli Lily: Recent Developments and Future Outlook
- Table 8.3 Pfizer: Pipeline Portfolio
- Table 8.4 Pfizer: Recent Developments and Future Outlook
- Table 8.5 Regeneron: Pipeline Portfolio
- Table 8.6 Regeneron: Recent Developments and Future Outlook
- Table 8.7 CinFina Pharma: Pipeline Portfolio
- Table 8.8 Kallyope: Pipeline Portfolio
- Table 8.9 Viking Therapeutics: Pipeline Portfolio
- Table 9.1 AstraZeneca: Pipeline Portfolio
- Table 9.2 AstraZeneca: Recent Developments and Future Outlook
- Table 9.3 Novo Nordisk: Pipeline Portfolio
- Table 9.4 Novo Nordisk: Recent Developments and Future Outlook
- Table 9.5 Roche: Pipeline Portfolio
- Table 9.6 Roche: Recent Developments and Future Outlook
- Table 9.7 Adocia: Pipeline Portfolio
- Table 9.8 Boehringer Ingelheim: Pipeline Portfolio
- Table 9.9 Zealand Pharma: Pipeline Portfolio
- Table 10.1 Hanmi Pharmaceuticals: Pipeline Portfolio
- Table 10.2 Hanmi Pharmaceuticals: Recent Developments and Future Outlook
- Table 10.3 Jiangsu Hengrui Pharmaceuticals: Pipeline Portfolio
- Table 10.4 Jiangsu Hengrui Pharmaceuticals: Recent Developments and Future Outlook
- Table 10.5 Gmax Biopharma: Pipeline Portfolio
- Table 10.6 PegBio: Pipeline Portfolio
- Table 10.7 QL Biopharm: Pipeline Portfolio
- Table 10.8 Sciwind Biosciences: Pipeline Portfolio
- Table 11.1 Big Pharma Players: List of Anti-obesity Focused Initiatives
- Table 13.1 Anti-obesity Market: List of Forecasted Drugs
- Table 23.1 Anti-Obesity Drugs: Distribution by Status of Development
- Table 23.2 Anti-Obesity Drugs: Distribution by Type of Molecule
- Table 23.3 Anti-Obesity Drugs: Distribution by Mechanism of Action
- Table 23.4 Anti-Obesity Drugs: Distribution by Type of Agonist
- Table 23.5 Anti-Obesity Drugs: Distribution by Route of Administration
- Table 23.6 Anti-Obesity Drugs: Distribution by Dosage Frequency
- Table 23.7 Anti-Obesity Drugs: Distribution by Type of Therapy
- Table 23.8 Anti-Obesity Drug Developers: Distribution by Year of Establishment
- Table 23.9 Anti-Obesity Drug Developers: Distribution by Company Size
- Table 23.10 Anti-Obesity Drug Developers: Distribution by Location of Headquarters
- Table 23.11 Anti-Obesity Drug Developers: Distribution by Headquarters (Country) and Status of Development
- Table 23.12 Most Active Developers: Distribution by Number of Drugs
- Table 23.13 Eli Lilly: Annual Revenues (USD Billion)
- Table 23.14 Pfizer: Annual Revenues (USD Billion)
- Table 23.15 Regeneron: Annual Revenues (USD Billion)
- Table 23.16 AstraZeneca: Annual Revenues (USD Billion)
- Table 23.17 Novo Nordisk: Annual Revenues (DKK Billion)
- Table 23.18 Roche: Annual Revenues (CHF Billion)
- Table 23.19 Hanmi Pharmaceuticals: Annual Revenues (KRW Billion)
- Table 23.20 Jiangsu Hengrui Pharmaceuticals: Annual Revenues (CNY Billion)
- Table 23.21 Big Pharma Initiatives: Distribution of Big Pharma Players by Number of Initiatives
- Table 23.22 Big Pharma Initiatives: Distribution by Year of Initiative
- Table 23.23 Big Pharma Initiatives: Distribution by Big Pharma Players by Year and Number of Initiatives
- Table 23.24 Big Pharma Initiatives: Distribution by Type of Initiative
- Table 23.25 Big Pharma Initiatives: Distribution by Year and Type of Initiative
- Table 23.26 Big Pharma Initiatives: Distribution by Big Pharma Players and Type of Initiative
- Table 23.27 Big Pharma Initiatives: Distribution by Type of Partnership
- Table 23.28 Big Pharma Initiatives: Distribution by Type of Expansion
- Table 23.29 Big Pharma Initiatives: Distribution by Big Pharma Players by Region and Number of Initiatives
- Table 23.30 Global Anti-Obesity Drug Market, Historical Trends (Since 2019) and Forecasted Estimates (Till 2035)
- Table 23.31 Global Anti-obesity Drugs Market, till 2035 (USD Billion): Conservative Scenario
- Table 23.32 Global Anti-obesity Drugs Market, till 2035 (USD Billion): Optimistic Scenario
- Table 23.33 Anti-obesity Drugs Market: Distribution by Type of Molecule
- Table 23.34 Anti-obesity Market for Biologics, till 2035 (USD Billion)
- Table 23.35 Anti-obesity Market for Small Molecules, till 2035 (USD Billion)
- Table 23.36 Anti-obesity Drugs Market: Distribution by Active Compound Used
- Table 23.37 Anti-obesity Market for Tirzepatide, till 2035 (USD Billion)
- Table 23.38 Anti-obesity Market for Semaglutide, till 2035 (USD Billion)
- Table 23.39 Anti-obesity Market for Retatrutide, till 2035 (USD Billion)
- Table 23.40 Anti-obesity Market for Survodutide, till 2035 (USD Billion)
- Table 23.41 Anti-obesity Market for Cagrilintide / Semaglutide, till 2035 (USD Billion)
- Table 23.42 Anti-obesity Market for Orforglipron, till 2035 (USD Billion)
- Table 23.43 Anti-obesity Market for Liraglutide, till 2035 (USD Billion)
- Table 23.44 Anti-obesity Market for Other Compounds, till 2035 (USD Billion)
- Table 23.45 Anti-obesity Drugs Market: Distribution by Mechanism of Action
- Table 23.46 Anti-obesity Market for GLP-1 Agonist / GIP Agonist, till 2035 (USD Billion)
- Table 23.47 Anti-obesity Market for GLP-1 Agonist, till 2035 (USD Billion)
- Table 23.48 Anti-obesity Market for GLP-1 / GCGR / GIP Agonist, till 2035 (USD Billion)
- Table 23.49 Anti-obesity Market for GLP-1 Agonist / GCGR Agonist, till 2035 (USD Billion)
- Table 23.50 Anti-obesity Market for GLP-1 Agonist / Amylin Analogue, till 2035 (USD Billion)
- Table 23.51 Anti-obesity Market for Other Mechanisms of Action, till 2035 (USD Billion)
- Table 23.52 Anti-obesity Market: Distribution by Type of Agonist
- Table 23.53 Anti-obesity Market for Single-Agonist, till 2035 (USD Billion)
- Table 23.54 Anti-obesity Market for Dual-Agonist, till 2035 (USD Billion)
- Table 23.55 Anti-obesity Market for Tri-Agonist, till 2035 (USD Billion)
- Table 23.56 Anti-obesity Drugs Market: Distribution by Action Pathway
- Table 23.57 Anti-obesity Market for Centrally Acting Drugs, till 2035 (USD Billion)
- Table 23.58 Anti-obesity Market for Peripherally Acting Drugs, till 2035 (USD Billion)
- Table 23.59 Anti-obesity Market for Centrally and Peripherally Acting, till 2035 (USD Billion)
- Table 23.60 Anti-obesity Drugs Market: Distribution by Route of Administration
- Table 23.61 Anti-obesity Market for Parenteral Administration, till 2035 (USD Billion)
- Table 23.62 Anti-obesity Market for Oral Administration, till 2035 (USD Billion)
- Table 23.63 Anti-obesity Drugs Market: Distribution by Geography
- Table 23.64 Anti-obesity Market in North America, till 2035 (USD Billion)
- Table 23.65 Anti-obesity Market in North America (country-wise), till 2035 (USD Billion)
- Table 23.66 Anti-obesity Market in Europe, till 2035 (USD Billion)
- Table 23.67 Anti-obesity Market in Europe (country-wise), till 2035 (USD Billion)
- Table 23.68 Anti-obesity Market in Asia-Pacific, till 2035 (USD Billion)
- Table 23.69 Anti-obesity Market in Asia-Pacific (country-wise), till 2035 (USD Billion)
- Table 23.70 Anti-obesity Market in Latin America, till 2035 (USD Billion)
- Table 23.71 Anti-obesity Market in Latin America (country-wise), till 2035 (USD Billion)
- Table 23.72 Contrave / Mysimba (Naltrexone, Bupropion) Sales Forecast, till 2035 (USD Billion)
- Table 23.73 Feisumei (Beinaglutide) Sales Forecast, till 2035 (USD Billion)
- Table 23.74 Imcivree (Setmelanotide) Sales Forecast, till 2035 (USD Billion)
- Table 23.75 LOMAIRA (Phentermine Hydrochloride) Sales Forecast, till 2035 (USD Billion)
- Table 23.76 QSYMIA (Phentermine and Topiramate) Sales Forecast, till 2035 (USD Billion)
- Table 23.77 Saxenda (Liraglutide) Sales Forecast, till 2035 (USD Billion)
- Table 23.78 Wegovy / Ozempic (Semaglutide) Sales Forecast, till 2035 (USD Billion)
- Table 23.79 Zepbound / Mounjaro (Tirzepatide) Sales Forecast, till 2035 (USD Billion)
- Table 23.80 BI 456906 (Survodutide) Sales Forecast, till 2035 (USD Billion)
- Table 23.81 CagriSema (Cagrilintide and Semaglutide) Sales Forecast, till 2035 (USD Billion)
- Table 23.82 HM11260C (Efpeglenatide) Sales Forecast, till 2035 (USD Billion)
- Table 23.83 HRS-9531 Sales Forecast, till 2035 (USD Billion)
- Table 23.84 IBI362 (Mazdutide) Sales Forecast, till 2035 (USD Billion)
- Table 23.85 LM-008 Sales Forecast, till 2035 (USD Billion)
- Table 23.86 LY3437943 (Retatrutide) Sales Forecast, till 2035 (USD Billion)
- Table 23.87 LY3502970 (Orforglipron) Sales Forecast, till 2035 (USD Billion)
- Table 23.88 TG103 Sales Forecast, till 2035 (USD Billion)
- Table 23.89 Semaglutide 7.2 mg (Subcutaneous) Sales Forecast, till 2035 (USD Billion)
- Table 23.90 Semaglutide (Oral) Sales Forecast, till 2035 (USD Billion)
- Table 23.91 XW003 Sales Forecast, till 2035 (USD Billion)
- Table 23.92 Anti-obesity Drugs Market: Distribution by Key Players, 2020 (USD Billion)
- Table 23.93 Anti-obesity Drugs Market: Distribution by Key Players, Current Year (USD Billion)
- Table 23.94 Anti-obesity Drugs Market: Distribution by Key Players, 2035 (USD Billion)
List of Figures
- Figure 2.1 Research Methodology: Project Methodology
- Figure 2.2 Research Methodology: Forecast Methodology
- Figure 3.1 Lessons Learnt from Past Recessions
- Figure 6.1 Health Risks Linked with Long-term Obesity
- Figure 6.2 Currently Approved Anti-Obesity Drug Classes
- Figure 7.1 Anti-Obesity Drugs: Distribution by Status of Development
- Figure 7.2 Anti-Obesity Drugs: Distribution by Type of Molecule
- Figure 7.3 Anti-Obesity Drugs: Distribution by Mechanism of Action
- Figure 7.4 Anti-Obesity Drugs: Distribution by Type of Agonist
- Figure 7.5 Anti-Obesity Drugs: Distribution by Route of Administration
- Figure 7.6 Anti-Obesity Drugs: Distribution by Dosage Frequency
- Figure 7.7 Anti-Obesity Drugs: Distribution by Type of Therapy
- Figure 7.8 Anti-Obesity Drug Developers: Distribution by Year of Establishment
- Figure 7.9 Anti-Obesity Drug Developers: Distribution by Company Size
- Figure 7.10 Anti-Obesity Drug Developers: Distribution by Location of Headquarters
- Figure 7.11 Anti-Obesity Drug Developers: Distribution by Headquarters (Country) and Status of Development
- Figure 7.12 Most Active Developers: Distribution by Number of Drug Candidates
- Figure 8.1 Eli Lilly: Annual Revenues (USD Billion)
- Figure 8.2 Pfizer: Annual Revenues (USD Billion)
- Figure 8.3 Regeneron: Annual Revenues (USD Billion)
- Figure 9.1 AstraZeneca: Annual Revenues (USD Billion)
- Figure 9.2 Novo Nordisk: Annual Revenues (DKK Billion)
- Figure 9.3 Roche: Annual Revenues (CHF Billion)
- Figure 10.1 Hanmi Pharmaceuticals: Annual Revenues (KRW Billion)
- Figure 10.2 Jiangsu Hengrui Pharmaceuticals: Annual Revenues (CNY Billion)
- Figure 11.1 Big Pharma Initiatives: Distribution of Big Pharma Players by Number of Initiatives
- Figure 11.2 Big Pharma Initiatives: Distribution by Year of Initiative
- Figure 11.3 Big Pharma Initiatives: Distribution by Big Pharma Players by Year and Number of Initiatives
- Figure 11.4 Big Pharma Initiatives: Distribution by Type of Initiative
- Figure 11.5 Big Pharma Initiatives: Distribution by Year and Type of Initiative
- Figure 11.6 Big Pharma Initiatives: Distribution by Big Pharma Players and Type of Initiative
- Figure 11.7 Big Pharma Initiatives: Distribution by Type of Partnership
- Figure 11.8 Big Pharma Initiatives: Distribution by Type of Expansion
- Figure 11.9 Big Pharma Initiatives: Distribution of Big Pharma Players by Region and Number of Initiatives
- Figure 11.10 Benchmarking of Big Pharma Players
- Figure 12.1 Anti-Obesity Drugs: Market Drivers
- Figure 12.2 Anti-Obesity Drugs: Market Restraints
- Figure 12.3 Anti-Obesity Drugs: Market Opportunities
- Figure 12.4 Anti-Obesity Drugs: Market Challenges
- Figure 13.1 Global Anti-Obesity Drug Market, Historical Trends (Since 2019) and Forecasted Estimates (till 2035)
- Figure 13.2 Global Anti-obesity Drugs Market, till 2035 (USD Billion) (USD Billion): Conservative Scenario
- Figure 13.3 Global Anti-obesity Drugs Market, till 2035 (USD Billion) (USD Billion): Optimistic Scenario
- Figure 14.1 Anti-obesity Drugs Market: Distribution by Type of Molecule
- Figure 14.2 Anti-obesity Market for Biologics, till 2035 (USD Billion)
- Figure 14.3 Anti-obesity Market for Small Molecules, till 2035 (USD Billion)
- Figure 15.1 Anti-obesity Drugs Market: Distribution by Active Compound Used
- Figure 15.2 Anti-obesity Market for Tirzepatide, till 2035 (USD Billion)
- Figure 15.3 Anti-obesity Market for Semaglutide, till 2035 (USD Billion)
- Figure 15.4 Anti-obesity Market for Retatrutide, till 2035 (USD Billion)
- Figure 15.5 Anti-obesity Market for Survodutide, till 2035 (USD Billion)
- Figure 15.6 Anti-obesity Market for Cagrilintide / Semaglutide, till 2035 (USD Billion)
- Figure 15.7 Anti-obesity Market for Orforglipron, till 2035 (USD Billion)
- Figure 15.8 Anti-obesity Market for Liraglutide, till 2035 (USD Billion)
- Figure 15.9 Anti-obesity Market for Other Compounds, till 2035 (USD Billion)
- Figure 16.1 Anti-obesity Drugs Market: Distribution by Mechanism of Action
- Figure 16.2 Anti-obesity Market for GLP-1 Agonist / GIP Agonist, till 2035 (USD Billion)
- Figure 16.3 Anti-obesity Market for GLP-1 Agonist, till 2035 (USD Billion)
- Figure 16.4 Anti-obesity Market for GLP-1 / GCGR / GIP Agonist, till 2035 (USD Billion)
- Figure 16.5 Anti-obesity Market for GLP-1 Agonist / GCGR Agonist, till 2035 (USD Billion)
- Figure 16.6 Anti-obesity Market for GLP-1 Agonist / Amylin Analogue, till 2035 (USD Billion)
- Figure 16.7 Anti-obesity Market for Other Mechanisms of Action, till 2035 (USD Billion)
- Figure 17.1 Anti-obesity Market: Distribution by Type of Agonist
- Figure 17.2 Anti-obesity Market for Single-Agonist, till 2035 (USD Billion)
- Figure 17.3 Anti-obesity Market for Dual-Agonist, till 2035 (USD Billion)
- Figure 17.4 Anti-obesity Market for Tri-Agonist, till 2035 (USD Billion)
- Figure 18.1 Anti-obesity Drugs Market: Distribution by Action Pathway
- Figure 18.2 Anti-obesity Market for Centrally Acting Drugs, till 2035 (USD Billion)
- Figure 18.3 Anti-obesity Market for Peripherally Acting Drugs, till 2035 (USD Billion)
- Figure 18.4 Anti-obesity Market for Centrally and Peripherally Acting Drugs, till 2035 (USD Billion)
- Figure 19.1 Anti-obesity Drugs Market: Distribution by Route of Administration
- Figure 19.2 Anti-obesity Market for Parenteral Administration, till 2035 (USD Billion)
- Figure 19.3 Anti-obesity Market for Oral Administration, till 2035 (USD Billion)
- Figure 20.1 Anti-obesity Drugs Market: Distribution by Geographical Regions
- Figure 20.2 Anti-obesity Market in North America, till 2035 (USD Billion)
- Figure 20.3 Anti-obesity Market in North America (country-wise), till 2035 (USD Billion)
- Figure 20.4 Anti-obesity Market in Europe, till 2035 (USD Billion)
- Figure 20.5 Anti-obesity Market in Europe (country-wise), till 2035 (USD Billion)
- Figure 20.6 Anti-obesity Market in Asia-Pacific, till 2035 (USD Billion)
- Figure 20.7 Anti-obesity Market in Asia-Pacific (country-wise), till 2035 (USD Billion)
- Figure 20.8 Anti-obesity Market in Latin America, till 2035 (USD Billion)
- Figure 20.9 Anti-obesity Market in Latin America (country-wise), till 2035 (USD Billion)
- Figure 21.1 Contrave / Mysimba (Naltrexone, Bupropion) Sales Forecast, till 2035 (USD Billion)
- Figure 21.2 Feisumei (Beinaglutide) Sales Forecast, till 2035 (USD Billion)
- Figure 21.3 Imcivree (Setmelanotide) Sales Forecast, till 2035 (USD Billion)
- Figure 21.4 LOMAIRA (Phentermine Hydrochloride) Sales Forecast, till 2035 (USD Billion)
- Figure 21.5 QSYMIA (Phentermine and Topiramate) Sales Forecast, till 2035 (USD Billion)
- Figure 21.6 Saxenda (Liraglutide) Sales Forecast, till 2035 (USD Billion)
- Figure 21.7 Wegovy / Ozempic (Semaglutide) Sales Forecast, till 2035 (USD Billion)
- Figure 21.8 Zepbound / Mounjaro (Tirzepatide) Sales Forecast, till 2035 (USD Billion)
- Figure 21.9 BI 456906 (Survodutide) Sales Forecast, till 2035 (USD Billion)
- Figure 21.10 CagriSema (Cagrilintide and Semaglutide) Sales Forecast, till 2035 (USD Billion)
- Figure 21.11 HM11260C (Efpeglenatide) Sales Forecast, till 2035 (USD Billion)
- Figure 21.12 HRS-9531 Sales Forecast, till 2035 (USD Billion)
- Figure 21.13 IBI362 (Mazdutide) Sales Forecast, till 2035 (USD Billion)
- Figure 21.14 LM-008 Sales Forecast, till 2035 (USD Billion)
- Figure 21.15 LY3437943 (Retatrutide) Sales Forecast, till 2035 (USD Billion)
- Figure 21.16 LY3502970 (Orforglipron) Sales Forecast, till 2035 (USD Billion)
- Figure 21.17 TG103 Sales Forecast, till 2035 (USD Billion)
- Figure 21.18 Semaglutide 7.2 mg (Subcutaneous) Sales Forecast, till 2035 (USD Billion)
- Figure 21.19 Semaglutide (Oral) Sales Forecast, till 2035 (USD Billion)
- Figure 21.20 XW003 Sales Forecast, till 2035 (USD Billion)
- Figure 22.1 Anti-obesity Drugs Market: Distribution by Key Players, 2020 (USD Billion)
- Figure 22.2 Anti-obesity Drugs Market: Distribution by Key Players, Current Year (USD Billion)
- Figure 22.3 Anti-obesity Drugs Market: Distribution by Key Players, 2035 (USD Billion)
 抗肥胖药的全球市场:治疗类型·药物类型·作用机制·给药途径·通路·各地区 (~2035年)
 Ugobi 市场:按适应症、剂量、年龄层、分销管道和地区划分抗肥胖药物市场(依药物类别、药物类型和地区划分)
 2021 - 2031 年抗肥胖药物市场规模及预测、全球及地区份额、趋势及成长机会分析报告,涵盖:按类型、药物类别、应用、给药途径、配销通路和地理划分
 2025 年至 2033 年抗肥胖药物市场规模、份额、趋势及预测(依药物类别、药物类型、配销通路及地区划分)
 抗减肥药市场按治疗类型、药物类型、给药途径、剂型、最终用户和分销管道划分-2025-2030 年全球预测
 肥胖治疗市场规模、份额、趋势分析报告:按药物类别、给药途径、分销管道、地区、细分预测,2025-2030 年
 减重护理市场规模、份额和成长分析(按程序类型、药物类型、最终用户和地区)- 行业预测,2025-2032 年
 抗肥胖药物市场规模、份额、成长分析(按药物类型、作用、剂量和地区划分)- 产业预测,2025 年至 2032 年
 抗肥胖药物市场 - 全球产业规模、份额、趋势、机会和预测,按机制(週边作用药物、中枢作用药物)、药物类型(处方药、非处方药)、地区和竞争细分,2019- 2029F