


 |
市场调查报告书
商品编码
1648565
肿瘤学人工智慧市场:依癌症类型、最终用户类型和主要区域:至2035年的行业趋势和全球预测Artificial Intelligence in Oncology Market by Type of Cancer, Type of End-Users, Key Geographical Regions : Industry Trends and Global Forecasts, Till 2035 |
||||||
全球肿瘤学人工智慧(AI)市场规模预计将从目前的11亿美元成长到2035年的91亿美元,在预测期内以 21.4%的年复合成长率成长。
在过去十年中,人工智慧的普及度稳定成长。它对整个医疗保健领域,包括肿瘤学领域产生了相当大的影响。这是由于基于人工智慧的诊断和治疗技术的普及。鑑于技术基础设施和突破性的研究突破,人工智慧有潜力掌握医疗保健的复杂性并解决製药、生物技术和医疗器材领域未满足的需求。人工智慧已显示出改善肿瘤成像和治疗反应评估、预测临床结果以及加速药物开发和转化肿瘤学的潜力。人工智慧有可能透过克服现有的挑战并利用巨量资料的力量进一步改善癌症治疗,彻底改变癌症治疗领域。人工智慧已经在肿瘤临床实践中得到应用,但仍需要持续加强努力,以确保人工智慧能够充分发挥其潜力。在工业和非工业参与者不断努力在肿瘤学领域使用基于人工智慧的解决方案的推动下,市场预计将在可预见的未来呈现永续成长。
目前,有超过 70 家公司为肿瘤学领域开发基于 AI 的软体解决方案。
超过 50%的参与者医院使用基于机器学习的解决方案进行诊断。为了获得竞争优势,产业利害关係人积极升级现有能力并增强以人工智慧为中心的服务组合。近期合作活动的激增证明了人们对该市场的兴趣日益浓厚。
预计未来十年市场将以超过 21%的健康速度成长,并且机会可能会在适应症、分子类型和地理上呈现多样化。
本报告研究了肿瘤学人工智慧市场的全球情况,并概述了市场状况以及癌症类型、最终用户类型、关键地区和参与市场的公司概况的趋势。
目录
第1章 简介
第2章 执行摘要
第3章 简介
第4章 市场状况
第5章 公司简介
- 章节概述
- Roche Diagnostics
- IBM Watson Health
- CancerCenter.AI
- GE Healthcare
- Concert AI
- Path AI
- Berg
- Median Technologies
- iCAD
- JLK Inspection
第6章 企业竞争力分析
第7章 专利分析
第8章 伙伴关係与协作
第9章 融资与投资分析
第10章 蓝海策略:新创企业进入竞争市场的策略指南
第11章 市场规模与机会分析
- 章节概述
- 关键假设与研究方法
- 2035年全球肿瘤学人工智慧市场
- 肿瘤学市场中的人工智慧:到2035年依癌症类型的分析
- 肿瘤学市场中的人工智慧:到2035年依最终用户类型的分析
- 肿瘤学市场中的人工智慧:到2035年依主要区域的分析
第12章 结论
第13章 高阶主管洞察
- 章节概述
- Enlitic
- Nucleai
- Mirada Medical
- CancerCenter.AI
- Visiopharm
第14章 附录1:表格资料
第15章 附录2:公司与组织名单
ARTIFICIAL INTELLIGENCE IN ONCOLOGY MARKET: OVERVIEW
As per Roots Analysis, the global artificial intelligence (AI) in oncology market is estimated to grow from USD 1.1 billion in the current year to USD 9.1 billion by 2035, at a CAGR of 21.4% during the forecast period, till 2035.
The market sizing and opportunity analysis has been segmented across the following parameters:
Type of Cancer
- Solid malignancies
- Breast cancer
- Lung cancer
- Prostate cancer
- Colorectal cancer
- Brain tumor
- Others
Type of End Users
- Hospitals
- Pharmaceutical companies
- Research Institutes
- Others
Type of End Users
- North America
- Europe
- Asia-Pacific
- Rest of the World
ARTIFICIAL INTELLIGENCE IN ONCOLOGY MARKET: GROWTH AND TRENDS
In the last decade, the popularity of AI has grown steadily. It has made a considerable impact on the overall medical healthcare sector, including in the field of oncology. This can be attributed to the surge in AI-based technologies for diagnosis and treatment. Given the breakthroughs in technological infrastructure and groundbreaking research, it is anticipated that AI is likely to overcome the complexities of medicine and has the potential to address the unmet needs within the pharmaceutical / biotech / medical devices domain. AI has demonstrated potential in improving tumor imaging diagnosis and therapy response evaluation, anticipating clinical outcomes, and accelerating drug development and translational oncology. AI has the potential to revolutionize the oncology sector by overcoming existing challenges and leveraging the power of big data to improve the cancer treatment further. Although AI is already being used in oncology clinical practice, ongoing and increased efforts are required to allow AI to reach its full potential. Driven by the continuous efforts of both industry and non-industry players to use AI based solutions in the oncology sector, the market is expected to witness sustainable growth in the foreseen future.
ARTIFICIAL INTELLIGENCE IN ONCOLOGY MARKET: KEY INSIGHTS
The report delves into the current state of artificial intelligence in oncology market and identifies potential growth opportunities within the industry. Some key findings from the report include:
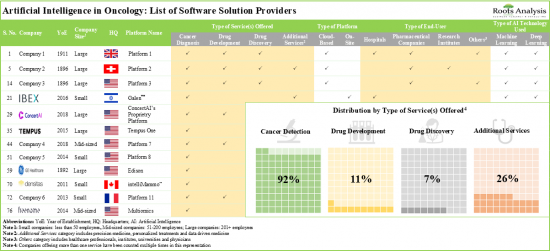
- The current market landscape features the presence of over 70 players engaged in the development of AI-based software solutions for the oncology sector.
- Over 50% of the players use their machine learning powered solutions for diagnostic purposes in hospitals; geographically, the software providers are well distributed.
- In pursuit of gaining a competitive edge, industry stakeholders are actively upgrading their existing capabilities and enhancing their AI focused service portfolios.
- The growing interest in this market is prevalent from the recent rise in partnership activity; ~50% of the deals were inked to enable utilization and integration of proprietary AI-based technology solutions.
- Foreseeing lucrative returns, many public and private investors have made investments worth ~USD 6 billion; 70% of the funding initiatives were led by venture capitalists.
- Over 2,770 patents have been granted / filed by academic and industry stakeholders in the last five years, exclusively for the development of AI-based software solutions for oncology.
- The market is expected to witness a healthy growth of over 21% in the coming decade; the opportunity is likely to be well distributed across various target indications, types of molecules and different regions.
ARTIFICIAL INTELLIGENCE IN ONCOLOGY MARKET: KEY SEGMENTS
Solid Malignancies Segment is Likely to Dominate AI in Oncology Market During the Forecast Period
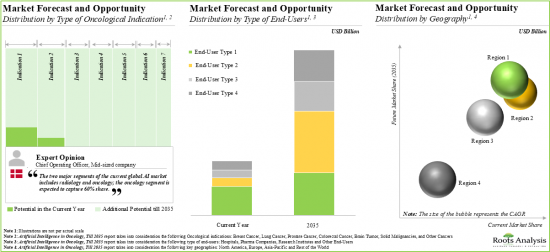
Based on the type of cancer, the market is segmented into solid malignancies, breast cancer, lung cancer, prostate cancer, colorectal cancer, brain tumor, and others based on the type of cancer. At present, the solid malignancies segment holds the maximum share of the AI in oncology market. This trend is likely to remain the same in the coming decade.
Currently, Hospitals Segment Occupies the Largest Share of the AI in Oncology Market
Based on the type of end-user, the market is segmented into hospitals, pharmaceutical companies, research institutes and others. At present, the hospital segment holds the maximum share of the AI in oncology market. This trend is unlikely to change in the near future.
North America Accounts for the Largest Share of the Market
Based on key geographical regions, the market is segmented into North America, Europe, Asia-Pacific and Rest of the world. Majority of the current AI in oncology market is captured by North America. It is worth highlighting that, over the years, the market in Europe is expected to grow at a higher CAGR.
Example Players in the Artificial Intelligence in Oncology Market
- Berg
- CancerCenter.AI
- Concert AI
- GE Healthcare
- IBM Watson Health
- iCAD
- JLK Inspection
- Median Technologies
- Path AI
- Roche Diagnostics
Primary Research Overview
The opinions and insights presented in this study were influenced by discussions conducted with multiple stakeholders. The research report features detailed transcripts of interviews held with the following industry stakeholders:
- Chief Executive Officer, CancerCenter.AI
- Chief Executive Officer, Nucleai
- Chief Executive Officer, Visiopharm
- Vice President, Marketing and Communications, Enlitic
ARTIFICIAL INTELLIGENCE IN ONCOLOGY MARKET: RESEARCH COVERAGE
- Market Sizing and Opportunity Analysis: The report features an in-depth analysis of the AI in oncology market, focusing on key market segments, including [A] type of cancer, [B] type of end-user and [C] key geographical regions.
- Market Landscape: A comprehensive evaluation of companies engaged in the development of AI in oncology-based software solutions, considering various parameters, such as [A] year of establishment, [B] company size (in terms of number of employees), [C] location of headquarters, [D] type of service(s) offered, [E] type of AI technology used, [F] type of platform and [G] type of end-user.
- Company Profiles: In-depth profiles of key industry players offering AI in oncology-based software solutions, focusing on [A] company overviews, [B] proprietary technology platform(s), [C] AI focused service portfolio, [D] recent developments and [E] an informed future outlook.
- Company Competitiveness Analysis: A comprehensive competitive analysis of companies engaged in the development of AI in oncology-based software solutions, examining factors, such as [A] supplier strength [B] portfolio diversity and [C] portfolio strength.
- Patent Analysis: Detailed analysis of various patents filed / granted related to AI in oncology-based software solutions based on [A] type of patent, [B] publication year, [C] geographical location / patent jurisdiction, [D] legal status, [E] CPC symbols, [F] type of industry, [G] type of applicant and [H] leading players (in terms of number of patents filed / granted). It also includes a detailed patent valuation analysis.
- Partnerships and Collaborations: An analysis of partnerships established in this sector, since 2017, based on several parameters, such as [A] year of partnership, [B] type of partnership, [C] most active players (analysis by parent company and analysis by partner company), [D] type of partner, [E] type of cancer and [F] region.
- Funding and Investment Analysis: A detailed evaluation of the investments made in the ADC domain, encompassing seed financing, venture capital financing, debt financing, grants, IPOs and other offerings based on several parameters, such as [A] year of funding, [B] type of funding, [C] leading players (in terms of amount invested) and [D] key investors.
- Blue Ocean Strategy: A detailed analysis of the current and future market based on blue ocean strategy, covering a strategic plan / guide for emerging players in AI in oncology market to help unlock an uncontested market, featuring thirteen strategic tools that can help software developers to shift towards a blue ocean strategic market.
KEY QUESTIONS ANSWERED IN THIS REPORT
- How many companies are currently engaged in this market?
- Which are the leading companies in this market?
- What factors are likely to influence the evolution of this market?
- What is the current and future market size?
- What is the CAGR of this market?
- How is the current and future market opportunity likely to be distributed across key market segments?
REASONS TO BUY THIS REPORT
- The report provides a comprehensive market analysis, offering detailed revenue projections of the overall market and its specific sub-segments. This information is valuable to both established market leaders and emerging entrants.
- Stakeholders can leverage the report to gain a deeper understanding of the competitive dynamics within the market. By analyzing the competitive landscape, businesses can make informed decisions to optimize their market positioning and develop effective go-to-market strategies.
- The report offers stakeholders a comprehensive overview of the market, including key drivers, barriers, opportunities, and challenges. This information empowers stakeholders to stay abreast of market trends and make data-driven decisions to capitalize on growth prospects.
ADDITIONAL BENEFITS
- Complimentary PPT Insights Packs
- Complimentary Excel Data Packs for all Analytical Modules in the Report
- 10% Free Content Customization
- Detailed Report Walkthrough Session with Research Team
- Free Updated report if the report is 6-12 months old or older
TABLE OF CONTENTS
1. PREFACE
- 1.1. Overview
- 1.2. Scope of the Report
- 1.3. Market Segmentation
- 1.4. Research Methodology
- 1.5. Key Questions Answered
- 1.6. Chapter Outlines
2. EXECUTIVE SUMMARY
- 2.1. Chapter Overview
3. INTRODUCTION
- 3.1. Chapter Overview
- 3.2. Overview of Artificial Intelligence
- 3.3. Types Of Artificial Intelligence
- 3.4. AI in Healthcare
- 3.5. Key Challenges Associated with Use of AI in Healthcare Sector
- 3.6. Future Perspectives
4. MARKET LANDSCAPE
- 4.1. Chapter Overview
- 4.2. AI in Oncology: Market Landscape of Software Providers
- 4.2.1. Analysis by Year of Establishment
- 4.2.2. Analysis by Company Size
- 4.2.3. Analysis by Location of Headquarters (Region-wise)
- 4.2.4. Analysis by Location of Headquarters (Country-wise)
- 4.2.5. Analysis by Type of End-User
- 4.2.6. Analysis by Year of Establishment, Company size and Location of Headquarters
- 4.3. AI in Oncology: Market Landscape of Software Solutions
- 4.3.1. Analysis by Type of Service(s) Offered
- 4.3.2. Analysis by Type of AI Technology Used
- 4.3.3. Analysis by Type of Platform
- 4.3.4. Analysis by Type of Service(s) Offered and Type of End-User
- 4.3.5. Analysis by Type of Platform and Type of AI Technology Used
- 4.3.6. Analysis by Type of Service(s) Offered, Location of Headquarters and Type of AI Technology Used
5. COMPANY PROFILES
- 5.1. Chapter Overview
- 5.2. Roche Diagnostics
- 5.2.1. Company Overview
- 5.2.2. Financial Information
- 5.2.3. Service Portfolio
- 5.2.4. Recent Developments and Future Outlook
- 5.3. IBM Watson Health
- 5.3.1. Company Overview
- 5.3.2. Financial Information
- 5.3.3. Service Portfolio
- 5.3.4. Recent Developments and Future Outlook
- 5.4. CancerCenter.AI
- 5.4.1. Company Overview
- 5.4.2. Service Portfolio
- 5.4.3. Recent Development and Future Outlooks
- 5.5. GE Healthcare
- 5.5.1. Company Overview
- 5.5.2. Financial Information
- 5.5.3. Service Portfolio
- 5.5.4. Recent Development and Future Outlook
- 5.6. Concert AI
- 5.6.1. Company Overview
- 5.6.2. Service Portfolio
- 5.6.3. Recent Developments and Future Outlook
- 5.7. Path AI
- 5.7.1. Company Overview
- 5.7.2. Service portfolio
- 5.7.3. Recent Development and Future Outlook
- 5.8. Berg
- 5.8.1. Company Overview
- 5.8.2. Service Portfolio
- 5.8.3. Recent Development and Future Outlook
- 5.9. Median Technologies
- 5.9.1. Company Overview
- 5.9.2. Financial Information
- 5.9.3. Service Portfolio
- 5.9.4. Recent Development and Future Outlook
- 5.10. iCAD
- 5.10.1. Company Overview
- 5.10.2. Financial Information
- 5.10.3. Service Portfolio
- 5.10.4. Recent Developments and Future Outlook
- 5.11. JLK Inspection
- 5.11.1. Company Overview
- 5.11.2. Service Portfolio
- 5.11.3. Recent Development and Future Outlook
6. COMPANY COMPETITIVENESS ANALYSIS
- 6.1. Chapter Overview
- 6.2. Assumptions / Key Parameters
- 6.3. Methodology
- 6.3.1. Company Competitiveness: Small Companies in North America
- 6.3.2. Company Competitiveness: Small Companies in Europe
- 6.3.3. Company Competitiveness: Small Companies in Asia Pacific
- 6.3.4. Company Competitiveness: Mid-sized companies in North America
- 6.3.5. Company Competitiveness: Mid-sized companies in Europe
- 6.3.6. Company Competitiveness: Mid-sized companies in Asia Pacific
- 6.3.7. Company Competitiveness: Large companies in North America and Europe
7. PATENT ANALYSIS
- 7.1. Chapter Overview
- 7.2. Scope and Methodology
- 7.3. AI in Oncology: Patent Analysis
- 7.3.1. Analysis by Type of Patent
- 7.3.2. Analysis by Patent Publication Year
- 7.3.3. Analysis by Year-wise Trend of Filed Patent Applications and Granted Patents
- 7.3.4. Analysis by Jurisdiction
- 7.3.5. Analysis by Type of Industry
- 7.3.6. Analysis by Patent Age
- 7.3.7. Analysis by Legal Status
- 7.3.8. Analysis by CPC Symbols
- 7.3.9. Most Active Players: Analysis by Number of Patents
- 7.3.10. Analysis by Key Inventors
- 7.4. AI in Oncology: Patent Benchmarking Analysis
- 7.4.1. Analysis by Patent Characteristics
- 7.4.2. AI in Oncology: Patent Valuation Analysis
8. PARTNERSHIPS AND COLLABORATIONS
- 8.1. Chapter Overview
- 8.2. Partnership Models
- 8.3. AI in Oncology: Recent Partnerships and Collaborations
- 8.3.1. Analysis by Year of Partnership
- 8.3.2. Analysis by Type of Partnership
- 8.3.3. Analysis by Year and Type of Partnership
- 8.3.4. Analysis by Company Size and Type of Partnership
- 8.3.5. Most Active Partners: Analysis by Number of Partnerships
- 8.3.6. Most Active Players: Analysis by Type of Partnership
- 8.3.7. Analysis by Type of Cancer
- 8.3.8. Analysis by Type of Partner
- 8.3.9. Analysis by Year and Type of Partner
- 8.3.10. Intercontinental and Intracontinental Agreements
- 8.3.11. Local and International Agreements
- 8.3.12. Country-Wise Distribution
- 8.3.13. Analysis by Region
9. FUNDING AND INVESTMENT ANALYSIS
- 9.1. Chapter Overview
- 9.2. Types of Funding Models
- 9.3. AI in Oncology: List of Funding and Investment Analysis
- 9.3.1. Analysis by Year and Number of Funding Instances
- 9.3.2. Analysis by Year and Amount Invested
- 9.3.3 Analysis by Type of Funding and Number of Instances
- 9.3.4. Analysis by Year, Type of Funding and Amount Invested
- 9.3.5. Analysis by Type of Funding and Amount Invested
- 9.3.6. Analysis by Area of Application
- 9.3.7. Analysis by Focus Area
- 9.3.8. Analysis by Type of Cancer Indication
- 9.3.9. Analysis by Geography
- 9.3.10. Most Active Players by Number of Instances
- 9.3.11. Most Active Players by Amount Invested
- 9.3.12. Analysis by Type of Investors
- 9.3.13. Analysis by Lead Investors
- 9.4. Summary of Investments
- 9.5. Concluding Remarks
10. BLUE OCEAN STRATEGY: A STRATEGIC GUIDE FOR START-UPS TO ENTER INTO HIGHLY COMPETITIVE MARKET
- 10.1. Chapter Overview
- 10.2. Overview of Blue Ocean Strategy
- 10.2.1. Red Ocean
- 10.2.2. Blue Ocean
- 10.2.3. Difference between Red Ocean Strategy and Blue Ocean Strategy
- 10.2.4. AI in Oncology: Blue Ocean Strategy and Shift Tools
- 10.2.4.1. Value Innovation
- 10.2.4.2. Strategy Canvas
- 10.2.4.3. Four Action Framework
- 10.2.4.4. Eliminate-Raise-Reduce-Create (ERRC) Grid
- 10.2.4.5. Six Path Framework
- 10.2.4.6. Pioneer-Migrator-Settler (PMS) Map
- 10.2.4.7. Three Tiers of Noncustomers
- 10.2.4.8. Sequence of Blue Ocean Strategy
- 10.2.4.9. Buyer Utility Map
- 10.2.4.10. The Price Corridor of the Mass
- 10.2.4.11. Four Hurdles to Strategy Execution
- 10.2.4.12. Tipping Point Leadership
- 10.2.4.13. Fair Process
- 10.3. Conclusion
11. MARKET SIZING AND OPPORTUNITY ANALYSIS
- 11.1. Chapter Overview
- 11.2. Key Assumptions and Methodology
- 11.3. Global Artificial Intelligence in Oncology Market, till 2035
- 11.4. Artificial Intelligence in Oncology Market: Analysis by Type of Cancer, till 2035
- 11.4.1. Artificial Intelligence in Oncology Market for Breast Cancer, till 2035
- 11.4.2. Artificial Intelligence in Oncology Market for Lung Cancer, till 2035
- 11.4.3. Artificial Intelligence in Oncology Market for Prostate Cancer, till 2035
- 11.4.4. Artificial Intelligence in Oncology Market for Colorectal Cancer, till 2035
- 11.4.5. Artificial Intelligence in Oncology Market for Brain Tumor, till 2035
- 11.4.6. Artificial Intelligence in Oncology Market for Solid Malignancies, till 2035
- 11.4.7. Artificial Intelligence in Oncology Market for Other Cancers, till 2035
- 11.5. Artificial Intelligence in Oncology Market: Analysis by Type of End-User, till 2035
- 11.5.1. Artificial Intelligence in Oncology Market for Hospitals, till 2035
- 11.5.2. Artificial Intelligence in Oncology Market for Pharmaceutical Companies, till 2035
- 11.5.3. Artificial Intelligence in Oncology Market for Research Institutes, till 2035
- 11.5.4. Artificial Intelligence in Oncology Market for Other End-Users, till 2035
- 11.6. Artificial Intelligence in Oncology Market: Analysis by Key Geographical Regions, till 2035
- 11.6.1. Artificial Intelligence in Oncology Market in North America, till 2035
- 11.6.2. Artificial Intelligence in Oncology Market in Europe, till 2035
- 11.6.3. Artificial Intelligence in Oncology Market in Asia Pacific, till 2035
- 11.6.4. Artificial Intelligence in Oncology Market in Rest of the World, till 2035
12. CONCLUSION
- 12.1. Chapter Overview
13. EXECUTIVE INSIGHTS
- 13.1. Chapter Overview
- 13.2. Enlitic
- 13.2.1. Company Snapshot
- 13.2.2. Interview Transcript: Vice President, Marketing and Communications
- 13.3. Nucleai
- 13.3.1. Company Snapshot
- 13.3.2. Interview Transcript: Chief Executive Officer
- 13.4. Mirada Medical
- 13.4.1. Company Snapshot
- 13.4.2. Interview Transcript: Chief Executive Officer
- 13.5. CancerCenter.AI
- 13.5.1. Company Snapshot
- 13.5.2. Interview Transcript: Chief Executive Officer
- 13.6. Visiopharm
- 13.6.1. Company Snapshot
- 13.6.2. Interview Transcript: Chief Executive Officer
14. APPENDIX 1: TABULATED DATA
15. APPENDIX 2: LIST OF COMPANIES AND ORGANIZATIONS
List of Tables
- Table 4.1 AI in Oncology: List of Software providers
- Table 4.2 AI in Oncology Software providers: Information on Type of Service(s) Offered
- Table 4.3 AI in Oncology Software providers: Information on the Type of AI Technology Used
- Table 4.4 AI in Oncology Software providers: Information on Type of Platform
- Table 5.1 Roche Diagnostics: Key Highlights
- Table 5.2 IBM Watson Health: Key Highlights
- Table 5.3 CancerCenter.ai: Key Highlights
- Table 5.4 CancerCenter.ai: Recent Developments and Future Outlook
- Table 5.5 GE Healthcare: Key Highlights
- Table 5.6 GE Healthcare: Recent Developments and Future Outlook
- Table 5.7 Concert AI: Key Highlights
- Table 5.8 Concert AI: Recent Developments and Future Outlook
- Table 5.9 Path AI: Key Highlights
- Table 5.10 PathAI: Recent Developments and Future Outlook
- Table 5.11 BERG: Key Highlights
- Table 5.12 BERG: Recent Developments and Future Outlook
- Table 5.13 Median Technologies: Key Highlights
- Table 5.14 Median Technologies: Recent Developments and Future Outlook
- Table 5.15 iCAD: Key Highlights
- Table 5.16 iCAD: Recent Developments and Future Outlook
- Table 5.17 JLK Inspection: Key Highlights
- Table 7.1 Patent Analysis: CPC Symbols
- Table 7.2 Patent Analysis: Most Popular CPC Symbols
- Table 7.3 Patent Analysis: List of Top CPC Symbols
- Table 7.4 Patent Analysis: Categorization based on Weighted Valuation Scores
- Table 7.5 Patent Analysis: List of Relatively High Value Patents
- Table 8.1 Partnerships and Collaborations: List of Partnerships and Collaborations, since 2017
- Table 9.1 AI in Oncology: List of Funding and Investments, since 2017
- Table 9.2 Funding and Investment Analysis: Summary of Investments (Number of Instances)
- Table 9.3 Funding and Investment Analysis: Summary of Investments (Total Amount Invested)
- Table 9.4 Funding and Investment Analysis: Summary of Venture Capital Funding
- Table 14.1 AI in Oncology Software providers: Distribution by Year of Establishment
- Table 14.2 AI in Oncology Software providers: Distribution by Company Size
- Table 14.3 AI in Oncology Software providers: Distribution by Location of Headquarters (Region-wise)
- Table 14.4 AI in Oncology Software providers: Distribution by Location of Headquarters (Country-wise)
- Table 14.5 AI in Oncology Software providers: Distribution by Type of End-User
- Table 14.6 AI in Oncology Software providers: Distribution by Year of Establishment, Company Size and Location of Headquarters
- Table 14.7 AI in Oncology- based Software Solutions: Distribution by Type of Service(s) Offered
- Table 14.8 AI in Oncology- based Software Solutions: Distribution by Type of AI Technology Used
- Table 14.9 AI in Oncology- based Software Solutions: Distribution by Type of Platform
- Table 14.10 AI in Oncology- based Software Solutions: Distribution by Type of Service(s) Offered and Type of End User
- Table 14.11 AI in Oncology-based Software Solutions: Distribution by Type of Platform and Type of AI Technology Used
- Table 14.12 Roche Diagnostics: Annual Revenues (CHF Billion)
- Table 14.13 IBM Watson Health: Annual Revenues (USD Billion)
- Table 14.14 GE Healthcare: Annual Revenues (USD Billion)
- Table 14.15 Median Technologies: Annual Revenues (EUR Million)
- Table 14.16 iCAD: Annual Revenues (USD Million)
- Table 14.17 Patent Analysis: Distribution by Type of Patents
- Table 14.18 Patent Analysis: Cumulative Distribution by Publication Year
- Table 14.19 Patent Analysis: Year-Wise Distribution of Filed Patent Applications and Granted Patents
- Table 14.20 Patent Analysis: Distribution by Jurisdiction
- Table 14.21 Patent Analysis: Cumulative Distribution by Type of Industry
- Table 14.22 Patent Analysis: Distribution by Patent Age
- Table 14.23 Patent Analysis: Distribution by Legal Status
- Table 14.24 Leading Industry Players: Distribution by Number of Patents
- Table 14.25 Leading Non-Industry Players: Distribution by Number of Patents
- Table 14.26 Patent Analysis: Distribution by Key Inventors
- Table 14.27 AI in Oncology: Patent Valuation Analysis
- Table 14.28 Partnerships and Collaborations: Distribution by Year of Partnership, since 2017
- Table 14.29 Partnerships and Collaborations: Distribution by Type of Partnership
- Table 14.30 Partnerships and Collaborations: Distribution by Year and Type of Partnership
- Table 14.31 Partnerships and Collaborations: Distribution by Company Size and Type of Partnership
- Table 14.32 Most Active Partners: Distribution by Type of Partnership
- Table 14.33 Partnerships and Collaborations: Distribution by Type of Cancer
- Table 14.34 Partnerships and Collaborations: Distribution by Type of Partner
- Table 14.35 Partnerships and Collaborations: Distribution by Year and Type of Partner
- Table 14.36 Partnerships and Collaborations: Intercontinental and Intracontinental Agreement
- Table 14.37 Partnerships and Collaborations: Local and International Agreement
- Table 14.38 Partnerships and Collaborations: Distribution by Country
- Table 14.39 Partnerships and Collaborations: Distribution by Region
- Table 14.40 Most Active Players: Distribution by number of Partnerships
- Table 14.41 Funding and Investment Analysis: Cumulative Year-wise Distribution by Number of Instances, since 2017
- Table 14.42 Funding and Investment Analysis: Cumulative Year-wise Distribution by Amount Invested, since 2017 (USD Billion)
- Table 14.43 Funding and Investment Analysis: Distribution of Instances by Type of Funding
- Table 14.44 Funding and Investment Analysis: Distribution of Amount Invested and Type of Funding (USD Million)
- Table 14.45 Most Active Players: Distribution by Number of Instances
- Table 14.46 Most Active Players: Distribution by Amount Invested (USD Million)
- Table 14.47 Funding and Investment Analysis: Distribution of Funding Instances by Area of Application
- Table 14.48 Funding and Investment Analysis: Distribution of Instances by Focus Area
- Table 14.49 Funding and Investment Analysis: Distribution by Geography
- Table 14.50 Funding and Investment Analysis: Distribution of Instances by Type of Cancer
- Table 14.51 Most Active Investors: Distribution by Number of Instances
- Table 14.52 Funding and Investment Analysis: Distribution by Type of Lead Investors
- Table 14.53 Funding and Investment Analysis: Summary of Investments, since 2017 (USD Million)
- Table 14.54 Global Artificial Intelligence in Oncology Market till 2035, Conservative, Base and Optimistic Scenarios, till 2035 (USD Billion)
- Table 14.55 Artificial Intelligence in Oncology Market: Distribution by Type of Cancer, till 2035
- Table 14.56 Artificial Intelligence in Oncology Market for Breast Cancer, Conservative, Base and Optimistic Scenarios, till 2035 (USD Billion)
- Table 14.57 Artificial Intelligence in Oncology Market for Lung Cancer, Conservative, Base and Optimistic Scenarios, till 2035 (USD Billion)
- Table 14.58 Artificial Intelligence in Oncology Market for Prostate Cancer, Conservative, Base and Optimistic Scenarios, till 2035 (USD Billion)
- Table 14.59 Artificial Intelligence in Oncology Market for Colorectal Cancer, Conservative, Base and Optimistic Scenarios, till 2035 (USD Billion)
- Table 14.60 Artificial Intelligence in Oncology Market for Brain Tumor, Conservative, Base and Optimistic Scenarios, till 2035 (USD Billion)
- Table 14.61 Artificial Intelligence in Oncology Market for Solid Malignancies, Conservative, Base and Optimistic Scenarios, till 2035 (USD Billion)
- Table 14.62 Artificial Intelligence in Oncology Market for Others, Conservative, Base and Optimistic Scenarios, till 2035 (USD Billion)
- Table 14.63 Artificial Intelligence in Oncology Market: Distribution by Type of End-Users, till 2035
- Table 14.64 Artificial Intelligence in Oncology Market for Hospitals, Conservative, Base and Optimistic Scenarios, till 2035 (USD Billion)
- Table 14.65 Artificial Intelligence in Oncology Market for Pharmaceutical Companies, Conservative, Base and Optimistic Scenarios, till 2035 (USD Billion)
- Table 14.66 Artificial Intelligence in Oncology Market for Research Institutes, Conservative, Base and Optimistic Scenarios, till 2035 (USD Billion)
- Table 14.67 Artificial Intelligence in Oncology Market for Other End-Users, Conservative, Base and Optimistic Scenarios, till 2035 (USD Billion)
- Table 14.68 Artificial Intelligence in Oncology Market: Distribution by Key Geographical Regions, till 2035
- Table 14.69 Artificial Intelligence in Oncology Market for North America, Conservative, Base and Optimistic Scenarios, till 2035 (USD Billion)
- Table 14.70 Artificial Intelligence in Oncology Market for Europe, Conservative, Base and Optimistic Scenarios, till 2035 (USD Billion)
- Table 14.71 Artificial Intelligence in Oncology Market for Asia Pacific, Conservative, Base and Optimistic Scenarios, till 2035 (USD Billion)
- Table 14.72 Artificial Intelligence in Oncology Market for Rest of the World, Conservative, Base and Optimistic Scenarios, till 2035 (USD Billion)
List of Figures
- Figure 2.1 Executive Summary: Market Landscape
- Figure 2.2 Executive Summary: Patent Analysis
- Figure 2.3 Executive Summary: Partnerships and Collaboration Analysis
- Figure 2.4 Executive Summary: Funding and Investment Analysis
- Figure 2.5 Executive Summary: Market Forecast and Opportunity Analysis
- Figure 3.1 Historical Evolution of AI
- Figure 3.2 Relationship between AI, ML and DL
- Figure 3.3 Types of Artificial Intelligence
- Figure 3.4 Artificial Intelligence Software Solutions: Distribution by Oncology-related Field
- Figure 3.5 Artificial Intelligence Software Solutions: Distribution by Various Types of Cancers Detected
- Figure 4.1 AI in Oncology Software providers: Distribution by Year of Establishment
- Figure 4.2 AI in Oncology Software providers: Distribution by Company Size
- Figure 4.3 AI in Oncology Software providers: Distribution by Location of Headquarters (Region-wise)
- Figure 4.4 AI in Oncology Software providers: Distribution by Location of Headquarters (Country-wise)
- Figure 4.5 AI in Oncology Software providers: Distribution by Type of End-User
- Figure 4.6 AI in Oncology Software providers: Distribution by Year of Establishment, Company Size and Location of Headquarters
- Figure 4.7 AI in Oncology- based Software Solutions: Distribution by Type of Service(s) Offered
- Figure 4.8 AI in Oncology- based Software Solutions: Distribution by Type of AI Technology Used
- Figure 4.9 AI in Oncology- based Software Solutions: Distribution by Type of Platform
- Figure 4.10 AI in Oncology- based Software Solutions: Distribution by Type of Service(s) Offered and Type of end-user
- Figure 4.11 AI in Oncology Software Solutions: Distribution by Type of Platform and Type of AI Technology Used
- Figure 4.12 AI in Oncology-based Software Solutions: Distribution by Type of Service(s)Offered, Location of Headquarters and Type of AI Technology Used
- Figure 5.1 Roche Diagnostics: Annual Revenues, FY 2017 Onwards (CHF Billion)
- Figure 5.2 Roche Diagnostics: Service Portfolio
- Figure 5.3 IBM Watson Health: Annual Revenues, FY 2017 Onwards (USD Billion)
- Figure 5.4 IBM Watson Health: Service Portfolio
- Figure 5.5 CancerCenter.ai: Service Portfolio
- Figure 5.6 GE Healthcare: Annual Revenues, FY 2017 Onwards (USD Billion)
- Figure 5.7 PathAI: Service Portfolio
- Figure 5.8 BERG: Service Portfolio
- Figure 5.9 Median Technologies: Annual Revenues, FY 2017 Onwards (EUR Million)
- Figure 5.10 iCAD: Annual Revenues, FY 2017 Onwards (USD Million)
- Figure 5.11 iCAD: Distribution of Revenues by Business Units, FY 2021 (USD Million)
- Figure 5.12 JLK Inspection: Service Portfolio
- Figure 6.1 Company Competitiveness Analysis: Small Companies in North America
- Figure 6.2 Company Competitiveness Analysis: Small Companies in Europe
- Figure 6.3 Company Competitiveness Analysis: Small Companies in Asia Pacific
- Figure 6.4 Company Competitiveness Analysis: Mid-sized companies in North America
- Figure 6.5 Company Competitiveness Analysis: Mid-sized companies in Europe
- Figure 6.6 Company Competitiveness Analysis: Mid-sized companies in Asia Pacific
- Figure 6.7 Company Competitiveness Analysis: Large Companies in North America and
- Figure 7.1 Patent Analysis: Distribution by Type of Patents
- Figure 7.2 Patent Analysis: Cumulative Distribution by Publication Year
- Figure 7.3 Patent Analysis: Year-wise Distribution of Filed Patent Applications and Granted Patents
- Figure 7.4 Patent Analysis: Distribution by Jurisdiction
- Figure 7.5 Patent Analysis: Cumulative Distribution by Type of Industry
- Figure 7.6 Patent Analysis: Distribution by Patent Age
- Figure 7.7 Patent Analysis: Distribution by Legal Status
- Figure 7.8 Patent Analysis: Distribution by CPC Symbols
- Figure 7.9 Leading Industry Players: Distribution by Number of Patents
- Figure 7.10 Leading Non-Industry Players: Distribution by Number of Patents
- Figure 7.11 Patent Analysis: Distribution by Key Inventors
- Figure 7.12 Patent Analysis (Top 10 CPC Symbols): Benchmarking by Leading Industry Players
- Figure 7.13 AI in Oncology: Patent Valuation Analysis
- Figure 8.1 Partnerships and Collaborations: Distribution by Year of Partnership, since 2017
- Figure 8.2 Partnerships and Collaborations: Distribution by Type of Partnership
- Figure 8.3 Partnerships and Collaborations: Distribution by Year and Type of Partnership
- Figure 8.4 Partnerships and Collaborations: Distribution by Company Size and Type of Partnership
- Figure 8.5 Most Active Partners: Distribution by Number of Partnerships
- Figure 8.6 Most Active Players: Distribution by Type of Partnership
- Figure 8.7 Partnerships and Collaborations: Distribution by Type of Cancer
- Figure 8.8 Partnerships and Collaborations: Distribution by Type of Partner
- Figure 8.9 Partnerships and Collaborations: Distribution by Year and Type of Partner
- Figure 8.10 Partnerships and Collaborations: Intercontinental and Intracontinental Agreement
- Figure 8.11 Partnerships and Collaborations: Local and International Agreement
- Figure 8.12 Partnerships and Collaborations: Distribution by Country
- Figure 8.13 Partnerships and Collaborations: Distribution by Region
- Figure 9.1 Funding and Investment Analysis: Cumulative Year-wise Distribution by Number of Instances, since 2017
- Figure 9.2 Funding and Investment Analysis: Cumulative Year-wise Distribution by Amount Invested, since 2017 (USD Billion)
- Figure 9.3 Funding and Investment Analysis: Distribution of Instances by Type of Funding Figure 9.4 Funding and Investment Analysis: Distribution of Amount Invested by Year and
Type of Funding, since 2017 (USD Million)
- Figure 9.5 Funding and Investment Analysis: Distribution by Amount Invested and Type of Funding (USD Billion)
- Figure 9.6 Funding and Investment Analysis: Distribution of Funding Instances by Area of Application
- Figure 9.7 Funding and Investment Analysis: Distribution of Instances by Focus Area
- Figure 9.8 Funding and Investment Analysis: Distribution of Instances by Type of Cancer
- Figure 9.9 Funding and Investment Analysis: Distribution by Geography
- Figure 9.10 Most Active Players: Distribution by Number of Instances
- Figure 9.11 Most Active Players: Distribution by Amount Invested (USD Million)
- Figure 9.12 Funding and Investment Analysis: Distribution by Type of Investors
- Figure 9.13 Most Active Investors: Distribution by Number of Instances
- Figure 9.14 Funding and Investment Analysis: Summary of Amount Invested, since 2017 (USD Million)
- Figure 9.15 Funding and Investment Analysis: Concluding Remarks
- Figure 10.1 Red Ocean Strategy vs Blue Ocean Strategy
- Figure 10.2 Blue Ocean Strategy: Strategy Canvas
- Figure 10.3 Blue Ocean Strategy: Eliminate-Raise-Reduce-Create (ERRC) Grid
- Figure 10.4 Blue Ocean Strategy: Pioneer-Migrator-Settler (PMS) Map
- Figure 10.5 Blue Ocean Strategy: Three Tiers of Noncustomers
- Figure 10.6 Blue Ocean Strategy: Sequence of Blue Ocean Strategy
- Figure 10.7 Blue Ocean Strategy: Buyer Utility Map
- Figure 10.8 Blue Ocean Strategy: The Price Corridor of the Mass
- Figure 11.1 Global Artificial Intelligence in Oncology Market, till 2035 (USD Billion)
- Figure 11.2 Artificial Intelligence in Oncology Market: Distribution by Type of Cancer, till 2035 (USD Billion)
- Figure 11.3 Artificial Intelligence in Oncology Market for Breast Cancer, till 2035 (USD Billion)
- Figure 11.4 Artificial Intelligence in Oncology Market for Lung Cancer, till 2035 (USD Billion)
- Figure 11.5 Artificial Intelligence in Oncology Market for Prostate Cancer, till 2035 (USD Billion)
- Figure 11.6 Artificial Intelligence in Oncology Market for Colorectal Cancer, till 2035 (USD Billion)
- Figure 11.7 Artificial Intelligence in Oncology Market for Brain Tumor, till 2035 (USD Billion)
- Figure 11.8 Artificial Intelligence in Oncology Market for Solid Malignancies, till 2035 (USD Billion)
- Figure 11.9 Artificial Intelligence in Oncology Market for Others, till 2035 (USD Billion)
- Figure 11.10 Artificial Intelligence in Oncology Market: Distribution by Type of End-User, till 2035 (USD Billion)
- Figure 11.11 Artificial Intelligence in Oncology Market for Hospitals, till 2035 (USD Billion)
- Figure 11.12 Artificial Intelligence in Oncology Market for Pharmaceutical Companies, till 2035 (USD Billion)
- Figure 11.13 Artificial Intelligence in Oncology Market for Research Institutes, till 2035 (USD Billion)
- Figure 11.14 Artificial Intelligence in Oncology Market for Other End- Users, till 2035 (USD Billion)
- Figure 11.15 Artificial Intelligence in Oncology Market: Distribution by Geography, till 2035 (USD Billion)
- Figure 11.16 Artificial Intelligence in Oncology Market for North America, till 2035 (USD Billion)
- Figure 11.17 Artificial Intelligence in Oncology Market for Europe, till 2035 (USD Billion)
- Figure 11.18 Artificial Intelligence in Oncology Market for Asia Pacific, till 2035 (USD Billion)
- Figure 11.19 Artificial Intelligence in Oncology Market for Rest of the World, till 2035 (USD Billion)
- Figure 12.1 Concluding Remarks: AI in Oncology Market Landscape
- Figure 12.2 Concluding Remarks: Patent Analysis
- Figure 12.3 Concluding Remarks: Partnerships and Collaborations Analysis
- Figure 12.4 Concluding Remarks: Funding and Investment Analysis
- Figure 12.5 Concluding Remarks: Market Forecast and Opportunity Analysis
 精准肿瘤技术市场分析与预测(2034 年):类型、产品、服务、技术、应用、最终用户、组件、部署和阶段
 肿瘤学人工智慧市场-全球产业规模、份额、趋势、机会和预测,按成分、癌症类型、治疗类型、地区和竞争细分,2020-2030 年
 全球抗癌药物市场:2025-2030 年预测
 癌症领域的精密医疗的共同研究及授权契约:2016年~2025年
 抗癌药物市场按药物类别、给药途径、分子类型、适应症、最终用户和分销管道划分-2025-2030 年全球预测
 全球肿瘤人工智慧市场:按成分、按癌症类型、按治疗类型、按最终用户、按地区虚拟肿瘤学市场:按成分、癌症类型、应用、最终用户和地区划分
 医师调查:肿瘤科医师认为人工智慧将塑造癌症治疗的未来癌症治疗市场按分销管道、药物类型、癌症类型、治疗方法、给药途径和地区划分精准肿瘤学市场规模、份额、趋势分析报告(依产品类型、癌症类型、最终用途、地区、细分预测),2025-2030 年