


 |
市场调查报告书
商品编码
1682709
血浆分馏的全球市场:各类型企业,各产业规模,被製造的血浆衍生治疗产品类型,血浆衍生产品的各治疗领域,各主要地区:2035年前的产业趋势与全球预测Plasma Fractionation Market by Type of Company, Scale of Operation, Type of Plasma-derived Therapeutic Products Manufactured, Therapeutic Areas of Plasma-derived Products and Key Geographical Regions : Industry Trends and Global Forecasts, Till 2035 |
||||||
预计到 2035 年,全球血浆分馏市场规模将从目前的 48 亿美元增长至 127 亿美元,在预测期内以 9.2% 的复合年增长率增长。
血浆分馏市场受到治疗多种疾病对血浆衍生疗法日益增长的需求的推动,主要包括肿瘤学、血液学、肺部疾病和免疫疾病。血浆分馏是可靠分离和纯化血浆主要成分(如免疫球蛋白、白蛋白、抗凝血剂和蛋白酶抑制剂)的关键步骤。纯化的血浆成分可用于配製治疗药物。值得注意的是,在血浆衍生疗法中,免疫球蛋白预计需求量最高。血浆供应有限和缺乏适当监管框架等挑战可能会阻碍市场成长。
儘管面临诸多挑战,但由于目标疾病适应症范围更广(尤其是罕见疾病和慢性病)、诊断率提高以及新兴市场医疗保健标准的提高,血浆衍生疗法正迅速普及。在血浆分离疗法需求不断增长和分离製造技术进步的推动下,血浆分离市场预计在未来将以惊人的速度成长。
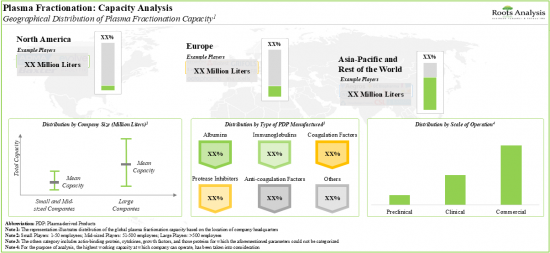
目前,有超过 35 家公司声称拥有开发血浆衍生疗法所需的血浆分馏专业知识,其中近 50% 的公司在已开发地区设有设施。大多数血浆分离供应商都已成熟,约 75% 有能力提供配方服务。近年来,该领域的合作伙伴关係稳步增加,其中大多数是欧洲的企业併购。为了满足对血浆衍生疗法日益增长的需求,血浆成分製造商正在投资扩大其在各个地区的现有产能。全球超过 90% 的血浆成分生产能力用于生产商业用途的白蛋白和免疫球蛋白。
随着人们越来越重视开发有效的血浆衍生疗法,血浆分馏市场预计在未来十年内每年将以约 10% 的速度成长。
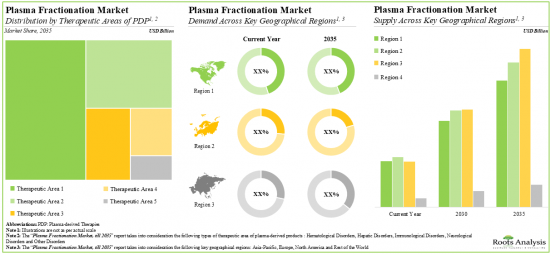
从长远来看,针对免疫相关疾病的血浆衍生疗法可能会成为血浆分馏市场的主要成长动力,预计亚太地区的成长速度最快。
本报告提供全球血浆分馏市场相关调查,提供市场概要,以及各类型企业,各产业规模,製造的血浆衍生治疗产品类型,血浆衍生产品的各治疗领域,各主要地区的趋势,及加入此市场的主要企业简介等资讯。
目录
第1章 序文
第2章 摘要整理
第3章 简介
第4章 血浆分馏法:市场形势
第5章 企业竞争力分析
第6章 企业简介
第7章 伙伴关係和合作
第8章 最近的扩张
第9章 容量分析
第10章 市场规模的评估机会分析
第11章 结论
第12章 执行洞察
第13章 附录I:表格形式资料
第14章 附录II:企业及团体一览
PLASMA FRACTIONATION MARKET: OVERVIEW
As per Roots Analysis, the global plasma fractionation market is estimated to grow from USD 4.8 billion in the current year to USD 12.7 billion by 2035, at a CAGR of 9.2% during the forecast period, till 2035.
The market sizing and opportunity analysis has been segmented across the following parameters:
Type of Company
- In-house Manufacturers
- Contract Service Providers
Scale of Operation
- Preclinical
- Clinical
- Commercial
Type of Plasma-derived Therapeutic Products Manufactured
- Albumins
- Coagulation Factors
- Immunoglobulins
- Protease Inhibitors
- Other Plasma-derived Products
Therapeutic Areas of Plasma-derived Products
- Hematological Disorders
- Hepatic Disorders
- Immunological Disorders
- Neurological Disorders
- Other Disorders
Key Geographical Regions
- North America
- Europe
- Asia-Pacific
- Rest of the World
PLASMA FRACTIONATION MARKET: GROWTH AND TRENDS
The plasma fractionation market is primarily driven by the growing demand for plasma-derived therapies for treating several disease indications, such as oncological disorders, hematological disorders, pulmonary disorders and immunological disorders. Plasma fractionation is a critical step to ensure the separation and purification of key blood plasma components, such as immunoglobulins, albumins, anticoagulant factors and protease inhibitors. The refined blood plasma components can then be used for the formulation of therapeutics. It is interesting to note that among all the plasma-derived therapies, demand for immunoglobulins is anticipated to be the highest. The anticipated growth of the market can be hindered by challenges, such as limited blood plasma supply and a lack of proper regulatory framework.
Despite several challenges, owing to a broader spectrum of target disease indications (specifically rare and chronic diseases), improved diagnosis rates, and higher standards of healthcare in emerging markets, the popularity of plasma-derived therapies is rapidly increasing. Driven by the growing demand for blood plasma therapies and the ongoing advancements in fractionation manufacturing technologies, the plasma fractionation market is expected to grow at a noteworthy pace in the foreseen future.
PLASMA FRACTIONATION MARKET: KEY INSIGHTS
The report delves into the current state of the plasma fractionation market and identifies potential growth opportunities within the industry. Some key findings from the report include:
1. Currently, more than 35 companies claim to have the expertise for blood plasma fractionation, required for the development of plasma-derived therapies; of which, nearly 50% of the players have facilities in developed regions.
2. Majority of the plasma fractionators are well-established players; ~75% of the players have the capabilities for offering formulation services.
3. In recent years, the domain witnessed a steady growth in partnership activity; the majority of the initiatives were mergers and acquisitions carried out by players based in Europe.
4. Owing to the growing demand for plasma-derived therapies, plasma fractionators are investing in expanding their existing capabilities across various regions; of these, ~30% of the initiatives were undertaken in North America.
5. Over 90% of the global installed plasma fractionation capacity is dedicated to the manufacturing of albumins and immunoglobulins for commercial applications.
6. With the growing focus on the development of efficacious plasma-derived therapies, the plasma fractionation market is anticipated to witness an annualized growth of ~10%, over the next decade.
7. In the long term, the plasma-derived therapies for immunological disorders are likely to emerge as the key growth drivers of the plasma fractionation market; Asia-Pacific is anticipated to be the fastest growing region.
PLASMA FRACTIONATION MARKET: KEY SEGMENTS
In-House manufacturers Occupy the Largest Share of the Plasma Fractionation Market
Based on the type of company, the market is segmented into in-house manufacturers and contract service providers. At present, in-house manufacturers capture the highest share of the plasma fractionation market. It is worth highlighting that the plasma fractionation market for contract service providers is likely to grow at a relatively higher CAGR.
By Scale of Operation, Commercial Scale is Likely to Dominate the Plasma Fractionation Market During the Forecast Period
Based on the scale of operation, the market is segmented into preclinical, clinical and commercial scale. Currently, the commercial scale holds the highest share of the plasma fractionation market. This trend is unlikely to change in the near future.
Immunoglobulins Segment Occupies the Largest Share of the Plasma Fractionation Market
Based on the type of plasma-derived therapeutic products manufactured, the market is segmented into albumin, coagulation factors, immunoglobulins, protease inhibitors and other plasma-derived products. At present, immunoglobulins hold the maximum share of the plasma fractionation market. This trend is likely to remain the same in the forthcoming years.
Oncological Disorders Account for the Largest Share of the Plasma Fractionation Market
Based on the therapeutic areas of plasma-derived products, the market is segmented into hematological disorders, hepatic disorders, immunological disorders, neurological disorders and other disorders. While immunological disorders account for a relatively higher market share, it is worth highlighting that neurological disorders are expected to witness substantial growth in the coming years.
Europe Accounts for the Largest Share of the Market
Based on key geographical regions, the market is segmented into North America, Europe, Asia-Pacific and Rest of the world. The majority share is expected to be captured by players based in Europe. It is worth highlighting that, over the years, the market in Asia-Pacific is expected to grow at a higher CAGR.
Example Players in the Plasma Fractionation Market
- Baxter
- Grifols
- Kedrion
- Octapharma
- CSL
- Takeda Pharmaceutical
PLASMA FRACTIONATION MARKET: RESEARCH COVERAGE
- Market Sizing and Opportunity Analysis: The report features an in-depth analysis of the plasma fractionation market, focusing on key market segments, including [A] type of company, [B] scale of operation, [C] type of plasma-derived therapeutic products manufactured, [D] therapeutic areas of plasma-derived products and [E] key geographical regions.
- Market Landscape: A comprehensive evaluation of plasma fractionation companies, considering various parameters, such as [A] year of establishment, [B] company size (in terms of number of employees), [C] location of headquarters, [D] type of company, [E] location of plasma fractionation facilities, [F] location of plasma collection facility, [F] availability of patented / proprietary technology, [G] additional fractionation capabilities, [H] scale of operation, [I] type of plasma-derived therapeutic products manufactured, [J] therapeutic areas of plasma-derived products and [K] end users.
- Company Competitiveness Analysis: A comprehensive competitive analysis of plasma fractionation companies based in North America, Europe, Asia-Pacific and rest of the world, examining factors, such as [A] company strength and [B] portfolio strength.
- Company Profiles: In-depth profiles of key plasma fractionation service providers, focusing on [A] company overviews, [B] financial information (if available), [C] plasma fractionation portfolio, [D] recent developments and [E] an informed future outlook.
- Partnerships and Collaborations: An analysis of partnerships established in this sector, since 2018, based on several parameters, such as [A] year of partnership, [B] type of partnership, [C] purpose of agreement, [D] type of plasma-derived therapeutic products manufactured, [E] type of partner, [F] most active players and [G] regional distribution of the companies involved in these agreements.
- Recent Expansions: An examination of the different expansion efforts made by plasma fractionation companies in this field to enhance their capabilities, since 2018. This analysis considers various factors, including the [A] year of expansion, [B] type of expansion, [C] type of facility, [D] location of expanded facility, [E] type of plasma-derived therapeutic products manufactured and [F] most active players.
- Capacity Analysis: Estimation of global fractionation capacity, derived from data provided by various stakeholders in the public domain. This analysis emphasizes the distribution of the available capacity on the basis of [A] company size (small, mid-sized and large), [B] type of plasma-derived therapeutic products manufactured (albumins, anti-coagulation factors, coagulation factors, immunoglobulins, protease inhibitors and other plasma-derived products), [C] scale of operation (preclinical, clinical and commercial) and [D] key geographical region (North America, Europe, Asia-Pacific and rest of the world).
KEY QUESTIONS ANSWERED IN THIS REPORT
- How many companies are currently engaged in this market?
- Which are the leading companies in this market?
- What is the annual plasma fractionation capacity?
- What kind of partnership models are commonly adopted by industry stakeholders?
- What factors are likely to influence the evolution of this market?
- What is the current and future market size?
- What is the CAGR of this market?
- How is the current and future market opportunity likely to be distributed across key market segments?
REASONS TO BUY THIS REPORT
- The report provides a comprehensive market analysis, offering detailed revenue projections of the overall market and its specific sub-segments. This information is valuable to both established market leaders and emerging entrants.
- Stakeholders can leverage the report to gain a deeper understanding of the competitive dynamics within the market. By analyzing the competitive landscape, businesses can make informed decisions to optimize their market positioning and develop effective go-to-market strategies.
- The report offers stakeholders a comprehensive overview of the market, including key drivers, barriers, opportunities, and challenges. This information empowers stakeholders to stay abreast of market trends and make data-driven decisions to capitalize on growth prospects.
ADDITIONAL BENEFITS
- Complimentary PPT Insights Packs
- Complimentary Excel Data Packs for all Analytical Modules in the Report
- 10% Free Content Customization
- Detailed Report Walkthrough Session with Research Team
- Free Updated report if the report is 6-12 months old or older
TABLE OF CONTENTS
1. PREFACE
- 1.1. Plasma Fractionation Market Overview
- 1.2. Key Market Insights
- 1.3. Scope of the Report
- 1.4. Research Methodology
- 1.5. Frequently Asked Questions
- 1.6. Chapter Outlines
2. EXECUTIVE SUMMARY
3. INTRODUCTION
- 3.1. Chapter Overview
- 3.2. Introduction to Blood Plasma
- 3.2.1. Plasma Collection
- 3.2.2. Plasma Screening
- 3.2.3. Plasma Fractionation
- 3.3. Applications of Plasma Fractionation
- 3.4. Challenges Associated with Plasma Fractionation
- 3.5. Need for Third-party Service Providers
- 3.5.1. Overview of Third-party Service Providers
- 3.6. Future Perspectives
4. PLASMA FRACTIONATION: MARKET LANDSCAPE
- 4.1. Chapter Overview
- 4.2. Plasma Fractionation: Overall Market Landscape
- 4.2.1. Analysis by Year of Establishment
- 4.2.2. Analysis by Company Size
- 4.2.3. Analysis by Location of Headquarters (Region)
- 4.2.4. Analysis by Location of Headquarters (Country)
- 4.2.5. Analysis by Year of Establishment and Location of Headquarters (Region)
- 4.2.6. Analysis by Company Size and Location of Headquarters (Region)
- 4.2.7. Analysis by Type of Company
- 4.2.8. Analysis by Location of Plasma Fractionation Facilities (Region)
- 4.2.9. Analysis by Location of Plasma Collection Facility
- 4.2.10. Analysis by Availability of Patented / Proprietary Technology
- 4.2.11. Analysis by Additional Fractionation Capabilities
- 4.2.12. Analysis by Scale of Operation
- 4.2.13. Analysis by Type of Plasma-derived Therapeutic Products Manufactured
- 4.2.14. Analysis by Therapeutic Areas of Plasma-derived Products
- 4.2.15. Analysis by End Users
- 4.2.16. Information on Plasma Fractionation Capacity and Accreditation / Certification
- 4.2.17. Information on Upcoming Plasma Fractionation Facilities
- 4.2.18. Information on Companies Previously Involved in Plasma Fractionation
5. COMPANY COMPETITIVENESS ANALYSIS
- 5.1. Chapter Overview
- 5.2. Assumptions and Key Parameters
- 5.3. Methodology
- 5.4. Company Competitiveness Analysis: In-house Manufacturers
- 5.4.1. Players based in North America and Europe
- 5.4.2. Players based in Asia-Pacific and Rest of the World
- 5.5. Company Competitiveness Analysis: In-house Manufacturers and Contract Service Providers
- 5.5.1. Players based in North America and Europe
- 5.5.2. Players based in Asia-Pacific and Rest of the World
6. COMPANY PROFILES
- 6.1. Chapter Overview
- 6.2. Companies Headquartered in North America
- 6.2.1. Baxter
- 6.2.1.1. Company Overview
- 6.2.1.2. Financial Information
- 6.2.1.3. Plasma Fractionation Portfolio
- 6.2.1.4. Recent Developments and Future Outlook
- 6.2.1. Baxter
- 6.3. Companies Headquartered in Europe
- 6.3.1. Grifols
- 6.3.1.1. Company Overview
- 6.3.1.2. Financial Information
- 6.3.1.3. Plasma Fractionation Portfolio
- 6.3.1.4. Recent Developments and Future Outlook
- 6.3.2. Kedrion
- 6.3.2.1. Company Overview
- 6.3.2.2. Financial Information
- 6.3.2.3. Plasma Fractionation Portfolio
- 6.3.2.4. Recent Developments and Future Outlook
- 6.3.3. Octapharma
- 6.3.3.1. Company Overview
- 6.3.3.2. Financial Information
- 6.3.3.3. Plasma Fractionation Portfolio
- 6.3.3.4. Recent Developments and Future Outlook
- 6.3.1. Grifols
- 6.4. Companies Headquartered in Asia-Pacific
- 6.4.1. CSL
- 6.4.1.2. Company Overview
- 6.4.1.3. Financial Information
- 6.4.1.4. Plasma Fractionation Portfolio
- 6.4.1.5. Recent Developments and Future Outlook
- 6.4.2. Takeda Pharmaceutical
- 6.4.2.1. Company Overview
- 6.4.2.2. Financial Information
- 6.4.2.3. Plasma Fractionation Portfolio
- 6.4.2.4. Recent Developments and Future Outlook
- 6.4.1. CSL
7. PARTNERSHIPS AND COLLABORATIONS
- 7.1. Chapter Overview
- 7.2. Partnership Models
- 7.3. Plasma Fractionation: Partnerships and Collaborations
- 7.3.1. Analysis by Year of Partnership
- 7.3.2. Analysis by Type of Partnership
- 7.3.3. Analysis by Year and Type of Partnership
- 7.3.4. Analysis by Purpose of Agreement
- 7.3.5. Analysis by Type of Plasma-derived Therapeutic Products Manufactured
- 7.3.6. Analysis by Type of Partner
- 7.3.7. Analysis by Year of Partnership and Type of Partner
- 7.3.8. Analysis by Type of Partnership and Type of Partner
- 7.3.9. Most Active Players: Analysis by Number of Partnerships
- 7.4. Analysis by Geography
- 7.4.1. Local and International Agreements
- 7.4.2. Intracontinental and Intercontinental Agreements
8. RECENT EXPANSIONS
- 8.1. Chapter Overview
- 8.2. Expansion Models
- 8.3. Plasma Fractionation: Recent Expansions
- 8.3.1. Analysis by Year of Expansion
- 8.3.2. Analysis by Type of Expansion
- 8.3.3. Analysis by Year and Type of Expansion
- 8.3.4. Analysis by Type of Facility
- 8.3.5. Analysis by Location of Expanded Facility
- 8.3.6. Analysis by Year and Location of Expanded Facility
- 8.3.7. Analysis by Plasma-derived Therapeutic Products Manufactured
- 8.3.8. Most Active Players: Analysis by Number of Expansions
9. CAPACITY ANALYSIS
- 9.1. Chapter Overview
- 9.2. Key Assumptions and Methodology
- 9.2.1. Annual Plasma Fractionation Capacity
- 9.2.1.1. Analysis by Company Size
- 9.2.1.2. Analysis by Type of Plasma-derived Therapeutic Products Manufactured
- 9.2.1.3. Analysis by Scale of Operation
- 9.2.2. Analysis by Location of Plasma Fractionation Facility
- 9.2.3. Analysis by Location of Headquarters
- 9.2.1. Annual Plasma Fractionation Capacity
- 9.3. Concluding Remarks
10. MARKET SIZING AND OPPURTUNITY ANALYSIS
- 10.1. Chapter Overview
- 10.2. Key Assumptions and Forecast Methodology
- 10.3. Global Plasma Fractionation Market (Historical, Base and Forecasted Scenario), 2017-2035
- 10.3.1. Plasma Fractionation Market: Distribution by Type of Company, 2017, 2023 and 2035
- 10.3.1.1. Plasma Fractionation Market for In-house Manufacturers, till 2035
- 10.3.1.2. Plasma Fractionation Market for Contract Service Providers, till 2035
- 10.3.2. Plasma Fractionation Market: Distribution by Scale of Operation, 2017, 2023 and 2035
- 10.3.2.1. Plasma Fractionation Market for Preclinical, till 2035
- 10.3.2.2. Plasma Fractionation Market for Clinical, till 2035
- 10.3.2.3. Plasma Fractionation Market for Commercial, till 2035
- 10.3.3. Plasma Fractionation Market: Distribution by Type of Plasma-derived Therapeutic Products Manufactured, 2017, 2023 and 2035
- 10.3.3.1. Plasma Fractionation Market for Albumins, till 2035
- 10.3.3.2. Plasma Fractionation Market for Coagulation Factors, till 2035
- 10.3.3.3. Plasma Fractionation Market for Immunoglobulins, till 2035
- 10.3.3.4. Plasma Fractionation Market for Protease Inhibitors, till 2035
- 10.3.3.5. Plasma Fractionation Market for Other Plasma-derived Products, till 2035
- 10.3.4. Plasma Fractionation Market: Distribution by Therapeutic Areas of Plasma-derived Products, 2017, 2023 and 2035
- 10.3.4.1. Plasma Fractionation Market for Hematological Disorders, till 2035
- 10.3.4.2. Plasma Fractionation Market for Hepatic Disorders, till 2035
- 10.3.4.3. Plasma Fractionation Market for Immunological Disorders, till 2035
- 10.3.4.4. Plasma Fractionation Market for Neurological Disorders, till 2035
- 10.3.4.5. Plasma Fractionation Market for Other Disorders, till 2035
- 10.3.5. Plasma Fractionation Market: Distribution by Demand across Key Geographical Regions, 2017, 2023 and 2035
- 10.3.5.1. Plasma Fractionation Market in North America, till 2035
- 10.3.5.2. Plasma Fractionation Market in Europe, till 2035
- 10.3.5.3. Plasma Fractionation Market in Asia-Pacific, till 2035
- 10.3.5.4. Plasma Fractionation Market in Rest of the World, till 2035
- 10.3.6. Plasma Fractionation Market: Distribution by Supply across Key Geographical Regions, 2017, 2023 and 2035
- 10.3.6.1. Plasma Fractionation Market in North America, till 2035
- 10.3.6.2. Plasma Fractionation Market in Europe, till 2035
- 10.3.6.3. Plasma Fractionation Market in Asia-Pacific, till 2035
- 10.3.6.4. Plasma Fractionation Market in Rest of the World, till 2035
- 10.3.1. Plasma Fractionation Market: Distribution by Type of Company, 2017, 2023 and 2035
11. CONCLUDING REMARKS
12. EXECUTIVE INSIGHTS
13. APPENDIX I: TABULATED DATA
14. APPENDIX II: LIST OF COMPANIES AND ORGANIZATIONS
List of Tables
- Table 4.1 List of Plasma Fractionators
- Table 4.2 Plasma Fractionators: Information on Plasma Fractionation Facilities
- Table 4.3 Plasma Fractionators: Information on Plasma Collection Facilities
- Table 4.4 Plasma Fractionators: Information on Patented / Proprietary Technology / Process Used
- Table 4.5 Plasma Fractionators: Information on Additional Fractionation Capabilities
- Table 4.6 Plasma Fractionators: Information on Scale of Operation
- Table 4.7 Plasma Fractionators: Information on Type of Plasma-derived Therapeutic Products Manufactured
- Table 4.8 Plasma Fractionators: Information on Therapeutic Areas of Plasma-derived Products
- Table 4.9 Plasma Fractionators: Information on End Users
- Table 4.10 Plasma Fractionators: Information on Plasma Fractionation Capacity and Accreditation / Certification
- Table 4.11 Plasma Fractionators: Information on Upcoming Plasma Fractionation Facilities
- Table 4.12 Plasma Fractionators: Information on Companies Previously Involved in Plasma Fractionation
- Table 4.13 Plasma Fractionation: List of Additional Players
- Table 6.1 Plasma Fractionation: List of Companies Profiled
- Table 6.2 Baxter: Company Snapshot
- Table 6.3 Baxter: Plasma Fractionation Portfolio
- Table 6.4 Baxter: Recent Developments and Future Outlook
- Table 6.5 Grifols: Company Snapshot
- Table 6.6 Grifols: Plasma Fractionation Portfolio
- Table 6.7 Grifols: Recent Developments and Future Outlook
- Table 6.8 Kedrion: Company Snapshot
- Table 6.9 Kedrion: Plasma Fractionation Portfolio
- Table 6.10 Kedrion: Recent Developments and Future Outlook
- Table 6.11 Octapharma: Company Snapshot
- Table 6.12 Octapharma: Plasma Fractionation Portfolio
- Table 6.13 Octapharma: Recent Developments and Future Outlook
- Table 6.14 CSL: Company Snapshot
- Table 6.15 CSL: Plasma Fractionation Portfolio
- Table 6.16 CSL: Recent Developments and Future Outlook
- Table 6.17 Takeda Pharmaceutical: Company Snapshot
- Table 6.18 Takeda Pharmaceutical: Plasma Fractionation Portfolio
- Table 6.19 Takeda Pharmaceutical: Recent Developments and Future Outlook
- Table 7.1 Plasma Fractionation: Partnerships and Collaborations
- Table 7.2 Plasma Fractionation: Information on Location of Partner (Country and Region)
- Table 8.1 Plasma Fractionation: Recent Expansions
- Table 8.2 Recent Expansions: Information on Type of Plasma-derived Therapeutic Products Manufactured
- Table 9.1 Annual Plasma Fractionation Capacity: Average Capacity Per Facility by Company Size of Fractionators (Sample Data Set)
- Table 9.2 Annual Plasma Fractionation Capacity: Distribution by Company Size
- Table 13.1 Plasma Fractionators: Distribution by Year of Establishment
- Table 13.2 Plasma Fractionators: Distribution by Company Size
- Table 13.3 Plasma Fractionators: Distribution by Location of Headquarters (Region)
- Table 13.4 Plasma Fractionators: Distribution by Location of Headquarters (Country)
- Table 13.5 Plasma Fractionators: Distribution by Year of Establishment and Location of Headquarters (Region)
- Table 13.6 Plasma Fractionators: Distribution by Company Size and Location of Headquarters (Region)
- Table 13.7 Plasma Fractionators: Distribution by Type of Company
- Table 13.8 Plasma Fractionators: Distribution by Location of Plasma Fractionation Facilities (Region)
- Table 13.9 Plasma Fractionators: Distribution by Location of Plasma Collection Facility
- Table 13.10 Plasma Fractionators: Distribution by Availability of Patented / Proprietary Technology
- Table 13.11 Plasma Fractionators: Distribution by Additional Fractionation Capabilities
- Table 13.12 Plasma Fractionators: Distribution by Scale of Operation
- Table 13.13 Plasma Fractionators: Distribution by Type of Plasma-derived Therapeutic Products Manufactured
- Table 13.14 Plasma Fractionators: Distribution by Therapeutic Areas of Plasma-derived Products
- Table 13.15 Plasma Fractionators: Distribution by End Users
- Table 13.16 Baxter: Annual Revenues, FY 2018 Onwards (USD Billion)
- Table 13.17 Grifols: Annual Revenues, FY 2018 Onwards (EUR Million)
- Table 13.18 Kedrion: Annual Revenues, FY 2018 Onwards (EUR Million)
- Table 13.19 Octapharma: Annual Revenues, FY 2018 Onwards (EUR Billion)
- Table 13.20 CSL: Annual Revenues, FY 2018 Onwards (USD Million)
- Table 13.21 Takeda Pharmaceutical: Annual Revenues, FY 2018 Onwards (JPY Billion)
- Table 13.22 Partnerships and Collaborations: Cumulative Year-wise Distribution of Partnerships
- Table 13.23 Partnerships and Collaborations: Distribution by Type of Partnership
- Table 13.24 Partnerships and Collaborations: Distribution by Year and Type of Partnership
- Table 13.25 Partnerships and Collaborations: Distribution by Purpose of Agreement
- Table 13.26 Partnerships and Collaborations: Distribution by Type of Plasma-derived Therapeutic Products Manufactured
- Table 13.27 Partnerships and Collaborations: Distribution by Type of Partner
- Table 13.28 Partnerships and Collaborations: Distribution by Year of Partnership and Type of Partner
- Table 13.29 Partnerships and Collaborations: Distribution by Type of Partnership and Type of Partner
- Table 13.30 Most Active Players: Distribution by Number of Partnerships
- Table 13.31 Partnerships and Collaborations: Distribution by Local and International Agreements
- Table 13.32 Partnerships and Collaborations: Distribution by Intracontinental and Intercontinental Agreements
- Table 13.33 Recent Expansions: Cumulative Year-wise Distribution of Expansions
- Table 13.34 Recent Expansions: Distribution by Type of Expansion
- Table 13.35 Recent Expansions: Distribution by Year and Type of Expansion
- Table 13.36 Recent Expansions: Distribution by Type of Facility
- Table 13.37 Recent Expansions: Distribution by Location of Expanded Facility
- Table 13.38 Recent Expansions: Distribution by Year and Location of Expanded Facility
- Table 13.39 Recent Expansions: Distribution by Plasma-derived Therapeutic Products Manufactured
- Table 13.40 Most Active Players: Distribution by Number of Expansions
- Table 13.41 Annual Plasma Fractionation Capacity: Distribution by Range of Installed Capacity
- Table 13.42 Annual Plasma Fractionation Capacity: Distribution by Company Size
- Table 13.43 Annual Plasma Fractionation Capacity: Distribution by Type of Plasma-derived Therapeutic Products Manufactured
- Table 13.44 Annual Plasma Fractionation Capacity: Distribution by Scale of Operation
- Table 13.45 Plasma Fractionation Capacity: Distribution by Location of Plasma Fractionation Facilities
- Table 13.46 Plasma Fractionation Capacity: Distribution by Location of Headquarters (in Million Liters)
- Table 13.47 Global Plasma Fractionation Market (Historical, Base and Forecasted Scenario), till 2035 (USD Billion)
- Table 13.48 Plasma Fractionation Market: Distribution by Type of Company, 2017, 2023 and 2035 (USD Billion)
- Table 13.49 Plasma Fractionation Market for In-house Manufacturers, till 2035 (USD Billion)
- Table 13.50 Plasma Fractionation Market for Contract Service Providers, till 2035 (USD Billion)
- Table 13.51 Plasma Fractionation Market: Distribution by Scale of Operation, 2017, 2023 and 2035 (USD Billion)
- Table 13.52 Plasma Fractionation Market for Preclinical Operations, till 2035 (USD Billion)
- Table 13.53 Plasma Fractionation Market for Clinical Operations, till 2035 (USD Billion)
- Table 13.54 Plasma Fractionation Market for Commercial Operations, till 2035 (USD Billion)
- Table 13.55 Plasma Fractionation Market: Distribution by Type of Plasma-derived Therapeutic Products Manufactured, 2017, 2023 and 2035 (USD Billion)
- Table 13.56 Plasma Fractionation Market for Albumins, till 2035 (USD Billion)
- Table 13.57 Plasma Fractionation Market for Coagulation Factors, till 2035 (USD Billion)
- Table 13.58 Plasma Fractionation Market for Immunoglobulins, till 2035 (USD Billion)
- Table 13.59 Plasma Fractionation Market for Protease Inhibitors, till 2035 (USD Billion)
- Table 13.60 Plasma Fractionation Market for Other Plasma-derived Products, till 2035 (USD Billion)
- Table 13.61 Plasma Fractionation Market: Distribution by Therapeutic Areas of Plasma-derived Products, 2017, 2023 and 2035 (USD Billion)
- Table 13.62 Plasma Fractionation Market for Hematological Disorders, till 2035 (USD Billion)
- Table 13.63 Plasma Fractionation Market for Hepatic Disorders, till 2035 (USD Billion)
- Table 13.64 Plasma Fractionation Market for Immunological Disorders, till 2035 (USD Billion)
- Table 13.65 Plasma Fractionation Market for Neurological Disorders, till 2035 (USD Billion)
- Table 13.66 Plasma Fractionation Market for Other Disorders, till 2035 (USD Billion)
- Table 13.67 Plasma Fractionation Market: Distribution by Demand across Key Geographical Regions, 2017, 2023 and 2035 (USD Billion)
- Table 13.68 Plasma Fractionation Market for North America, till 2035 (USD Billion)
- Table 13.69 Plasma Fractionation Market for Europe, till 2035 (USD Billion)
- Table 13.70 Plasma Fractionation Market for Asia-Pacific, till 2035 (USD Billion)
- Table 13.71 Plasma Fractionation Market for Rest of the World, till 2035 (USD Billion)
- Table 13.72 Plasma Fractionation Market: Distribution by Supply across Key Geographical Regions, 2017, 2023 and 2035 (USD Billion)
- Table 13.73 Plasma Fractionation Market for North America, till 2035 (USD Billion)
- Table 13.74 Plasma Fractionation Market for Europe, till 2035 (USD Billion)
- Table 13.75 Plasma Fractionation Market for Asia-Pacific, till 2035 (USD Billion)
- Table 13.76 Plasma Fractionation Market for Rest of the World, till 2035 (USD Billion)
List of Figures
- Figure 2.1 Executive Summary: Current Market Landscape
- Figure 2.2 Executive Summary: Partnerships and Collaborations
- Figure 2.3 Executive Summary: Recent Expansions
- Figure 2.4 Executive Summary: Capacity Analysis
- Figure 2.5 Executive Summary: Market Sizing and Opportunity Analysis
- Figure 3.1 Components of Blood
- Figure 3.2 Components of Blood Plasma
- Figure 3.3 Process of Plasmapheresis
- Figure 3.4 Good Manufacturing Practices for Blood Screening
- Figure 3.5 Steps Involved in Plasma Fractionation
- Figure 3.6 Target Therapeutic Areas of Plasma-derived Therapies
- Figure 3.7 Advantages of Third-party Service Providers
- Figure 4.1 Plasma Fractionators: Distribution by Year of Establishment
- Figure 4.2 Plasma Fractionators: Distribution by Company Size
- Figure 4.3 Plasma Fractionators: Distribution by Location of Headquarters (Region)
- Figure 4.4 Plasma Fractionators: Distribution by Location of Headquarters (Country)
- Figure 4.5 Plasma Fractionators: Distribution by Year of Establishment and Location of Headquarters (Region)
- Figure 4.6 Plasma Fractionators: Distribution by Company Size and Location of Headquarters (Region)
- Figure 4.7 Plasma Fractionators: Distribution by Type of Company
- Figure 4.8 Plasma Fractionators: Distribution by Location of Plasma Fractionation Facilities (Region)
- Figure 4.9 Plasma Fractionators: Distribution by Location of Plasma Collection Facility
- Figure 4.10 Plasma Fractionators: Distribution by Availability of Patented / Proprietary Technology
- Figure 4.11 Plasma Fractionators: Distribution by Additional Fractionation Capabilities
- Figure 4.12 Plasma Fractionators: Distribution by Scale of Operation
- Figure 4.13 Plasma Fractionators: Distribution by Type of Plasma-derived Therapeutic Products Manufactured
- Figure 4.14 Plasma Fractionators: Distribution by Therapeutic Areas of Plasma-derived Products
- Figure 4.15 Plasma Fractionators: Distribution by End Users
- Figure 5.1 In-house Manufacturers: Players based in North America and Europe
- Figure 5.2 In-house Manufacturers: Players based in Asia-Pacific and Rest of the World
- Figure 5.3 In-house Manufacturers and Contract Service Providers: Players based in North America and Europe
- Figure 5.4 In-house Manufacturers and Contract Service Providers: Players based in Asia-Pacific and Rest of the World
- Figure 6.1 Baxter: Annual Revenues, FY 2018 Onwards (USD Billion)
- Figure 6.2 Grifols: Annual Revenues, FY 2018 Onwards (EUR Million)
- Figure 6.3 Kedrion: Annual Revenues, FY 2018 Onwards (EUR Million)
- Figure 6.4 Octapharma: Annual Revenues, FY 2018 Onwards (EUR Billion)
- Figure 6.5 CSL: Annual Revenues, FY 2018 Onwards (USD Million)
- Figure 6.5 Takeda Pharmaceutical: Annual Revenues, FY 2018 Onwards (JPY Billion)
- Figure 7.1 Partnerships and Collaborations: Cumulative Year-wise Distribution of Partnerships
- Figure 7.2 Partnerships and Collaborations: Distribution by Type of Partnership
- Figure 7.3 Partnerships and Collaborations: Distribution by Year and Type of Partnership
- Figure 7.4 Partnerships and Collaborations: Distribution by Purpose of Agreement
- Figure 7.5 Partnerships and Collaborations: Distribution by Type of Plasma-derived Therapeutic Products Manufactured
- Figure 7.6 Partnerships and Collaborations: Distribution by Type of Partner
- Figure 7.5 Partnerships and Collaborations: Distribution by Year of Partnership and Type of Partner
- Figure 7.6 Partnerships and Collaborations: Distribution by Type of Partnership and Type of Partner
- Figure 7.7 Most Active Players: Distribution by Number of Partnerships
- Figure 7.8 Partnerships and Collaborations: Distribution by Local and International Agreements
- Figure 7.9 Partnerships and Collaborations: Distribution by Intracontinental and Intercontinental Agreements
- Figure 8.1 Recent Expansions: Cumulative Year-wise Distribution of Expansions
- Figure 8.2 Recent Expansions: Distribution by Type of Expansion
- Figure 8.3 Recent Expansions: Distribution by Year and Type of Expansion
- Figure 8.4 Recent Expansions: Distribution by Type of Facility
- Figure 8.5 Recent Expansions: Distribution by Location of Expanded Facility
- Figure 8.6 Recent Expansions: Distribution by Year and Location of Expanded Facility
- Figure 8.7 Recent Expansions: Distribution by Plasma-derived Therapeutic Products Manufactured
- Figure 8.8 Most Active Players: Distribution by Number of Expansions
- Figure 9.1 Annual Plasma Fractionation Capacity: Distribution by Range of Installed Capacity
- Figure 9.2 Annual Plasma Fractionation Capacity: Distribution by Company Size
- Figure 9.3 Annual Plasma Fractionation Capacity: Distribution by Type of Plasma-derived Therapeutic Products Manufactured
- Figure 9.4 Annual Plasma Fractionation Capacity: Distribution by Scale of Operation
- Figure 9.5 Plasma Fractionation Capacity: Distribution by Location of Plasma Fractionation Facilities
- Figure 9.6 Plasma Fractionation Capacity: Distribution by Location of Headquarters (in Million Liters)
- Figure 10.1 Global Plasma Fractionation Market (Historical Trends and Forecasted Estimates), 2017-2035 (USD Billion)
- Figure 10.2 Plasma Fractionation Market: Distribution by Type of Company, 2017, 2023 and 2035 (USD Billion)
- Figure 10.3 Plasma Fractionation Market for In-house Manufacturers, till 2035 (USD Billion)
- Figure 10.4 Plasma Fractionation Market for Contract Service Providers, till 2035 (USD Billion)
- Figure 10.5. Plasma Fractionation Market: Distribution by Scale of Operation, 2017, 2023 and 2035 (USD Billion)
- Figure 10.6 Plasma Fractionation Market for Preclinical Operations, till 2035 (USD Billion)
- Figure 10.7 Plasma Fractionation Market for Clinical Operations, till 2035 (USD Billion)
- Figure 10.8 Plasma Fractionation Market for Commercial Operations, till 2035 (USD Billion)
- Figure 10.9 Plasma Fractionation Market: Distribution by Type of Plasma-derived Therapeutic Products Manufactured, 2017, 2023 and 2035 (USD Billion)
- Figure 10.10 Plasma Fractionation Market for Albumins, till 2035 (USD Billion)
- Figure 10.11 Plasma Fractionation Market for Coagulation Factors, till 2035 (USD Billion)
- Figure 10.12 Plasma Fractionation Market for Immunoglobulins, till 2035 (USD Billion)
- Figure 10.13 Plasma Fractionation Market for Protease Inhibitors, till 2035 (USD Billion)
- Figure 10.14 Plasma Fractionation Market for Other Plasma-derived Products, till 2035 (USD Billion)
- Figure 10.15 Plasma Fractionation Market: Distribution by Therapeutic Areas of Plasma-derived Products, 2017, 2023 and 2035 (USD Billion)
- Figure 10.16 Plasma Fractionation Market for Hematological Disorders, till 2035 (USD Billion)
- Figure 10.17 Plasma Fractionation Market for Hepatic Disorders, till 2035 (USD Billion)
- Figure 10.18 Plasma Fractionation Market for Immunological Disorders, till 2035 (USD Billion)
- Figure 10.19 Plasma Fractionation Market for Neurological Disorders, till 2035 (USD Billion)
- Figure 10.20 Plasma Fractionation Market for Other Disorders, till 2035 (USD Billion)
- Figure 10.21 Plasma Fractionation Market: Distribution by Demand across Key Geographical Regions, 2017, 2023 and 2035 (USD Billion)
- Figure 10.22 Plasma Fractionation Market for North America, till 2035 (USD Billion)
- Figure 10.23 Plasma Fractionation Market for Europe, till 2035 (USD Billion)
- Figure 10.24 Plasma Fractionation Market for Asia-Pacific, till 2035 (USD Billion)
- Figure 10.25 Plasma Fractionation Market for Rest of the World, till 2035 (USD Billion)
- Figure 10.26 Plasma Fractionation Market: Distribution by Supply across Key Geographical Regions, 2017, 2023 and 2035 (USD Billion)
- Figure 10.27 Plasma Fractionation Market for North America, till 2035 (USD Billion)
- Figure 10.28 Plasma Fractionation Market for Europe, till 2035 (USD Billion)
- Figure 10.29 Plasma Fractionation Market for Asia-Pacific, till 2035 (USD Billion)
- Figure 10.30 Plasma Fractionation Market for Rest of the World, till 2035 (USD Billion)
- Figure 11.1 Concluding Remarks: Current Market Landscape of Plasma Fractionators
- Figure 11.2 Concluding Remarks: Partnerships and Collaborations
- Figure 11.3 Concluding Remarks: Recent Expansions
- Figure 11.4 Concluding Remarks: Capacity Analysis
- Figure 11.5 Concluding Remarks: Market Sizing and Opportunity Analysis (I/II)
- Figure 11.6 Concluding Remarks: Market Sizing and Opportunity Analysis (II/II)
 全球血浆分离市场规模、份额、趋势和成长分析报告(2026-2034年)
 日本血浆分离市场报告(按产品、产业、应用、最终用户和地区划分,2026-2034年)全球血浆分离市场:市场规模、占有率、成长率、产业分析、按类型、应用和地区划分的考量因素以及未来预测(2026-2034)
 血浆分馏市场机会、成长动力、产业趋势分析及 2025 - 2034 年预测
 血浆分馏市场-全球产业规模、份额、趋势、机会和预测(按产品、应用、地区和竞争细分,2020-2030 年)
 血浆分馏市场规模、份额、成长分析(按产品、应用、最终用户、地区)- 2025 年至 2032 年产业预测
 血浆分馏市场规模、份额、趋势分析报告:按产品、方法、应用、最终用途、地区和细分市场预测,2025-2030 年
 血浆分馏市场,按产品类型、技术、应用、国家和地区 - 2024-2032 年行业分析、市场规模、市场份额和预测