


 |
市场调查报告书
商品编码
1682713
微脂体开发与微脂体製造服务市场:各产品类型,各产业规模,各终端用户,各主要地区:2035年前的产业趋势与全球预测Liposome Development and Liposome Manufacturing Services Market by Type of Product Formulation, Type of Scale of Operation, Type of End User, and Key Geographical Regions : Industry Trends and Global Forecasts, Till 2035 |
||||||
到 2035 年,全球脂质体开发和脂质体製造服务市场规模预计将成长至 23.4 亿美元,复合年增长率为 9.7%。
药物溶解度差及其对生物利用度的影响仍然是几种候选药物的主要问题。最近的趋势表明,大约 40% 的上市药物製剂和近 90% 的正在开发的候选药物存在溶解度和/或渗透性问题,导致生物利用度降低。值得注意的是,每年都有许多药物因生物利用度差或水溶性问题而无法进入市场。因此,该行业正在积极探索各种工具和方法来缓解这项挑战。在用于提高治疗介入的生物利用度的各种方法中,脂质体和其他脂质赋形剂因其能够充当复杂但极具前景的治疗剂的药物载体而引起了药物开发商的注意。
脂质体製造是一个高度复杂且资本密集的过程,面临多重挑战,包括高度技术性的过程(需要专业和专业知识)、基础设施限制、生产能力限制以及实现临床级生产的挑战。鑑于製造此类配方所涉及的技术复杂性,开发商越来越多地转向服务提供者。随着基于脂质体的治疗方法的不断增加,脂质体开发和製造服务市场预计将在不久的将来实现稳定成长。
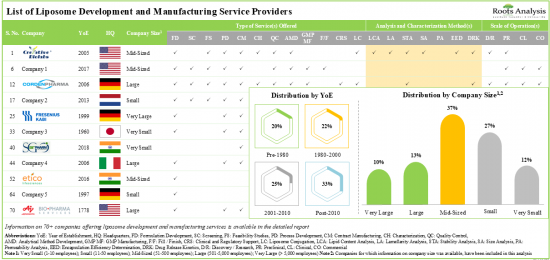
目前,有超过 70 家公司声称提供不同规模的脂质体开发和製造服务。
利害关係人利用他们的专业知识为高活性脂质体提供各种服务。约60%的服务提供者俱备脂质体稳定性分析能力。各利害关係人已提交近700项与脂质体相关的专利,以保护该领域产生的智慧财产权。
本报告提供全球微脂体开发与微脂体製造服务市场相关调查,提供市场概要,以及各产品类型,各产业规模,各终端用户,各主要地区的趋势,及加入此市场的主要企业简介等资讯。
目录
第1章 序文
第2章 摘要整理
第3章 简介
第4章 市场形势:微脂体开发·製造服务供应商
第5章 企业简介
第6章 临床试验的分析
第7章 出版物的分析
第8章 专利分析
第9章 世界活动分析
第10章 外包:GO/NO-GO组成架构
第11章 市场预测与机会分析
第12章 结论
第13章 执行洞察
第14章 附录1:表格形式资料
第15章 附录2:企业·团体一览
LIPOSOME DEVELOPMENT AND LIPOSOME MANUFACTURING SERVICES MARKET: OVERVIEW
As per Roots Analysis, the global liposome development and liposome manufacturing services market is estimated to grow to USD 2.34 billion by 2035, at a CAGR of 9.7% during the forecast period, till 2035.
The market sizing and opportunity analysis has been segmented across the following parameters:
Type Of Product Formulation
- Therapeutic
- Nutraceutical
Type of Scale of Operation
- Discovery / Research
- Preclinical
- Clinical and Commercial
Type of End User
- Pharmaceutical and Biotechnology,
- Cosmetics
- Food
- Agricultural
- Academic
- Other Industries
Geography
- North America
- Europe
- Asia-Pacific
- Latin America
- Middle East and North Africa
LIPOSOME DEVELOPMENT AND LIPOSOME MANUFACTURING SERVICES MARKET: GROWTH AND TRENDS
Low drug solubility and its corresponding impact on bioavailability have remained a primary cause of concern for several drug candidates. According to a recent study, approximately 40% of marketed pharmacological products and close to 90% of drug candidates under development, have been associated with solubility and / or permeability issues, resulting in poor bioavailability. It is worth noting that, every year, a large number of drugs fail to reach the market due to poor bioavailability and issues associated with aqueous solubility. As a result, the industry is actively seeking various tools / methods to mitigate this challenge. Amongst the different approaches employed to enhance the bioavailability of therapeutic interventions, liposomes and other lipidic excipients have garnered the attention of drug developers, owing to their ability to act as drug carriers for complex, albeit highly promising therapeutics.
Manufacturing of liposomes is a highly complex and capital-intensive process fraught with a range of challenges, including highly technical processes (which demand niche and specialized expertise), infrastructure limitations, capacity constraints, and challenges in achieving clinical-grade production. Given the technical complexities associated with the manufacturing of such formulations, developers are increasingly relying on service providers. With increase in the number of liposome based therapeutics, the liposome development and manufacturing services market is anticipated to witness a steady growth in the near future.
LIPOSOME DEVELOPMENT AND LIPOSOME MANUFACTURING SERVICES MARKET: KEY INSIGHTS
The report delves into the current state of the liposome development and liposome manufacturing services market and identifies potential growth opportunities within the industry. Some key findings from the report include:
1. Presently, over 70 players claim to offer a wide range of liposome development and manufacturing services across different scales of operation.
2. Leveraging their expertise, stakeholders offer a variety of services for a myriad of highly potent liposomes; around 60% of the service providers possess the capability for stability analysis of liposomes.
3. Close to 700 patents related to liposomes have been filed by various stakeholders in order to protect the intellectual property generated within this field.
4. The growing interest is also reflected by the events being organized globally; such platforms provide an opportunity to industry stakeholders / researchers to share ideas and develop a better understanding of liposomes.
5. 800+ clinical trials related to liposomes have been registered till date; the majority (38%) of these trials were / are being conducted across various clinical sites based in Europe.
6. Since 2017, more than 6,000+ articles focused on liposomes have been published in high-impact journals, highlighting the substantial efforts undertaken by researchers.
LIPOSOME DEVELOPMENT AND LIPOSOME MANUFACTURING SERVICES MARKET: KEY SEGMENTS
Therapeutic Formulations Occupy the Largest Share of the Liposome Development and Liposome Manufacturing Services Market
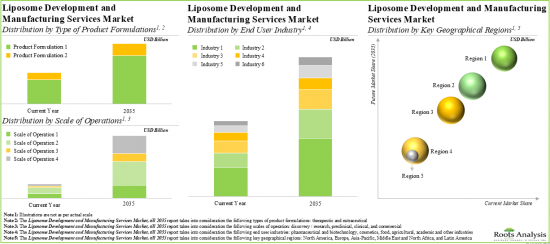
Based on the type of product formulation, the market is segmented into therapeutic and nutraceutical. Currently, the therapeutic formulation holds the maximum share of the liposome development and liposome manufacturing services market. It is worth highlighting that the liposome development and liposome manufacturing services market for nutraceuticals is likely to grow at a relatively higher CAGR.
Clinical Scale is Likely to Dominate the Liposome Development and Liposome Manufacturing Services Market
Based on the scale of operation, the market is segmented into discovery / research, preclinical, clinical and commercial. At present, the clinical scale captures the highest share of the liposome development and liposome manufacturing services market. It is worth highlighting that the discovery / research scale is to drive the market in the future with a relatively higher CAGR.
Pharmaceutical and Biotechnology Industry Occupies the Largest Share of the Liposome Development and Liposome Manufacturing Services Market
Based on the type of end-user, the market is segmented into pharmaceutical and biotechnology, cosmetics, food, agricultural, academic, and other industries. Currently, the pharmaceutical and biotechnology industry holds the maximum share of the liposome development and liposome manufacturing services market. This trend is unlikely to change in the foreseeable future.
North America Accounts for the Largest Share of the Market
Based on key geographical regions, the market is segmented into North America, Europe, Asia-Pacific, Middle East and North Africa, and Latin America. The majority share is expected to be captured by players based in North America. It is worth highlighting that, over the years, the market in Latin America is expected to grow at a higher CAGR.
Example Players in the Liposome Development and Liposome Manufacturing Services Market
- Baxter BioPharma Solutions
- Charles River Laboratories
- Evonik
- Fresenius Kabi
- GEA
- Intertek
- Fujifilm
LIPOSOME DEVELOPMENT AND LIPOSOME MANUFACTURING SERVICES MARKET: RESEARCH COVERAGE
- Market Sizing and Opportunity Analysis: The report features an in-depth analysis of the liposome development and manufacturing services market, focusing on key market segments, including [A] type of product formulation, [B] type of scale of operation, [C] type of end user, and [D] key geographical regions.
- Market Landscape: A comprehensive evaluation of liposome development and manufacturing service providers involved in the liposome development and manufacturing services market, considering various parameters, such as [A] year of establishment, [B] company size (in terms of number of employees), [C] region of headquarters, [D] types of method(s) for liposome preparation, [E] type of service(s) offered, [F] liposome bioconjugation target(s), [G] scalability, [H] liposome analysis and characterization method(s), [I] application(s) of liposomes, [J] scale of operation and [K] end user (s).
- Company Profiles: In-depth profiles of key industry players offering liposome development and manufacturing services across various geographies, focusing on [A] company overviews, [B] financial information (if available), [C] service portfolio, [D] recent developments and [E] an informed future outlook.
- Clinical Trial Analysis: Examination of completed, ongoing, and planned clinical studies of liposomes based on parameters like [A] trial registration year, [B] trial status, [C] trial registration year and patients enrolled, [D] trial phase, [E] type of sponsor / collaborator, [F] study design, [G] leading players (in terms of number of trials conducted), [H] disease indication(s), [I] popular therapeutic areas, [J] type of treatment, [K] emerging focus areas and [L] regional distribution of trials (in terms of number of trials conducted and trial status).
- Publication Analysis: A detailed review of scientific articles related to research on liposomes, based on several relevant parameters, such as [A] year of publication, [B] application area(s), [C] emerging focus areas and [D] the top journals (in terms of number of publications and impact factor).
- Patent Analysis: Detailed analysis of various patents filed / granted for liposomes based on [A] type of patent, [B] patent publication year, [C] granted patents and patent applications, [D] geography, [E] CPC symbols, [F] emerging focus areas, [G] type of organization, [H] leading players (in terms of number of patents granted / filed) and [I] patent characteristics. It also includes a patent benchmarking analysis and a detailed valuation analysis.
- Global Event Analysis: An analysis of recent events, covering webinars, conferences, seminars, workshops, symposiums and summits that were organized for stakeholders in this market, based on several relevant parameters, such as [A] year of event, [B] event platform, [C] type of event, [D] geography, [E] evolutionary trends in event agenda, [F] most active event organizers, [G] active industry and non-industry players (in terms of number of events that each company participated in), [H] seniority level of event speakers, [I] affiliated department of event speakers, [J] most active speakers (in terms of number of events) and [K] a geographical mapping of upcoming events.
- Outsourcing: Go / No-Go Framework: An insightful framework that emphasizes the key indicators and factors that needs to be considered by liposome developers to determine whether to manufacture their respective products in-house or outsource the manufacturing operation to contract service providers.
KEY QUESTIONS ANSWERED IN THIS REPORT
- How many companies are currently engaged in this market?
- Which are the leading companies in this market?
- What factors are likely to influence the evolution of this market?
- What is the current and future market size?
- What is the CAGR of this market?
- How is the current and future market opportunity likely to be distributed across key market segments?
REASONS TO BUY THIS REPORT
- The report provides a comprehensive market analysis, offering detailed revenue projections of the overall market and its specific sub-segments. This information is valuable to both established market leaders and emerging entrants.
- Stakeholders can leverage the report to gain a deeper understanding of the competitive dynamics within the market. By analyzing the competitive landscape, businesses can make informed decisions to optimize their market positioning and develop effective go-to-market strategies.
- The report offers stakeholders a comprehensive overview of the market, including key drivers, barriers, opportunities, and challenges. This information empowers stakeholders to stay abreast of market trends and make data-driven decisions to capitalize on growth prospects.
ADDITIONAL BENEFITS
- Complimentary PPT Insights Packs
- Complimentary Excel Data Packs for all Analytical Modules in the Report
- 10% Free Content Customization
- Detailed Report Walkthrough Session with Research Team
- Free Updated report if the report is 6-12 months old or older
TABLE OF CONTENTS
1. PREFACE
- 1.1. Scope of the Report
- 1.2. Market Segmentation
- 1.3. Research Methodology
- 1.4. Key Questions Answered
- 1.5. Chapter Outlines
2. EXECUTIVE SUMMARY
3. INTRODUCTION
- 3.1. Chapter Overview
- 3.2. Introduction to Liposomes
- 3.3. Formation of Liposomes
- 3.4. Classification of Liposomes
- 3.5. Liposome as a Drug Delivery System
- 3.5.1. Liposomal Drug Delivery Platforms
- 3.5.2. Therapeutic Applications of Liposomes in Drug Delivery
- 3.6. Methods for Liposome Preparation
- 3.7. Post-Preparation Treatments
- 3.7.1. Freeze-Thawing
- 3.7.2. Freeze-Drying
- 3.8. Liposome Analysis and Characterization Methods
- 3.9. Pharmaceutical and Industrial Applications of Liposomes
- 3.9.1. Drug Delivery
- 3.9.2. Gene Delivery
- 3.9.3. Vaccine Delivery
- 3.9.4. Cancer Therapy
- 3.9.5. Agricultural Industry
- 3.9.6. Cosmetics
- 3.9.7. Food Industry
- 3.10. Challenges in Liposome Development and Manufacturing
- 3.11. Need for Outsourcing of Liposome Development and Manufacturing
- 3.12. Future Perspectives
4. MARKET LANDSCAPE: LIPOSOME DEVELOPMENT AND MANUFACTURING SERVICE PROVIDERS
- 4.1. Chapter Overview
- 4.2. Liposome Development and Manufacturing Service Providers Landscape
- 4.2.1. Analysis by Year of Establishment
- 4.2.2. Analysis by Company Size
- 4.2.3. Analysis by Region of Headquarters
- 4.2.4. Analysis by Company Size and Region of Headquarters
- 4.2.5. Analysis by Type of Method(s) Used for Liposome Preparation
- 4.2.6. Analysis by Type of Service(s) Offered
- 4.2.7. Analysis by Liposome Bioconjugation Target(s)
- 4.2.8. Analysis by Scalability
- 4.2.9. Analysis by Liposome Analysis and Characterization Method(s)
- 4.2.10. Analysis by Application(s) of Liposomes
- 4.2.11. Analysis by Type of Service(s) Offered, Application(s) and Product Formulation
- 4.2.12. Analysis by Scale of Operation
- 4.2.13. Analysis by End User(s)
- 4.2.14. Analysis by Scale of Operation and End User(s)
5. COMPANY PROFILES
- 5.1. Chapter Overview
- 5.2. Key Players Based in North America
- 5.2.1. Baxter BioPharma Solutions
- 5.2.1.1. Company Overview
- 5.2.1.2. Financial Information
- 5.2.1.3. Service Portfolio
- 5.2.1.4. Recent Developments and Future Outlook
- 5.2.2. Charles River Laboratories
- 5.2.2.1. Company Overview
- 5.2.2.2. Financial Information
- 5.2.2.3. Service Portfolio
- 5.2.2.4. Recent Developments and Future Outlook
- 5.2.1. Baxter BioPharma Solutions
- 5.3. Key Players Based in Europe
- 5.3.1. Evonik
- 5.3.1.1. Company Overview
- 5.3.1.2. Financial Information
- 5.3.1.3. Service Portfolio
- 5.3.1.4. Recent Developments and Future Outlook
- 5.3.2. Fresenius Kabi
- 5.3.2.1. Company Overview
- 5.3.2.2. Financial Information
- 5.3.2.3. Service Portfolio
- 5.3.2.4. Recent Developments and Future Outlook
- 5.3.3. GEA
- 5.3.3.1. Company Overview
- 5.3.3.2. Financial Information
- 5.3.3.3. Service Portfolio
- 5.3.3.4. Recent Developments and Future Outlook
- 5.3.4. Intertek
- 5.3.4.1. Company Overview
- 5.3.4.2. Financial Information
- 5.3.4.3. Service Portfolio
- 5.3.4.4. Recent Developments and Future Outlook
- 5.3.1. Evonik
- 5.4. Key Players Based in Asia-Pacific
- 5.4.1. Fujifilm
- 5.4.1.1. Company Overview
- 5.4.1.2. Financial Information
- 5.4.1.3. Service Portfolio
- 5.4.1.4. Recent Developments and Future Outlook
- 5.4.1. Fujifilm
6. CLINICAL TRIAL ANALYSIS
- 6.1. Chapter Overview
- 6.2. Scope and Methodology
- 6.3. Liposomes: Clinical Trial Analysis
- 6.3.1. Analysis by Trial Registration Year
- 6.3.2. Analysis by Trial Status
- 6.3.3. Analysis by Trial Registration Year and Trial Status
- 6.3.4. Analysis by Trial Registration Year and Patients Enrolled
- 6.3.5. Analysis by Trial Phase
- 6.3.6. Analysis by Trial Phase and Patients Enrolled
- 6.3.7. Analysis by Type of Sponsor / Collaborator
- 6.3.8. Analysis by Study Design
- 6.3.9. Most Active Industry Players: Analysis by Number of Trials
- 6.3.10. Most Active Non-Industry Players: Analysis by Number of Trials
- 6.3.11. Most Popular Disease Indication(s): Analysis by Number of Trials
- 6.3.12. Most Popular Therapeutic Area(s): Analysis by Number of Trials
- 6.3.13. Analysis by Type of Treatment
- 6.3.14. Word Cloud Analysis: Emerging Focus Areas
- 6.3.15. Analysis by Top Indication(s) and Trial Phase
- 6.3.16. Analysis by Top Indication(s) and Leading Industry Players
- 6.3.17. Geographical Analysis by Number of Clinical Trials
- 6.3.18. Geographical Analysis by Number of Patients Enrolled
7. PUBLICATION ANALYSIS
- 7.1. Chapter Overview
- 7.2. Scope and Methodology
- 7.3. Liposomes: Recent Publications
- 7.3.1. Analysis by Year of Publication
- 7.3.2. Analysis by Application Area(s)
- 7.3.3. Word Cloud Analysis: Emerging Focus Areas
- 7.3.4. Key Journals: Analysis by Number of Publications
- 7.3.5. Key Journals: Analysis by Impact Factor
- 7.3.6. Key Journals: Analysis by Year-wise Number of Publications
8. PATENT ANALYSIS
- 8.1. Chapter Overview
- 8.2. Scope and Methodology
- 8.3. Liposomes: Patent Analysis
- 8.3.1. Analysis by Patent Publication Year
- 8.3.2. Analysis by Granted Patents and Patent Applications
- 8.3.3. Analysis by Geography
- 8.3.4. Analysis by CPC Symbols
- 8.3.5. Word Cloud Analysis: Emerging Focus Areas
- 8.3.6. Analysis by Type of Organization
- 8.3.7. Leading Industry Players: Analysis by Number of Patents
- 8.3.8. Leading Non-Industry Players: Analysis by Number of Patents
- 8.3.9. Leading Individual Assignees: Analysis by Number of Patents
- 8.4. Liposomes: Patent Benchmarking Analysis
- 8.4.1. Analysis by Patent Characteristics
- 8.5. Liposomes: Patent Valuation Analysis
- 8.6. Leading Patents: Analysis by Number of Citations
9. GLOBAL EVENT ANALYSIS
- 9.1. Chapter Overview
- 9.2. Scope and Methodology
- 9.3. Liposome Development and Manufacturing: Global Events Analysis
- 9.3.1. Analysis by Year of Event
- 9.3.2. Analysis by Event Platform
- 9.3.3. Analysis by Type of Event
- 9.3.4. Analysis by Year of Event and Type of Event
- 9.3.5. Analysis by Geography
- 9.3.6. Word Cloud Analysis: Evolutionary Trends in Event Agenda / Key Focus Area
- 9.3.7. Most Active Event Organizers
- 9.4. Liposome Development and Manufacturing: Speaker Analysis
- 9.4.1. Most Active Industry Players: Analysis by Number of Events
- 9.4.2. Most Active Non-Industry Players: Analysis by Number of Events
- 9.4.3. Analysis by Seniority Level of Event Speakers
- 9.4.4. Analysis by Affiliated Department of Event Speakers
- 9.4.5. Most Active Speakers: Analysis by Number of Events
- 9.5. Geographical Mapping of Upcoming Events
- 9.6. Concluding Remarks
10. OUTSOURCING: GO / NO-GO FRAMEWORK
- 10.1. Chapter Overview
- 10.2. Outsourcing: Go / No-Go Framework
- 10.3. Liposome-based Therapeutic Developers Outsourcing: Go / No-Go Framework
- 10.3.1. Key Parameters and Assumptions
- 10.3.2. Methodology
- 10.3.3. Results and Interpretations
- 10.3.3.1. Very Small Companies
- 10.3.3.2. Small Companies
- 10.3.3.3. Mid-Sized Companies
- 10.3.3.4. Large Companies
- 10.3.3.5. Very Large Companies
11. MARKET FORECAST AND OPPORTUNITY ANALYSIS
- 11.1. Chapter Overview
- 11.2. Key Assumptions and Methodology
- 11.3. Global Liposome Development and Manufacturing Services Market, till 2035
- 11.3.1. Liposome Development and Manufacturing Services Market: Distribution by Type of Product Formulation, Current Year and 2035
- 11.3.1.1. Liposome Development and Manufacturing Services Market for Therapeutics, till 2035
- 11.3.1.2. Liposome Development and Manufacturing Services Market for Nutraceuticals, till 2035
- 11.3.2. Liposome Development and Manufacturing Services Market: Distribution by Scale of Operation, Current Year and 2035
- 11.3.2.1. Liposome Development and Manufacturing Services Market for Discovery / Research Scale of Operation, till 2035
- 11.3.2.2. Liposome Development and Manufacturing Services Market for Preclinical Scale of Operation, till 2035
- 11.3.2.3. Liposome Development and Manufacturing Services Market for Clinical Scale of Operation, till 2035
- 11.3.2.4. Liposome Development and Manufacturing Services Market for Commercial Scale of Operation, till 2035
- 11.3.3. Liposome Development and Manufacturing Services Market: Distribution by End User, Current Year and 2035
- 11.3.3.1. Liposome Development and Manufacturing Services Market for Pharmaceutical and Biotechnology Industry, till 2035
- 11.3.3.2. Liposome Development and Manufacturing Services Market for Food Industry, till 2035
- 11.3.3.3. Liposome Development and Manufacturing Services Market for Agricultural Industry, till 2035
- 11.3.3.4. Liposome Development and Manufacturing Services Market for Cosmetic Industry, till 2035
- 11.3.3.5. Liposome Development and Manufacturing Services Market for Academics, till 2035
- 11.3.3.6. Liposome Development and Manufacturing Services Market for Other Industries, till 2035
- 11.3.4. Liposome Development and Manufacturing Services Market: Distribution by Key Geographical Regions, Current Year and 2035
- 11.3.4.1. Liposome Development and Manufacturing Services Market in North America, till 2035
- 11.3.4.2. Liposome Development and Manufacturing Services Market in Europe, till 2035
- 11.3.4.3. Liposome Development and Manufacturing Services Market in Asia-Pacific, till 2035
- 11.3.4.4. Liposome Development and Manufacturing Services Market in Middle East and North Africa, till 2035
- 11.3.4.5. Liposome Development and Manufacturing Services Market in Latin America, till 2035
- 11.3.1. Liposome Development and Manufacturing Services Market: Distribution by Type of Product Formulation, Current Year and 2035
12. CONCLUDING REMARKS
13. EXECUTIVE INSIGHTS
14. APPENDIX 1: TABULATED DATA
15. APPENDIX 2: LIST OF COMPANIES AND ORGANIZATIONS
List of Tables
- Table 3.1 Classification of Liposomes
- Table 4.1 List of Liposome Development and Manufacturing Service Providers
- Table 4.2 Liposome Development and Manufacturing Service Providers: Information on Type of Method(s) Used for Liposome Preparation
- Table 4.3 Liposome Development and Manufacturing Service Providers: Information on Type of Service(s) Offered
- Table 4.4 Liposome Development and Manufacturing Service Providers: Information on Liposome Bioconjugation Target(s)
- Table 4.5 Liposome Development and Manufacturing Service Providers: Information on Scalability, and Liposome Analysis and Characterization Method(s)
- Table 4.6 Liposome Development and Manufacturing Service Providers: Information on Application(s) and Scale of Operation
- Table 4.7 Liposome Development and Manufacturing Service Providers: Information on End User(s)
- Table 5.1 Liposome Service Providers: List of Companies Profiled
- Table 5.2 Baxter BioPharma Solutions: Company Snapshot
- Table 5.3 Baxter BioPharma Solutions: Service Portfolio
- Table 5.4 Baxter BioPharma Solutions: Recent Developments and Future Outlook
- Table 5.5 Charles River Laboratories: Company Snapshot
- Table 5.6 Charles River Laboratories: Service Portfolio
- Table 5.7 Charles River Laboratories: Recent Developments and Future Outlook
- Table 5.8 Evonik: Company Snapshot
- Table 5.9 Evonik: Service Portfolio
- Table 5.10 Evonik: Recent Developments and Future Outlook
- Table 5.11 Fresenius Kabi: Company Snapshot
- Table 5.12 Fresenius Kabi: Service Portfolio
- Table 5.13 GEA: Company Snapshot
- Table 5.14 GEA: Service Portfolio
- Table 5.15 Intertek: Company Snapshot
- Table 5.16 Intertek: Service Portfolio
- Table 5.17 Intertek: Recent Developments and Future Outlook
- Table 5.18 Fujifilm: Company Snapshot
- Table 5.19 Fujifilm: Service Portfolio
- Table 5.20 Fujifilm: Recent Developments and Future Outlook
- Table 8.1 Patent Analysis: Top CPC Sections
- Table 8.2 Patent Analysis: Top Five CPC Symbols
- Table 8.3 Patent Analysis: Top Six CPC Codes
- Table 8.4 Patent Analysis: Summary of Benchmarking Analysis
- Table 8.5 Patent Analysis: Categorization based on Weighted Valuation Scores
- Table 8.6 Patent Portfolio: List of Leading Patents (by Highest Relative Valuation)
- Table 8.7 Patent Portfolio: List of Leading Patents (by Number of Citations)
- Table 9.1 List of Global Events related to Liposome Development and Manufacturing
- Table 13.1 Midwestern University: Organization Snapshot
- Table 14.1 Liposome Development and Manufacturing Service Providers: Distribution by Year of Establishment
- Table 14.2 Liposome Development and Manufacturing Service Providers: Distribution by Company Size
- Table 14.3 Liposome Development and Manufacturing Service Providers: Distribution by Region of Headquarters
- Table 14.4 Liposome Development and Manufacturing Service Providers: Distribution by Location of Headquarters
- Table 14.5 Liposome Development and Manufacturing Service Providers: Distribution by Company Size and Region of Headquarters
- Table 14.6 Liposome Development and Manufacturing Service Providers: Distribution by Type of Method(s) Used for Liposome Preparation
- Table 14.7 Liposome Development and Manufacturing Service Providers: Distribution by Type of Service(s) Offered
- Table 14.8 Liposome Development and Manufacturing Service Providers: Distribution by Liposome Bioconjugation Target(s)
- Table 14.9 Liposome Development and Manufacturing Service Providers: Distribution by Scalability
- Table 14.10 Liposome Development and Manufacturing Service Providers: Distribution by Liposome Analysis and Characterization Method(s)
- Table 14.11 Liposome Development and Manufacturing Service Providers: Distribution by Application(s) of Liposomes
- Table 14.12 Liposome Development and Manufacturing Service Providers: Distribution by Scale of Operation
- Table 14.13 Liposome Development and Manufacturing Service Providers: Distribution by End User(s)
- Table 14.14 Liposome Development and Manufacturing Service Providers: Distribution by Scale of Operation and End User(s)
- Table 14.15 Baxter BioPharma Solutions: Annual Revenues, FY 2017 Onwards (USD Billion)
- Table 14.16 Charles River Laboratories: Annual Revenues, FY 2017 Onwards (USD Billion)
- Table 14.17 Evonik: Annual Revenues, FY 2017 Onwards (EUR Billion)
- Table 14.18 Fresenius Kabi: Annual Revenues, FY 2017 Onwards (EUR Billion)
- Table 14.19 GEA: Annual Revenues, FY 2017 Onwards (EUR Billion)
- Table 14.20 Intertek: Annual Revenues, FY 2017 Onwards (EUR Billion)
- Table 14.21 Fujifilm: Annual Revenues, FY 2017 Onwards (JPY Trillion)
- Table 14.22 Clinical Trial Analysis: Cumulative Distribution by Trial Registration Year
- Table 14.23 Clinical Trial Analysis: Distribution by Trial Status
- Table 14.24 Clinical Trial Analysis: Distribution by Trial Registration Year and Trial Status
- Table 14.25 Clinical Trial Analysis: Distribution by Trial Registration Year and Patients Enrolled
- Table 14.26 Clinical Trial Analysis: Distribution by Trial Phase
- Table 14.27 Clinical Trial Analysis: Distribution by Trial Phase and Patients Enrolled
- Table 14.28 Clinical Trial Analysis: Distribution by Type of Sponsor / Collaborator
- Table 14.29 Clinical Trial Analysis: Distribution by Study Design
- Table 14.30 Most Active Industry Players: Distribution by Number of Trials
- Table 14.31 Most Active Non-Industry Players: Distribution by Number of Trials
- Table 14.32 Most Popular Disease Indication(s): Distribution by Number of Trials
- Table 14.33 Most Popular Therapeutic Area(s): Distribution by Number of Trials
- Table 14.34 Clinical Trial Analysis: Distribution by Type of Treatment
- Table 14.35 Clinical Trial Analysis: Distribution by Top Indication(s) and Trial Phase
- Table 14.36 Clinical Trial Analysis: Geographical Distribution by Number of Clinical Trials
- Table 14.37 Clinical Trial Analysis: Geographical Distribution by Number of Patients Enrolled
- Table 14.38 Publication Analysis: Cumulative Year-wise Trend, since 2017
- Table 14.39 Publication Analysis: Distribution by Application Area(s)
- Table 14.40 Key Journals: Distribution by Number of Publications
- Table 14.41 Key Journals: Distribution by Impact Factor
- Table 14.42 Key Journals: Year-wise Distribution by Number of Publications
- Table 14.43 Patent Analysis: Distribution by Type of Patent
- Table 14.44 Patent Analysis: Cumulative Distribution by Patent Publication Year, since 2017
- Table 14.45 Patent Analysis: Year-wise Distribution by Granted Patents and Patent Applications, since 2017
- Table 14.46 Patent Analysis: Distribution by Geography
- Table 14.47 Patent Analysis: Cumulative Year-wise Distribution by Type of Organization, since 2017
- Table 14.48 Leading Industry Players: Distribution by Number of Patents
- Table 14.49 Leading Non-Industry Players: Distribution by Number of Patents
- Table 14.50 Leading Individual Assignees: Distribution by Number of Patents
- Table 14.51 Patent Analysis: Distribution by Patents Age
- Table 14.52 Liposomes: Patent Valuation Analysis
- Table 14.53 Global Event Analysis: Cumulative Year-wise Trend, since 2017
- Table 14.54 Global Event Analysis: Distribution by Event Platform
- Table 14.55 Global Event Analysis: Distribution by Type of Event
- Table 14.56 Global Event Analysis: Distribution by Year of Event and Type of Event
- Table 14.57 Global Event Analysis: Distribution by Location of Events
- Table 14.58 Most Active Organizers: Distribution by Number of Events
- Table 14.59 Most Active Industry Players: Distribution by Number of Events
- Table 14.60 Most Active Non-Industry Players: Distribution by Number of Events
- Table 14.61 Seniority Level of Event Speakers: Distribution by Number of Events
- Table 14.62 Affiliated Department of Event Speakers: Distribution by Number of Events
- Table 14.63 Most Active Speakers: Distribution by Number of Events
- Table 14.64 Global Liposome Development and Manufacturing Services Market, till 2035: Conservative, Base and Optimistic Scenarios (USD Billion)
- Table 14.65 Liposome Development and Manufacturing Services Market: Distribution by Type of Product Formulation, Current Year and 2035
- Table 14.66 Liposome Development and Manufacturing Services Market for Therapeutics, till 2035: Conservative, Base and Optimistic Scenarios (USD Billion)
- Table 14.67 Liposome Development and Manufacturing Services Market for Nutraceuticals, till 2035: Conservative, Base and Optimistic Scenarios (USD Billion)
- Table 14.68 Liposome Development and Manufacturing Services Market: Distribution by Scale of Operation, Current Year and 2035
- Table 14.69 Liposome Development and Manufacturing Services Market for Discovery / Research Scale of Operation, till 2035: Conservative, Base and Optimistic Scenarios (USD Billion)
- Table 14.70 Liposome Development and Manufacturing Services Market for Preclinical Scale of Operation, till 2035: Conservative, Base and Optimistic Scenarios (USD Billion)
- Table 14.71 Liposome Development and Manufacturing Services Market for Clinical Scale of Operation, till 2035: Conservative, Base and Optimistic Scenarios (USD Billion)
- Table 14.72 Liposome Development and Manufacturing Services Market for Commercial Scale of Operation, till 2035: Conservative, Base and Optimistic Scenarios (USD Billion)
- Table 14.73 Liposome Development and Manufacturing Services Market: Distribution by End User, Current Year and 2035
- Table 14.74 Liposome Development and Manufacturing Services Market for Pharmaceutical and Biotechnology Industry, till 2035: Conservative, Base and Optimistic Scenarios (USD Billion)
- Table 14.75 Liposome Development and Manufacturing Services Market for Food Industry, till 2035: Conservative, Base and Optimistic Scenarios (USD Billion)
- Table 14.76 Liposome Development and Manufacturing Services Market for Agricultural Industry, till 2035: Conservative, Base and Optimistic Scenarios (USD Billion)
- Table 14.77 Liposome Development and Manufacturing Services Market for Cosmetic Industry, till 2035: Conservative, Base and Optimistic Scenarios (USD Billion)
- Table 14.78 Liposome Development and Manufacturing Services Market for Academics, till 2035: Conservative, Base and Optimistic Scenarios (USD Billion)
- Table 14.79 Liposome Development and Manufacturing Services Market for Other Industries, till 2035: Conservative, Base and Optimistic Scenarios (USD Billion)
- Table 14.80 Liposome Development and Manufacturing Services Market: Distribution by Key Geographical Regions, Current Year and 2035
- Table 14.81 Liposome Development and Manufacturing Services Market in North America, till 2035: Conservative, Base and Optimistic Scenarios (USD Billion)
- Table 14.82 Liposome Development and Manufacturing Services Market in Europe, till 2035: Conservative, Base and Optimistic Scenarios (USD Billion)
- Table 14.83 Liposome Development and Manufacturing Services Market in Asia-Pacific, till 2035: Conservative, Base and Optimistic Scenarios (USD Billion)
- Table 14.84 Liposome Development and Manufacturing Services Market in Middle East and North Africa, till 2035: Conservative, Base and Optimistic Scenarios (USD Billion)
- Table 14.85 Liposome Development and Manufacturing Services Market in Latin America, till 2035: Conservative, Base and Optimistic Scenarios (USD Billion)
List of Figures
- Figure 2.1 Executive Summary: Liposome Development and Manufacturing Service Providers Landscape
- Figure 2.2 Executive Summary: Clinical Trial Analysis
- Figure 2.3 Executive Summary: Publication Analysis
- Figure 2.4 Executive Summary: Patent Analysis
- Figure 2.5 Executive Summary: Global Event Analysis
- Figure 2.6 Executive Summary: Market Forecast and Opportunity Analysis
- Figure 3.1 Formation of Liposomes
- Figure 3.2 Liposomal Drug Delivery Platforms
- Figure 3.3 Therapeutic Applications of Liposomes in Drug Delivery
- Figure 3.4 Methods for Liposome Preparation
- Figure 3.5 Liposomal Analysis and Characterization Methods
- Figure 3.6 Pharmaceutical and Industrial Applications of Liposomes
- Figure 4.1 Liposome Development and Manufacturing Service Providers: Distribution by Year of Establishment
- Figure 4.2 Liposome Development and Manufacturing Service Providers: Distribution by Company Size
- Figure 4.3 Liposome Development and Manufacturing Service Providers: Distribution by Region of Headquarters
- Figure 4.4 Liposome Development and Manufacturing Service Providers: Distribution by Location of Headquarters
- Figure 4.5 Liposome Development and Manufacturing Service Providers: Distribution by Company Size and Region of Headquarters
- Figure 4.6 Liposome Development and Manufacturing Service Providers: Distribution by Type of Method(s) Used for Liposome Preparation
- Figure 4.7 Liposome Development and Manufacturing Service Providers: Distribution by Type of Service(s) Offered
- Figure 4.8 Liposome Development and Manufacturing Service Providers: Distribution by Liposome Bioconjugation Target(s)
- Figure 4.9 Liposome Development and Manufacturing Service Providers: Distribution by Scalability
- Figure 4.10 Liposome Development and Manufacturing Service Providers: Distribution by Liposome Analysis and Characterization Method(s)
- Figure 4.11 Liposome Development and Manufacturing Service Providers: Distribution by Application(s) of Liposomes
- Figure 4.12 Liposome Development and Manufacturing Service Providers: Distribution by Type of Service(s) Offered, Application(s) and Product Formulation
- Figure 4.13 Liposome Development and Manufacturing Service Providers: Distribution by Scale of Operation
- Figure 4.14 Liposome Development and Manufacturing Service Providers: Distribution by End User(s)
- Figure 4.15 Liposome Development and Manufacturing Service Providers: Distribution by Scale of Operation and End User(s)
- Figure 5.1 Baxter BioPharma Solutions: Annual Revenues, FY 2017 Onwards (USD Billion)
- Figure 5.2 Charles River Laboratories: Annual Revenues, FY 2017 Onwards (USD Billion)
- Figure 5.3 Evonik: Annual Revenues, FY 2017 Onwards (EUR Billion)
- Figure 5.4 Fresenius Kabi: Annual Revenues, FY 2017 Onwards (EUR Billion)
- Figure 5.5 GEA: Annual Revenues, FY 2017 Onwards (EUR Billion)
- Figure 5.6 Intertek: Annual Revenues, FY 2017 Onwards (EUR Billion)
- Figure 5.7 Fujifilm: Annual Revenues, FY 2017 Onwards (JPY Trillion)
- Figure 6.1 Clinical Trial Analysis: Scope and Methodology
- Figure 6.2 Clinical Trial Analysis: Cumulative Distribution by Trial Registration Year
- Figure 6.3 Clinical Trial Analysis: Distribution by Trial Status
- Figure 6.4 Clinical Trial Analysis: Distribution by Trial Registration Year and Trial Status
- Figure 6.5 Clinical Trial Analysis: Distribution by Trial Registration Year and Patients Enrolled
- Figure 6.6 Clinical Trial Analysis: Distribution by Trial Phase
- Figure 6.7 Clinical Trial Analysis: Distribution by Trial Phase and Patients Enrolled
- Figure 6.8 Clinical Trial Analysis: Distribution by Type of Sponsor / Collaborator
- Figure 6.9 Clinical Trial Analysis: Distribution by Study Design
- Figure 6.10 Most Active Industry Players: Distribution by Number of Trials
- Figure 6.11 Most Active Non-Industry Players: Distribution by Number of Trials
- Figure 6.12 Most Popular Disease Indication(s): Distribution by Number of Trials
- Figure 6.13 Most Popular Therapeutic Area(s): Distribution by Number of Trials
- Figure 6.14 Clinical Trial Analysis: Distribution by Type of Treatment
- Figure 6.15 Word Cloud Analysis: Emerging Focus Areas
- Figure 6.16 Clinical Trial Analysis: Distribution by Top Indication(s) and Trial Phase
- Figure 6.17 Clinical Trial Analysis: Distribution by Top Indication(s) and Leading Industry Players
- Figure 6.18 Clinical Trial Analysis: Geographical Distribution by Number of Clinical Trials
- Figure 6.19 Clinical Trial Analysis: Geographical Distribution by Number of Patients Enrolled
- Figure 7.1 Publication Analysis: Cumulative Year-wise Trend, since 2017
- Figure 7.2 Publication Analysis: Distribution by Application Area(s)
- Figure 7.3 Word Cloud Analysis: Emerging Focus Areas
- Figure 7.4 Key Journals: Distribution by Number of Publications
- Figure 7.5 Key Journals: Distribution by Impact Factor
- Figure 7.6 Key Journals: Year-wise Distribution by Number of Publications
- Figure 8.1 Patent Analysis: Distribution by Type of Patent
- Figure 8.2 Patent Analysis: Cumulative Distribution by Patent Publication Year, since 2017
- Figure 8.3 Patent Analysis: Year-wise Distribution by Granted Patents and Patent Applications, since 2017
- Figure 8.4 Patent Analysis: Distribution by Geography
- Figure 8.5 Patent Analysis: Distribution by CPC Sections
- Figure 8.6 Word Cloud Analysis: Emerging Focus Areas
- Figure 8.7 Patent Analysis: Cumulative Year-wise Distribution by Type of Organization, since 2017
- Figure 8.8 Leading Industry Players: Distribution by Number of Patents
- Figure 8.9 Leading Non-Industry Players: Distribution by Number of Patents
- Figure 8.10 Leading Individual Assignees: Distribution by Number of Patents
- Figure 8.11 Leading Players: Benchmarking by Patent Characteristics (CPC Codes)
- Figure 8.12 Patent Analysis: Distribution by Patent Age
- Figure 8.13 Liposomes: Patent Valuation Analysis
- Figure 9.1 Global Event Analysis: Cumulative Year-wise Trend, since 2017
- Figure 9.2 Global Event Analysis: Distribution by Event Platform
- Figure 9.3 Global Event Analysis: Distribution by Type of Event
- Figure 9.4 Global Event Analysis: Distribution by Year of Event and Type of Event
- Figure 9.5 Global Event Analysis: Distribution by Location of Events
- Figure 9.6 Word Cloud Analysis: Evolutionary Trends in Event Agenda / Key Focus Area
- Figure 9.7 Global Event Analysis: Historical Trend of Event Agendas, since 2017
- Figure 9.8 Most Active Organizers: Distribution by Number of Events
- Figure 9.9 Most Active Industry Players: Distribution by Number of Events
- Figure 9.10 Most Active Non-Industry Players: Distribution by Number of Events
- Figure 9.11 Seniority Level of Event Speakers: Distribution by Number of Events
- Figure 9.12 Affiliated Department of Event Speakers: Distribution by Number of Events
- Figure 9.13 Most Active Speakers: Distribution by Number of Events
- Figure 9.14 Global Event Analysis: Geographical Mapping of Upcoming Events
- Figure 10.1 Outsourcing: Go / No-Go Framework
- Figure 10.2 Outsourcing: Go / No-Go Framework Methodology
- Figure 10.3 Outsourcing: Go / No-Go Framework for Liposome-based Therapeutic Developers
- Figure 10.4 Liposome-based Therapeutic Developers: Benchmarking of Very Small Companies
- Figure 10.5 Liposome-based Therapeutic Developers: Benchmarking of Small Companies
- Figure 10.6 Liposome-based Therapeutic Developers: Benchmarking of Mid-Sized Companies
- Figure 10.7 Liposome-based Therapeutic Developers: Benchmarking of Large Companies
- Figure 10.8 Liposome-based Therapeutic Developers: Benchmarking of Very Large Companies
- Figure 11.1 Global Liposome Development and Manufacturing Services Market, till 2035 (USD Billion)
- Figure 11.2 Liposome Development and Manufacturing Services Market: Distribution by Type of Product Formulation, Current Year and 2035
- Figure 11.3 Liposome Development and Manufacturing Services Market for Therapeutics, till 2035 (USD Billion)
- Figure 11.4 Liposome Development and Manufacturing Services Market for Nutraceuticals, till 2035 (USD Billion)
- Figure 11.5 Liposome Development and Manufacturing Services Market: Distribution by Scale of Operation, Current Year and 2035
- Figure 11.6 Liposome Development and Manufacturing Services Market for Discovery / Research Scale of Operation, till 2035 (USD Billion)
- Figure 11.7 Liposome Development and Manufacturing Services Market for Preclinical Scale of Operation, till 2035 (USD Billion)
- Figure 11.8 Liposome Development and Manufacturing Services Market for Clinical Scale of Operation, till 2035 (USD Billion)
- Figure 11.9 Liposome Development and Manufacturing Services Market for Commercial Scale of Operation, till 2035 (USD Billion)
- Figure 11.10 Liposome Development and Manufacturing Services Market: Distribution by End User, Current Year and 2035
- Figure 11.11 Liposome Development and Manufacturing Services Market for Pharmaceutical and Biotechnology Industry, till 2035 (USD Billion)
- Figure 11.12 Liposome Development and Manufacturing Services Market for Food Industry, till 2035 (USD Billion)
- Figure 11.13 Liposome Development and Manufacturing Services Market for Agricultural Industry, till 2035 (USD Billion)
- Figure 11.14 Liposome Development and Manufacturing Services Market for Cosmetic Industry, till 2035 (USD Billion)
- Figure 11.15 Liposome Development and Manufacturing Services Market for Academics, till 2035 (USD Billion)
- Figure 11.16 Liposome Development and Manufacturing Services Market for Other Industries, till 2035 (USD Billion)
- Figure 11.17 Liposome Development and Manufacturing Services Market: Distribution by Key Geographical Regions, Current Year and 2035
- Figure 11.18 Liposome Development and Manufacturing Services Market in North America, till 2035 (USD Billion)
- Figure 11.19 Liposome Development and Manufacturing Services Market in Europe, till 2035 (USD Billion)
- Figure 11.20 Liposome Development and Manufacturing Services Market in Asia-Pacific, till 2035 (USD Billion)
- Figure 11.21 Liposome Development and Manufacturing Services Market in Middle East and North Africa, till 2035 (USD Billion)
- Figure 11.22 Liposome Development and Manufacturing Services Market in Latin America, till 2035 (USD Billion)
- Figure 12.1 Concluding Remarks: Liposome Development and Manufacturing Service Providers Market Landscape
- Figure 12.2 Concluding Remarks: Clinical Trial Analysis
- Figure 12.3 Concluding Remarks: Publication Analysis
- Figure 12.4 Concluding Remarks: Patent Analysis
- Figure 12.5 Concluding Remarks: Global Event Analysis
- Figure 12.6 Concluding Remarks: Market Forecast and Opportunity Analysis
 全球化妆品脂质体市场研究报告(2026 年)
 脂质体磷脂市场:依来源、类型、形态和应用划分-2026-2032年全球预测脂质体胆固醇市场按产品类型、给药途径、分销管道、应用和最终用户划分-2026-2032年全球预测
 标靶化脂质体药物递送系统市场规模、份额及成长分析(依产品、技术、适应症、最终用户及地区划分)-2026-2033年产业预测
 脂质体市场按类型、结构、脂质组成、製剂技术、载药方法、应用、给药途径、最终用户和地区划分
 全球脂质体市场 - 全球产业分析、规模、占有率、成长、趋势、预测 (2031) - 依产品、依应用、依分销管道、依地区