


 |
市场调查报告书
商品编码
1895185
人工智慧在药物研发领域的市场:产业趋势及全球预测(至2040年)-按应用、影像处理类型和主要地区划分AI In Drug Discovery Market, till 2040: Distribution by Drug Discovery Steps, Therapeutic Area, and Key Geographical Regions: Industry Trends and Global Forecasts |
||||||
人工智慧在药物研发领域的市场展望
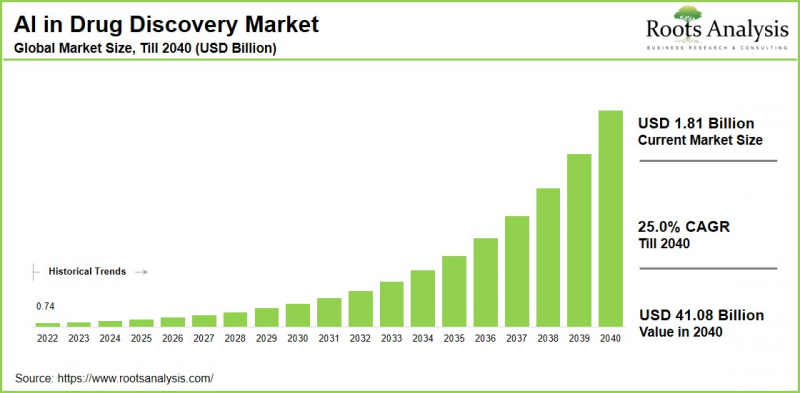
全球人工智慧在药物研发领域的市场规模预计将从目前的18.1亿美元增长至2040年的410.8亿美元,预测期内(至2040年)的复合年增长率(CAGR)为25%。本研究提供了市场规模、成长情境、产业趋势和未来预测。
人工智慧(AI)正在透过虚拟筛选、预测疗效和毒性建模以及新药设计等技术,加速药物研发进程、降低成本并提高成功率,从而彻底改变药物研发方式。机器学习和深度学习技术可以评估大型资料集,以识别有前景的候选药物,预测其在体内的行为,甚至创造全新的分子。 人工智慧也被应用于药物再利用和个人化医疗领域,透过发现现有药物的新用途,并根据患者的个别数据量身定制治疗方案。
由于对各种疾病的先进疗法的需求不断增长,人工智慧在药物发现领域的市场预计将显着增长。随着慢性病在全球的盛行率不断上升,製药公司正在加大研发投入,以满足对新药的持续需求。
高阶主管的策略洞察
推动人工智慧在药物发现市场成长的关键因素
推动人工智慧在药物发现市场成长的关键因素包括人工智慧能够快速分析大型资料集、预测分子特性和毒性、发现新的药物标靶以及加速现有药物的再利用过程。人工智慧利用机器学习来增强药物发现过程,更准确地预测候选药物的疗效、安全性和药物动力学特性,最终降低成本并缩短研发时间。其他关键成长因素包括来自私营和公共部门的投资和资金增加,以及人工智慧平台在标靶识别、先导化合物优化、毒性预测和安全性分析方面的应用日益广泛。
人工智慧在个人化医疗中的作用
人工智慧透过分析大型资料集,促进个人化治疗、提高诊断准确性并加速药物发现进程,为个人化医疗做出重大贡献。它整合了来自基因组资讯、电子健康记录和可穿戴技术的讯息,以预测疾病风险、优化治疗方案并发现新的治疗标靶。这使得诊断更加精准,改善患者预后,并创建更有效率的医疗保健系统。
人工智慧在药物发现领域的市场竞争格局
人工智慧在药物发现领域的市场竞争格局的特征是来自大型企业和小型企业的激烈竞争。 该领域的关键参与者包括英伟达 (NVIDIA)、Insilico Medicine、Exscientia、BenevolentAI、Google DeepMind、IBM 和微软,它们正在开发用于靶点识别、新兴化学和临床试验优化的先进人工智慧系统。阿斯特捷利康、辉瑞、罗氏、诺华和拜耳等大型製药公司正积极与人工智慧公司合作,利用机器学习实现更快、更经济高效的药物研发流程。
Atomwise、Recursion Pharmaceuticals 和 BenchSci 等新创公司正凭藉其独特的人工智慧研究方法进行创新。同时,为了满足对精准医疗和新型疗法日益增长的需求,投资和合作也迅速增加。 人工智慧能够处理复杂的生物数据,缩短研发週期,并提高全球候选药物的成功率,这推动了该市场强劲的发展势头,预计将实现显着成长。
人工智慧在药物发现领域的演进-新兴产业趋势
该领域的新兴趋势包括:利用生成式人工智慧产生新型分子;整合多组学资料以全面了解疾病;以及利用大规模语言模型(LLM)分析科学文献。此外,我们还看到个人化医疗领域取得了进展,该领域正在引入状态空间模型(SSM)以提高计算效率,并利用人工智慧评估个别患者数据,制定个人化治疗方案。
主要市场挑战
人工智慧在药物发现领域的市场面临诸多挑战,包括数据和技术限制、监管和伦理挑战以及营运障碍。资料品质和可用性是关键问题,而药物资料集经常存在碎片化、不一致、不完整和註释不足等问题。 这可能导致人工智慧系统做出偏差的预测,并产生不可靠的结果。
此外,生物系统的复杂性使得全面的计算建模极具挑战性,而高昂的计算成本更是令小型机构难以承受。另外,监管方面的不确定性源于FDA和EMA指南的不断变化,这些指南与人工智慧的迭代特性不符;伦理困境,例如HIPAA/GDPR下的资料隐私问题;以及关于人工智慧开发药物专利申请的智慧财产权纠纷。
人工智慧在药物发现领域的市场:主要细分市场
药物发现流程阶段
- 标靶识别/验证
- 先导化合物发现/先导化合物筛选
- 先导化合物优化
治疗领域
- 肿瘤学
- 中枢神经系统疾病
- 传染病
- 呼吸系统疾病
- 心血管疾病
- 内分泌疾病
- 胃肠道疾病
- 肌肉骨骼疾病
- 免疫系统疾病
- 皮肤病
- 其他
地理区域
- 北美
- 美国美国
- 加拿大
- 墨西哥
- 其他北美国家
- 欧洲
- 奥地利
- 比利时
- 丹麦
- 法国
- 德国
- 爱尔兰
- 义大利
- 荷兰
- 挪威
- 俄罗斯
- 西班牙
- 瑞典
- 瑞士
- 英国
- 其他欧洲国家
- 亚洲
- 中国
- 印度
- 日本
- 新加坡
- 韩国
- 其他亚洲国家
- 拉丁美洲
- 巴西
- 智利
- 哥伦比亚
- 委内瑞拉
- 其他拉丁美洲国家
- 中东和北非非洲
- 埃及
- 伊朗
- 伊拉克
- 以色列
- 科威特
- 沙乌地阿拉伯
- 阿拉伯联合大公国
- 其他中东和北非国家
- 世界其他地区
- 澳大利亚
- 纽西兰
- 其他国家
人工智慧在药物发现市场的应用:关键市场占有率洞察
依药物发现流程阶段划分的市占率
依药物发现步骤划分,全球市场可分为标靶识别与验证、先导化合物生成与筛选、先导化合物优化。据我们估计,目前先导化合物优化占了大部分市场占有率。人工智慧在药物发现早期阶段的应用,尤其是在先导化合物优化阶段,对于提高药物的疗效、可及性和安全性至关重要。此外,先导化合物优化对于提高药物的溶解度、细胞渗透性和稳定性也至关重要。
依地区划分的市占率
据我们估计,北美目前在人工智慧药物研发市场中占较大占有率。这主要归功于製药公司越来越多地使用人工智慧工具进行药物研发,以及旨在改善北美产品交付的合作协议不断增加。值得注意的是,预计亚太地区人工智慧药物研发市场在预测期内将以更高的复合年增长率成长。
人工智慧药物发现市场代表性企业
- Aiforia Technologies
- Atomwise
- BioSyntagma
- Chemalive
- Collaborations Pharmaceuticals
- Cyclica
- DeepMatter
- Recursion
- InveniAI
- MAbSilico
- Optibrium
- Recursion Pharmaceuticals
- Sensyne Health
- Valo Health
人工智慧药物发现市场:报告内容
本报告在以下几个部分对人工智慧药物发现市场进行了详细分析:
- 市场规模与机会分析:对人工智慧药物发现市场进行详细分析。 重点在于关键市场细分:[A] 应用领域,[B] 处理的影像类型,以及 [C] 主要地区。
- 竞争格局:基于多个相关参数,对参与人工智慧药物研发市场的公司进行全面分析,例如 [A] 成立年份,[B] 公司规模,[C] 总部所在地,[D] 所有权结构等。
- 公司简介:提供参与人工智慧药物研发市场的主要公司的详细简介,包括 [A] 总部所在地,[B] 公司规模,[C] 企业使命,[D] 营运区域,[E] 管理团队,[F] 联络方式,[G] 财务资讯,[H] 业务板块,[I] 产品组合,以及近期展望] 发展和未来。
- 宏观趋势:评估人工智慧药物研发产业当前的宏观趋势。
- 专利分析:基于相关参数(例如[A]专利类型、[B]专利公开年份、[C]专利年龄和[D]主要参与者)对药物发现领域人工智慧相关的专利申请和註册情况进行深入分析。
- 近期发展:概述药物发现领域人工智慧市场的最新发展,并基于相关参数(例如[A]项目年份、[B]项目类型、[C]地理分布和[D]主要参与者)进行分析。
- 波特五力分析:分析药物发现领域人工智慧市场的五种竞争力量(新进入者的威胁、买方的议价能力、供应商的议价能力、替代品的威胁、以及现有竞争对手之间的竞争)。
- SWOT分析:提供深入的SWOT框架,突显该领域的优势、劣势、机会和威胁。此外,还提供哈维鲍尔分析,突显每个SWOT参数的相对影响。
- 价值链分析:全面的价值链分析提供人工智慧在药物研发市场中各个阶段和利害关係人的资讯。
目录
第一章:引言
第二章摘要整理
第三章:导论
- 章节概述
- 人工智慧
- 人工智慧的子集
- 机器学习
- 数据科学
- 人工智慧在医疗保健领域的应用
- 药物发现
- 疾病预测、诊断与治疗
- 生产与供应链运营
- 行销
- 临床试验
- 人工智慧在药物发现的应用
- 路径和标靶识别
- 先导化合物识别
- 先导化合物优化
- 类药化合物的合成
- 人工智慧在药物发现过程中的优势
- 人工智慧面临的挑战实施
- 结论
第四章:竞争格局
- 章节概述
- 人工智慧在药物发现的应用:市场格局
第五章 公司简介:北美人工智慧药物发现服务提供者
- 章节概述
- Atomwise
- BioSyntagma
- Collaborations Pharmaceuticals
- Cyclica
- InveniAI
- Recursion Pharmaceuticals
- Valo Health
第六章:公司简介:欧洲人工智慧药物发现服务提供者
- 章节概述
- Aiforia技术
- Chemalive
- DeepMatter
- Exscientia
- MAbSilico
- Optibrium
- Sensyne Health
第七章 公司简介:亚太地区人工智慧药物发现服务提供者
- 章节概述
- 3BIGS
- Gero
- Insilico Medicine
- KeenEye
第八章:合作与伙伴关係
- 章节概述
- 合作模式
- 人工智慧在药物发现的应用:合作与伙伴关係
第九章:资金与投资分析
- 章节概述
- 资金类型
- 基于人工智慧的药物发现:资金和投资
第十章 专利分析
- 章节概述
- 范围与研究方法
- 人工智慧驱动的药物发现:专利分析
- 人工智慧驱动的药物发现:专利基准分析
- 人工智慧驱动的药物发现:专利估值
- 主要专利:引用分析
第十一章:波特五力分析
第十二章:企业估值分析
第十三章:科技巨头的AI医疗保健计画
- 章节概述
- 亚马逊网路服务
- 微软
- 英特尔
- 阿里巴巴云
- 西门子
- IBM
第十四章 成本节约分析
- 章节概述
- 关键假设与研究方法
- 在药物发现中使用人工智慧解决方案的整体成本节约潜力
第十五章 市场预测
- 章节概述
- 关键假设与研究方法
- 全球药物发现人工智慧市场
第十六章 结论
第十七章 高阶主管洞察
- 章节概述
- Aigenpulse
- 云端製药公司
- DEARGEN
- Intelligent Omics
- Pepticom
- Sage-N Research
第18章 附录一:表格资料
第19章 附录二:公司与机构列表
AI in Drug Discovery Market Outlook
As per Roots Analysis, the global AI in drug discovery market size is estimated to grow from USD 1.81 billion in the current year to USD 41.08 billion by 2040, at a CAGR of 25% during the forecast period, till 2040. The new study provides market size, growth scenarios, industry trend and future forecast.
Artificial intelligence (AI) is revolutionizing drug discovery by speeding up the process, lowering costs, and enhancing success rates through methods, such as virtual screening, predictive modeling for efficacy and toxicity, and de novo drug design. Machine learning and deep learning techniques evaluate large datasets to pinpoint promising drug candidates, anticipate their behavior within the body, and even create completely new molecules. AI is also applied in drug repurposing and personalizing therapies by discovering new applications for existing medications or customizing treatments for individual patients based on their specific data.
The market for AI in drug discovery is expected to grow significantly due to the increasing need for advanced therapeutic medications aimed at a wide array of medical conditions. With the rising prevalence of chronic illnesses worldwide, pharmaceutical companies are enhancing their investment in research and development to fulfill the persistent demand for new medications.
Strategic Insights for Senior Leaders
Key Drivers Propelling Growth of AI in Drug Discovery Market
The primary factors propelling the AI in drug discovery market include the use of AI in drug discovery are its capability to quickly analyze large datasets, forecast molecular characteristics and toxicity, discover new drug targets, and speed up the process of repurposing existing medications. AI enhances the drug development process by employing machine learning to better predict a drug candidate's effectiveness, safety, and pharmacokinetic traits, ultimately resulting in lower expenses and shorter timelines. Other significant growth drivers, include the increasing investments and funding from private and public sectors, rising adoption of AI-driven platforms for target identification, lead optimization, toxicity prediction, and safety profiling.
Role of AI in Personalized Medicine
Artificial intelligence significantly contributes to personalized medicine by examining large datasets to facilitate tailored treatments, enhance diagnostics, and speed up the process of drug discovery. It combines information from genomics, electronic health records, and wearable technology to forecast disease risk, refine medication plans, and discover new therapeutic targets. This results in more precise diagnostics, improved patient outcomes, and more effective healthcare systems.
AI in Drug Discovery Market: Competitive Landscape of Companies in this Industry
The competitive landscape of AI in drug discovery market is characterized by intense competition, featuring a combination of large and smaller firms. Key players in this field include NVIDIA, Insilico Medicine, Exscientia, BenevolentAI, Google DeepMind, IBM, and Microsoft, which have created sophisticated AI systems for target identification, generative chemistry, and optimizing clinical trials. Major pharmaceutical organizations, such as AstraZeneca, Pfizer, Roche, Novartis, and Bayer are actively collaborating with AI firms to utilize machine learning for more rapid and economical drug development processes.
Startups such as Atomwise, Recursion Pharmaceuticals, and BenchSci bring innovation with their distinct AI-focused methodologies, while investments and partnerships are rapidly rising to meet the growing demand for precision medicine and new therapeutics. The market, which is projected for substantial growth, shows robust momentum driven by the capability of AI capability to process intricate biological data, shorten R&D timelines, and improve the success rates of drug candidates worldwide.
AI in Drug Discovery Evolution: Emerging Trends in the Industry
Emerging trends in this domain include the utilization of generative AI to create new molecules, the incorporation of multi-omics data for a comprehensive understanding of diseases, and the use of Large Language Models (LLMs) to examine scientific literature. Additional advancements include the employment of State Space Models (SSMs), which provide enhanced computational efficiency, and the integration of AI in personalized medicine, where AI develops customized treatment plans by evaluating individual patient data.
Key Market Challenges
The market for AI in drug discovery faces significant challenges, including data and technical limitations, as well as regulatory and ethical issues, and operational obstacles. The quality and availability of data are pivotal concerns, as pharmaceutical datasets frequently suffer from fragmentation, inconsistencies, incompleteness, or poor annotations. This can result in biased predictions and unreliable outcomes from AI systems.
Further, the intricate nature of biological systems makes comprehensive computational modeling difficult and is further complicated by the high computational expenses that can be burdensome for smaller organizations. Additionally, regulatory uncertainties arise from changing FDA and EMA guidelines that do not align well with the iterative characteristics of AI, ethical dilemmas such as data privacy issues under HIPAA/GDPR, and intellectual property disputes concerning the patenting of drugs developed by AI.
AI in Drug Discovery Market: Key Market Segmentation
Drug Discovery Steps
- Target identification / validation
- Hit generation / lead identification
- Lead optimization
Therapeutic Area
- Oncological disorders
- CNS disorders
- Infectious diseases
- Respiratory disorders
- Cardiovascular disorders
- Endocrine disorders
- Gastrointestinal disorders
- Musculoskeletal disorders
- Immunological disorders
- Dermatological disorders
- Others
Geographical Regions
- North America
- US
- Canada
- Mexico
- Other North American countries
- Europe
- Austria
- Belgium
- Denmark
- France
- Germany
- Ireland
- Italy
- Netherlands
- Norway
- Russia
- Spain
- Sweden
- Switzerland
- UK
- Other European countries
- Asia
- China
- India
- Japan
- Singapore
- South Korea
- Other Asian countries
- Latin America
- Brazil
- Chile
- Colombia
- Venezuela
- Other Latin American countries
- Middle East and North Africa
- Egypt
- Iran
- Iraq
- Israel
- Kuwait
- Saudi Arabia
- UAE
- Other MENA countries
- Rest of the World
- Australia
- New Zealand
- Other countries
AI in Drug Discovery Market: Key Market Share Insights
Market Share by Drug Discovery Step
Based on the drug discovery step, the global market is segmented into target identification / validation, hit generation / lead identification and lead optimization. According to our estimates, currently, lead optimization captures majority share of the market. The application of AI in the initial phases of drug discovery, particularly in lead optimization, is crucial for improving the drug's efficacy, accessibility, and safety profile. Additionally, lead optimization is vital for enhancing solubility, cellular permeability, and stability.
Market Share by Geography
According to our estimates North America currently captures a significant share of the AI in drug discovery market. This is due to the increasing utilization of AI-based tools by pharmaceutical companies for drug discovery and the rise in partnership agreements aimed at improving product offerings in North America. It is also important to note that the AI in drug discovery market in the Asia-Pacific region is expected to grow at a higher CAGR over the forecast period.
Example Players in AI in Drug Discovery Market
- Aiforia Technologies
- Atomwise
- BioSyntagma
- Chemalive
- Collaborations Pharmaceuticals
- Cyclica
- DeepMatter
- Recursion
- InveniAI
- MAbSilico
- Optibrium
- Recursion Pharmaceuticals
- Sensyne Health
- Valo Health
AI in Drug Discovery Market: Report Coverage
The report on the AI in drug discovery market features insights on various sections, including:
- Market Sizing and Opportunity Analysis: An in-depth analysis of the AI in drug discovery market, focusing on key market segments, including [A] drug discovery steps, [B] therapeutic area, and [C] key geographical regions.
- Competitive Landscape: A comprehensive analysis of the companies engaged in the AI in drug discovery market, based on several relevant parameters, such as [A] year of establishment, [B] company size, [C] location of headquarters and [D] ownership structure.
- Company Profiles: Elaborate profiles of prominent players engaged in the AI in drug discovery market, providing details on [A] location of headquarters, [B] company size, [C] company mission, [D] company footprint, [E] management team, [F] contact details, [G] financial information, [H] operating business segments, [I] portfolio, [J] recent developments, and an informed future outlook.
- Megatrends: An evaluation of ongoing megatrends in the AI in drug discovery industry.
- Patent Analysis: An insightful analysis of patents filed / granted in the AI in drug discovery domain, based on relevant parameters, including [A] type of patent, [B] patent publication year, [C] patent age and [D] leading players.
- Recent Developments: An overview of the recent developments made in the AI in drug discovery market, along with analysis based on relevant parameters, including [A] year of initiative, [B] type of initiative, [C] geographical distribution and [D] most active players.
- Porter's Five Forces Analysis: An analysis of five competitive forces prevailing in the AI in drug discovery market, including threats of new entrants, bargaining power of buyers, bargaining power of suppliers, threats of substitute products and rivalry among existing competitors.
- SWOT Analysis: An insightful SWOT framework, highlighting the strengths, weaknesses, opportunities and threats in the domain. Additionally, it provides Harvey ball analysis, highlighting the relative impact of each SWOT parameter.
- Value Chain Analysis: A comprehensive analysis of the value chain, providing information on the different phases and stakeholders involved in the AI in drug discovery market.
Key Questions Answered in this Report
- What is the current and future market size?
- Who are the leading companies in this market?
- What are the growth drivers that are likely to influence the evolution of this market?
- What are the key partnership and funding trends shaping this industry?
- Which region is likely to grow at higher CAGR till 2040?
- How is the current and future market opportunity likely to be distributed across key market segments?
Reasons to Buy this Report
- Detailed Market Analysis: The report provides a comprehensive market analysis, offering detailed revenue projections of the overall market and its specific sub-segments. This information is valuable to both established market leaders and emerging entrants.
- In-depth Analysis of Trends: Stakeholders can leverage the report to gain a deeper understanding of the competitive dynamics within the market. Each report maps ecosystem activity across partnerships, funding, and patent landscapes to reveal growth hotspots and white spaces in the industry.
- Opinion of Industry Experts: The report features extensive interviews and surveys with key opinion leaders and industry experts to validate market trends mentioned in the report.
- Decision-ready Deliverables: The report offers stakeholders with strategic frameworks (Porter's Five Forces, value chain, SWOT), and complimentary Excel / slide packs with customization support.
Additional Benefits
- Complimentary Dynamic Excel Dashboards for Analytical Modules
- Exclusive 15% Free Content Customization
- Personalized Interactive Report Walkthrough with Our Expert Research Team
- Free Report Updates for Versions Older than 6-12 Months
TABLE OF CONTENTS
1. PREFACE
- 1.1. Scope of the Report
- 1.2. Research Methodology
- 1.3. Key Questions Answered
- 1.4. Chapter Outlines
2. EXECUTIVE SUMMARY
3. INTRODUCTION
- 3.1. Chapter Overview
- 3.2. Artificial Intelligence
- 3.3. Subsets of AI
- 3.3.1. Machine Learning
- 3.3.1.1. Supervised Learning
- 3.3.1.2. Unsupervised Learning
- 3.3.1.3. Reinforced / Reinforcement Learning
- 3.3.1.4. Deep Learning
- 3.3.1.5. Natural Language Processing (NLP)
- 3.3.1. Machine Learning
- 3.4. Data Science
- 3.5. Applications of AI in Healthcare
- 3.5.1. Drug Discovery
- 3.5.2. Disease Prediction, Diagnosis and Treatment
- 3.5.3. Manufacturing and Supply Chain Operations
- 3.5.4. Marketing
- 3.5.5. Clinical Trials
- 3.6. AI in Drug Discovery
- 3.6.1. Identification of Pathway and Target
- 3.6.2. Identification of Hit or Lead
- 3.6.3. Lead Optimization
- 3.6.4. Synthesis of Drug-Like Compounds
- 3.7. Advantages of Using AI in the Drug Discovery Process
- 3.8. Challenges Associated with the Adoption of AI
- 3.9. Concluding Remarks
4. COMPETITIVE LANDSCAPE
- 4.1. Chapter Overview
- 4.2. AI-based Drug Discovery: Overall Market Landscape
- 4.2.1. Analysis by Year of Establishment
- 4.2.2. Analysis by Company Size
- 4.2.3. Analysis by Location of Headquarters
- 4.2.4. Analysis by Type of Company
- 4.2.5. Analysis by Type of Technology
- 4.2.6. Analysis by Drug Discovery Steps
- 4.2.7. Analysis by Type of Drug Molecule
- 4.2.8. Analysis by Drug Development Initiatives
- 4.2.9. Analysis by Technology Licensing Option
- 4.2.10. Analysis by Target Therapeutic Area
- 4.2.11. Key Players: Analysis by Number of Platforms / Tools Available
5. COMPANY PROFILES: AI-BASED DRUG DISCOVERY PROVIDERS IN NORTH AMERICA
- 5.1. Chapter Overview
- 5.2. Atomwise
- 5.2.1. Company Overview
- 5.2.2. AI-based Drug Discovery Technology Portfolio
- 5.2.3. Recent Developments and Future Outlook
- 5.3. BioSyntagma
- 5.3.1. Company Overview
- 5.3.2. AI-based Drug Discovery Technology Portfolio
- 5.3.3. Recent Developments and Future Outlook
- 5.4. Collaborations Pharmaceuticals
- 5.4.1. Company Overview
- 5.4.2. AI-based Drug Discovery Technology Portfolio
- 5.4.3. Recent Developments and Future Outlook
- 5.5. Cyclica
- 5.5.1. Company Overview
- 5.5.2. AI-based Drug Discovery Technology Portfolio
- 5.5.3. Recent Developments and Future Outlook
- 5.6. InveniAI
- 5.6.1. Company Overview
- 5.6.2. AI-based Drug Discovery Technology Portfolio
- 5.6.3. Recent Developments and Future Outlook
- 5.7. Recursion Pharmaceuticals
- 5.7.1. Company Overview
- 5.7.2. AI-based Drug Discovery Technology Portfolio
- 5.7.3. Recent Developments and Future Outlook
- 5.8. Valo Health
- 5.8.1. Company Overview
- 5.8.2. AI-based Drug Discovery Technology Portfolio
- 5.8.3. Recent Developments and Future Outlook
6. COMPANY PROFILES: AI-BASED DRUG DISOCVERY SERVICE PROVIDERS IN EUROPE
- 6.1. Chapter Overview
- 6.2. Aiforia Technologies
- 6.2.1. Company Overview
- 6.2.2. AI-based Drug Discovery Technology Portfolio
- 6.2.3. Recent Developments and Future Outlook
- 6.3. Chemalive
- 6.3.1. Company Overview
- 6.3.2. AI-based Drug Discovery Technology Portfolio
- 6.3.3. Recent Developments and Future Outlook
- 6.4. DeepMatter
- 6.4.1. Company Overview
- 6.4.2. AI-based Drug Discovery Technology Portfolio
- 6.4.3. Recent Developments and Future Outlook
- 6.5. Exscientia
- 6.5.1. Company Overview
- 6.5.2. AI-based Drug Discovery Technology Portfolio
- 6.5.3. Recent Developments and Future Outlook
- 6.6. MAbSilico
- 6.6.1. Company Overview
- 6.6.2. AI-based Drug Discovery Technology Portfolio
- 6.6.3. Recent Developments and Future Outlook
- 6.7. Optibrium
- 6.7.1. Company Overview
- 6.7.2. AI-based Drug Discovery Technology Portfolio
- 6.7.3. Recent Developments and Future Outlook
- 6.8. Sensyne Health
- 6.8.1. Company Overview
- 6.8.2. AI-based Drug Discovery Technology Portfolio
- 6.8.3. Recent Developments and Future Outlook
7. COMPANY PROFILES: AI-BASED DRUG DISOCVERY SERVICE PROVIDERS IN ASIA PACIFIC
- 7.1. Chapter Overview
- 7.2. 3BIGS
- 7.2.1. Company Overview
- 7.2.2. AI-based Drug Discovery Technology Portfolio
- 7.2.3. Recent Developments and Future Outlook
- 7.3. Gero
- 7.3.1. Company Overview
- 7.3.2. AI-based Drug Discovery Technology Portfolio
- 7.3.3. Recent Developments and Future Outlook
- 7.4. Insilico Medicine
- 7.4.1. Company Overview
- 7.4.2. AI-based Drug Discovery Technology Portfolio
- 7.4.3. Recent Developments and Future Outlook
- 7.5. KeenEye
- 7.5.1. Company Overview
- 7.5.2. AI-based Drug Discovery Technology Portfolio
- 7.5.3. Recent Developments and Future Outlook
8. PARTNERSHIPS AND COLLABORATIONS
- 8.1. Chapter Overview
- 8.2. Partnership Models
- 8.3. AI-based Drug Discovery: Partnerships and Collaborations
- 8.3.1. Analysis by Year of Partnership
- 8.3.2. Analysis by Type of Partnership
- 8.3.3. Analysis by Year and Type of Partnership
- 8.3.4. Analysis by Target Therapeutic Area
- 8.3.5. Analysis by Focus Area
- 8.3.6. Analysis by Year of Partnership and Focus Area
- 8.3.7. Analysis by Type of Partner Company
- 8.3.8. Analysis by Type of Partnership and Type of Partner Company
- 8.3.9. Most Active Players: Analysis by Number of Partnerships
- 8.3.10. Analysis by Region
- 8.3.11.1. Intercontinental and Intracontinental Deals
- 8.3.11.2. International and Local Deals
9. FUNDING AND INVESTMENT ANALYSIS
- 9.1. Chapter Overview
- 9.2. Types of Funding
- 9.3. AI-based Drug Discovery: Funding and Investments
- 9.3.1. Analysis of Number of Funding Instances by Year
- 9.3.2. Analysis of Amount Invested by Year
- 9.3.3. Analysis by Type of Funding
- 9.3.4. Analysis of Amount Invested and Type of Funding
- 9.3.5. Analysis of Amount Invested by Company Size
- 9.3.6. Analysis by Type of Investor
- 9.3.7. Analysis of Amount Invested by Type of Investor
- 9.3.8. Most Active Players: Analysis by Number of Funding Instances
- 9.3.9. Most Active Players: Analysis by Amount Invested
- 9.3.10. Most Active Investors: Analysis by Number of Funding Instances
- 9.3.11. Analysis of Amount Invested by Geography
- 9.3.11.1. Analysis by Region
- 9.3.11.2. Analysis by Country
10. PATENT ANALYSIS
- 10.1. Chapter Overview
- 10.2. Scope and Methodology
- 10.3. AI-based Drug Discovery: Patent Analysis
- 10.3.1 Analysis by Application Year
- 10.3.2. Analysis by Geography
- 10.3.3. Analysis by CPC Symbols
- 10.3.4. Analysis by Emerging Focus Areas
- 10.3.5. Analysis by Type of Applicant
- 10.3.6. Leading Players: Analysis by Number of Patents
- 10.4. AI-based Drug Discovery: Patent Benchmarking
- 10.4.1. Analysis by Patent Characteristics
- 10.5. AI-based Drug Discovery: Patent Valuation
- 10.6. Leading Patents: Analysis by Number of Citations
11. PORTER'S FIVE FORCES ANALYSIS
- 11.1. Chapter Overview
- 11.2. Methodology and Assumptions
- 11.3. Key Parameters
- 11.3.1. Threats of New Entrants
- 11.3.2. Bargaining Power of Drug Developers
- 11.3.3. Bargaining Power of Companies Using AI for Drug Discovery
- 11.3.4. Threats of Substitute Technologies
- 11.3.5. Rivalry Among Existing Competitors
- 11.4. Concluding Remarks
12. COMPANY VALUATION ANALYSIS
- 12.1. Chapter Overview
- 12.2. Company Valuation Analysis: Key Parameters
- 12.3. Methodology
- 12.4. Company Valuation Analysis: Roots Analysis Proprietary Scores
13. AI-BASED HEALTHCARE INITIATIVES OF TECHNOLOGY GIANTS
- 13.1. Chapter Overview
- 13.1.1. Amazon Web Services
- 13.1.2. Microsoft
- 13.1.3. Intel
- 13.1.4. Alibaba Cloud
- 13.1.5. Siemens
- 13.1.6. Google
- 13.1.7. IBM
14. COST SAVING ANALYSIS
- 14.1. Chapter Overview
- 14.2. Key Assumptions and Methodology
- 14.3. Overall Cost Saving Potential Associated with Use of AI-based Solutions in Drug Discovery
- 14.3.1. Likely Cost Savings: Analysis by Drug Discovery Steps
- 14.3.1.1. Likely Cost Savings During Target Identification / Validation
- 14.3.1.2. Likely Cost Savings During Hit Generation / Lead Identification
- 14.3.1.3. Likely Cost Savings During Lead Optimization
- 14.3.2. Likely Cost Savings: Analysis by Target Therapeutic Area
- 14.3.2.1. Likely Cost Savings for Drugs Targeting Oncological Disorders
- 14.3.2.2. Likely Cost Savings for Drugs Targeting Neurological Disorders
- 14.3.2.3. Likely Cost Savings for Drugs Targeting Infectious Diseases
- 14.3.2.4. Likely Cost Savings for Drugs Targeting Respiratory Disorders
- 14.3.2.5. Likely Cost Savings for Drugs Targeting Cardiovascular Disorders
- 14.3.2.6. Likely Cost Savings for Drugs Targeting Endocrine Disorders
- 14.3.2.7. Likely Cost Savings for Drugs Targeting Gastrointestinal Disorders
- 14.3.2.8. Likely Cost Savings for Drugs Targeting Musculoskeletal Disorders
- 14.3.2.9. Likely Cost Savings for Drugs Targeting Immunological Disorders
- 14.3.2.10. Likely Cost Savings for Drugs Targeting Dermatological Disorders
- 14.3.2.11. Likely Cost Savings for Drugs Targeting Other Disorders
- 14.3.3. Likely Cost Savings: Analysis by Geography
- 14.3.3.1. Likely Cost Savings in North America
- 14.3.3.2. Likely Cost Savings in Europe
- 14.3.3.3. Likely Cost Savings in Asia Pacific
- 14.3.3.4. Likely Cost Savings in MENA
- 14.3.3.5. Likely Cost Savings in Latin America
- 14.3.3.6. Likely Cost Savings in Rest of the World
- 14.3.1. Likely Cost Savings: Analysis by Drug Discovery Steps
15. MARKET FORECAST
- 15.1. Chapter Overview
- 15.2. Key Assumptions and Methodology
- 15.3. Global AI-based Drug Discovery Market
- 15.3.1. AI-based Drug Discovery Market: Distribution by Drug Discovery Steps
- 15.3.1.1. AI-based Drug Discovery Market for Target Identification / Validation
- 15.3.1.2. AI-based Drug Discovery Market for Hit Generation / Lead Identification
- 15.3.1.3. AI-based Drug Discovery Market for Lead Optimization
- 15.3.2. AI-based Drug Discovery Market: Distribution by Target Therapeutic Area
- 15.3.2.1. AI-based Drug Discovery Market for Oncological Disorders
- 15.3.2.2. AI-based Drug Discovery Market for Neurological Disorders
- 15.3.2.3. AI-based Drug Discovery Market for Infectious Diseases
- 15.3.2.4. AI-based Drug Discovery Market for Respiratory Disorders
- 15.3.2.5. AI-based Drug Discovery Market for Cardiovascular Disorders
- 15.3.2.6. AI-based Drug Discovery Market for Endocrine Disorders
- 15.3.2.7. AI-based Drug Discovery Market for Gastrointestinal Disorders
- 15.3.2.8. AI-based Drug Discovery Market for Musculoskeletal Disorders
- 15.3.2.9. AI-based Drug Discovery Market for Immunological Disorders
- 15.3.2.10. AI-based Drug Discovery Market for Dermatological Disorders
- 15.3.2.11. AI-based Drug Discovery Market for Other Disorders
- 15.3.3. AI-based Drug Discovery Market: Distribution by Geography
- 15.3.3.1. AI-based Drug Discovery Market in North America
- 15.3.3.1.1. AI-based Drug Discovery Market in the US
- 15.3.3.1.2. AI-based Drug Discovery Market in Canada
- 15.3.3.2. AI-based Drug Discovery Market in Europe
- 15.3.3.2.1. AI-based Drug Discovery Market in the UK
- 15.3.3.2.2. AI-based Drug Discovery Market in France
- 15.3.3.2.3. AI-based Drug Discovery Market in Germany
- 15.3.3.2.4. AI-based Drug Discovery Market in Spain
- 15.3.3.2.5. AI-based Drug Discovery Market in Italy
- 15.3.3.2.6. AI-based Drug Discovery Market in Rest of Europe
- 15.3.3.3. AI-based Drug Discovery Market in Asia Pacific
- 15.3.3.3.1. AI-based Drug Discovery Market in China
- 15.3.3.3.2. AI-based Drug Discovery Market in India
- 15.3.3.3.3. AI-based Drug Discovery Market in Japan
- 15.3.3.3.4. AI-based Drug Discovery Market in Australia
- 15.3.3.3.5. AI-based Drug Discovery Market in South Korea
- 15.3.3.4. AI-based Drug Discovery Market in MENA
- 15.3.3.4.1. AI-based Drug Discovery Market in Saudi Arabia
- 15.3.3.4.2. AI-based Drug Discovery Market in UAE
- 15.3.3.4.3. AI-based Drug Discovery Market in Iran
- 15.3.3.5. AI-based Drug Discovery Market in Latin America
- 15.3.3.5.1. AI-based Drug Discovery Market in Argentina
- 15.3.3.6. AI-based Drug Discovery Market in Rest of the World
- 15.3.3.1. AI-based Drug Discovery Market in North America
- 15.3.1. AI-based Drug Discovery Market: Distribution by Drug Discovery Steps
16. CONCLUSION
17. EXECUTIVE INSIGHTS
- 17.1. Chapter Overview
- 17.2. Aigenpulse
- 17.2.1. Company Snapshot
- 17.2.2. Interview Transcript: Steve Yemm (Chief Commercial Officer) and Satnam Surae (Chief Product Officer)
- 17.3. Cloud Pharmaceuticals
- 17.3.1. Company Snapshot
- 17.3.2. Interview Transcript: Ed Addison (Co-founder, Chairman and Chief Executive Officer)
- 17.4. DEARGEN
- 17.4.1. Company Snapshot
- 17.4.2. Interview Transcript: Bo Ram Beck (Head Researcher)
- 17.5. Intelligent Omics
- 17.5.1. Company Snapshot
- 17.5.2. Interview Transcript: Simon Haworth (Chief Executive Officer)
- 17.6. Pepticom
- 17.6.1. Company Snapshot
- 17.6.2. Interview Transcript: Immanuel Lerner (Chief Executive Officer, Co-Founder)
- 17.7. Sage-N Research
- 17.7.1. Company Snapshot
- 17.7.2. Interview Transcript: David Chiang (Chairman)
18. APPENDIX I: TABULATED DATA
19. APPENDIX II: LIST OF COMPANIES AND ORGANIZATIONS
 人工智慧浪潮席捲夏威夷——电力和光纤瓶颈:
 AI蛋白质设计市场:按蛋白质类型、技术平台、方法、应用、最终用户和部署类型划分-2026-2032年全球预测基于人工智慧的胜肽类药物发现平台市场(按技术类型、治疗用途、胜肽和最终用户划分)—2026-2032年全球预测
 人工智慧药物发现市场规模、份额和趋势分析报告:按应用、治疗领域、最终用途、地区和细分市场预测,2026-2033年
 人工智慧药物发现市场预测至2032年:按药物类型、治疗领域、技术、应用、最终用户和地区分類的全球分析
 人工智慧在药物研发中的应用:全球市场份额和排名、总收入和需求预测(2025-2031年)
 人工智慧在药物发现领域的市场机会、成长驱动因素、产业趋势分析及预测(2025-2034年)2032 年人工智慧药物研发平台市场预测:按组件、治疗领域、药物类型、部署模式、最终用户和地区进行的全球分析人工智慧在药物研发市场的应用、技术、治疗领域、最终用户和部署模式—2025-2032年全球预测2032 年人工智慧老年保护剂市场预测:按治疗领域、技术、应用、最终用户和地区分類的全球分析