


 |
市场调查报告书
商品编码
1737054
生物反应器及发酵槽市场:产品类别,各製造材料,生物流程类别,生技药品类别,各主要地区Bioreactors and Fermenters Market Distribution by Type of Product, Fabrication Material, Type of Bioprocess, Type of Biologic and Key Geographical Regions |
||||||
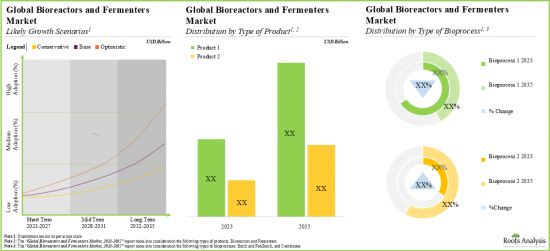
预计2035年,全球生物反应器和发酵槽市场规模将从目前的232亿美元成长至739亿美元,预测期间的复合年增长率为11.1%。
本市场区隔依据以下参数提供市场规模与机会分析:
依产品类型
- 生物反应器
- 发酵槽
各製造材料
- 玻璃
- 不锈钢
- 一次性使用
生物流程类别/p>
- 分批和补料分批
- 连续
生技药品类别
- 抗体
- 疫苗
- 细胞治疗药
- 其他
主要地区
- 北美
- 欧洲
- 亚太地区
- 中东·北非
- 南美
生物反应器与发酵槽市场:成长与趋势
生物反应器和发酵槽在上游生物製造中发挥着至关重要的作用,它们为生产重组蛋白、组织工程构建体和体外细胞模型等高价值产品提供了必要的条件。生物反应器细胞培养技术发展于20世纪初。随着对新型生物製品需求的不断增长,此类设备的使用和可扩展性也随之发展。事实上,生物製药公司、CMO 和非工业参与者已在生物反应器上投入巨资,以满足对疫苗、融合蛋白、抗体、激素、白介素、干扰素、酶和先进疗法 (ATMP) 等各种治疗日益增长的需求。
与生物反应器不同,发酵槽用于厌氧培养微生物(真菌或细菌)细胞群,以生产不需要进行大量翻译后修饰的生物製剂。生物製药市场的整体成长,尤其是在新冠疫情之后,带动了对包括生物反应器在内的先进上游生物加工技术的需求成长,为设备製造商提供了丰厚的利润。
生物反应器与发酵槽市场:关键洞察
本报告深入探讨了生物反应器和发酵槽市场的现状,并识别了行业内的潜在成长机会。主要发现包括:
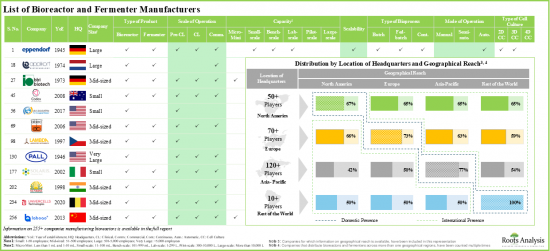
- 目前,全球有超过 255 家公司具备製造各种类型生物反应器和发酵槽的必要专业知识。
- 目前的市场格局特点是,既有成熟公司,也有新兴公司,它们致力于製造各种容量范围和营运模式的生物反应器和发酵槽。
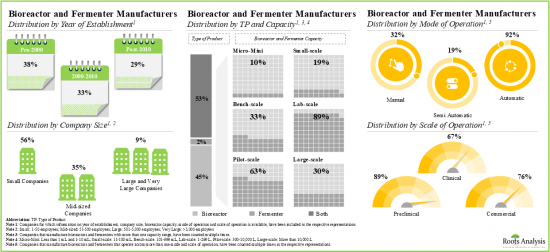
- 近80%的公司生产用于大量生产的生物反应器和发酵罐,其中55%的製造商有能力将设备从实验室规模扩大到商业规模。
- 生物反应器和发酵槽的市场环境较为分散,大多数成熟企业位于新兴市场,而大多数小型企业则位于亚太地区。
- 对复杂生物製剂的需求不断增长,推动了对新型生物反应器和发酵槽的需求,促使生物反应器和发酵槽製造商升级其产能。
- 全球生物反应器和发酵槽的装置容量分布在不同地区,其中超过60%的容量安装在生物製剂製造商的内部设施中。
- 不銹钢生物反应器在目前已安装的生物製剂生产能力中占很大占有率,其中大部分用于生产哺乳动物和微生物治疗药物。
- 预计2035年,全球生物反应器和发酵槽市场的复合年增长率将达到11.1%。
- 从长远来看,用于生产抗体和其他新型生物製剂的一次性/一次性系统很可能成为整个市场的主要成长动力。
生物反应器与发酵槽市场:关键细分市场
依产品类型,市场分为生物反应器和发酵槽。目前,生物反应器在全球生物反应器和发酵槽市场中占有最大占有率。此外,预计在预测期内,发酵槽市场将以更快的速度成长。
根据製造材料,市场分为玻璃、不銹钢和一次性生物反应器。目前,不銹钢生物反应器在全球生物反应器和发酵槽市场中占比最高。此外,一次性生物反应器和发酵槽市场预计将以相对较高的复合年增长率成长,这得益于其诸多优势,例如可减少约50%的总能耗和水耗,并透过省去每批生产后的清洁和灭菌步骤,节省约40%的成本。
依生物製程类型,市场细分为分批、补料分批和连续。目前,分批和补料分批方法中使用的生物反应器在生物反应器和发酵槽市场中占据最大占有率。此外,值得注意的是,连续型生物製程领域的生物反应器和发酵槽市场可望以相对较高的复合年增长率成长。
依生物製剂类型,全球市场细分为抗体、疫苗、细胞疗法和其他生物製剂。目前,抗体领域占最大市场占有率。然而,疫苗领域的生物反应器和发酵槽市场预计未来几年将大幅成长。
依主要地区划分,市场分为北美、欧洲、亚太地区、中东和北非、拉丁美洲。目前,欧洲在全球生物反应器和发酵槽市场占据主导地位,占据最大的收入占有率。此外,预计未来几年欧洲市场的复合年增长率将更高。
本报告提供全球生物反应器及发酵槽市场相关调查,提供市场概要,以及产品类别,各製造材料,生物流程类别,生技药品类别,各主要地区的趋势,及加入此市场的主要企业简介等资讯。
目录
第1章 序文
第2章 摘要整理
第3章 简介
第4章 发酵槽及生物反应器厂商:市场形势
- 章概要
- 发酵槽及生物反应器厂商:市场形势
第5章 企业竞争力分析
- 章概要
- 前提/主要参数
- 调查手法
- 企业竞争力分析:中小企业
- 企业竞争力分析:中规模企业
- 企业竞争力分析:大企业和超大企业
第6章 企业简介
- 章概要
- Applikon Biotechnology(Getinge收购)
- Bionet
- Cytiva
- Eppendorf
- Merck
- Ollital Technology
- Parr Instrument Company
- Sartorius
- Shanghai Bailun Biological Technology
- Solaris Biotech(Donaldson Company收购)
- Solida Biotech
- 郑州市 Laboao Instrument Equipment(LABAO)
第7章 容量分析
- 章概要
- 主要的前提与调查手法
- 结论
第8章 与案例研究:生物流程控制器自动化系统
第9章 市场预测
- 章概要
- 主要的前提与预测调查手法
- 全球发酵槽及生物反应器市场(到2035年)
第10章 执行洞察
第11章 结论
第12章 附录1:表格形式资料
第13章 附录2:企业·团体一览
BIOREACTORS AND FERMENTERS MARKET: OVERVIEW
As per Roots Analysis, the global bioreactors and fermenters market is estimated to grow from USD 23.2 billion in the current year to USD 73.9 billion by 2035, at a CAGR of 11.1% during the forecast period, till 2035.
The market sizing and opportunity analysis has been segmented across the following parameters:
Type of Product
- Bioreactors
- Fermenters
Fabrication Material
- Glass
- Stainless Steel
- Single Use
Type of Bioprocess
- Batch and Fed-batch
- Continuous
Type of Biologic
- Antibodies
- Vaccines
- Cell Therapies
- Other Biologics
Key Geographical Regions
- North America
- Europe
- Asia-Pacific
- Middle East and North Africa
- Latin America
BIOREACTORS AND FERMENTERS MARKET: GROWTH AND TRENDS
Bioreactors and fermenters play an indispensable role in upstream biomanufacturing by providing the requisite conditions for producing high-value products, including recombinant proteins, tissue- engineered constructs and in vitro cell-based models. The technique of culturing cells via bioreactors was developed in the early twentieth century. The usage and scalability of such instruments evolved with the ever-increasing demand for novel biological products. In fact, biopharma companies, CMOs, and non-industry players have significantly invested in bioreactors to meet the rising demand for various therapies, including vaccines, fusion proteins, antibodies, hormones, interleukins, interferons, enzymes, and advanced therapeutic medicinal products (ATMPs).
In contrast to bioreactors, fermenters are used for the anaerobic cultivation of microbial (fungal or bacterial) cell populations to produce biologics that do not require significant post-translational modifications. The overall growth of the biopharmaceutical market, specifically post the COVID-19 pandemic, has led to a rise in demand for advanced upstream bioprocessing technologies, including bioreactors, offering lucrative opportunities to equipment manufacturers.
BIOREACTORS AND FERMENTERS MARKET: KEY INSIGHTS
The report delves into the current state of the bioreactors and fermenters market and identifies potential growth opportunities within the industry. Some key findings from the report include:
- Presently, over 255 companies have the required expertise to manufacture various types of bioreactors and fermenters across the globe.
- The current market landscape features the presence of both established and emerging players engaged in the manufacturing of bioreactors and fermenters of variable capacity ranges and modes of operation.
- Close to 80% of firms manufacture bioreactors and fermenters for batch processes; of these, 55% of the manufacturers have the capability to scale up their equipment from lab to commercial scale.
- The bioreactors and fermenters market landscape is fragmented; most of the well-established players are located in developed regions, while majority of small players are located in the Asia-Pacific region.
- Owing to the rise in demand for complex biologics, the requirement of novel bioreactors and fermenters is increasing, which has prompted the bioreactor and fermenter manufacturers to upgrade their capabilities.
- The global installed bioreactors and fermenters capacity is distributed across various geographies; over 60% of this capacity is installed in the in-house facilities of biologics manufacturers.
- Stainless steel bioreactors hold a prominent share of the current installed biomanufacturing capacity; the majority of this share is dedicated to the manufacturing of mammalian and microbial-based therapeutics.
- The global bioreactors and fermenters market is likely to grow at a CAGR of 11.1%, till 2035; the projected opportunity is likely to be driven by continuous manufacturing bioprocesses.
- In the long term, the disposable / single-use systems used for the manufacturing of antibodies and other novel biologics will likely emerge as the key growth drivers of the overall market.
BIOREACTORS AND FERMENTERS MARKET: KEY SEGMENTS
Bioreactors Segment Occupy the Largest Share of the Bioreactors and Fermenters Market
Based on the type of product, the market is segmented into bioreactors and fermenters. At present, the bioreactors segment holds the maximum share of the global bioreactors and fermenters market. Additionally, the fermenters segment is likely to grow at a faster pace during the forecasted period.
By Fabrication Material, Single Use Bioreactors is the Fastest Growing Segment of the Global Bioreactors and Fermenters Market
Based on the fabrication material, the market is segmented into glass, stainless steel and single use bioreactors. Currently, the stainless-steel bioreactors segment captures the highest proportion of the global bioreactors and fermenters market. Further, the bioreactors and fermenters market for single use bioreactors is likely to grow at a relatively higher CAGR owing to its several benefits, such as ~50% reduction in total energy and water consumption and ~40% cost saving by elimination of cleaning and sterilization processes after every batch production.
Batch and Fed-Batch Segment Occupy the Largest Share of the Bioreactors and Fermenters Market by Type of Bioprocess
Based on the type of bioprocess, the market is segmented into batch and fed batch, and continuous. At present, bioreactors used in batch and fed-batch mode hold the maximum share of the bioreactors and fermenters market. Further, it is worth highlighting that the bioreactors and fermenters market for the continuous type of bioprocess segment is likely to grow at a relatively higher CAGR.
Currently, the Antibodies Segment Holds the Largest Share of the Bioreactors and Fermenters Market
Based on the type of biologic, the global market is segmented into antibodies, vaccines, cell therapies and other biologics. Currently, the antibodies segment holds the largest market share. However, the bioreactors and fermenters market for vaccines segment is expected to witness substantial growth in the coming years.
Europe Accounts for the Largest Share of the Market
Based on key geographical regions, the market is segmented into North America, Europe, Asia-Pacific, Middle East and North Africa, and Latin America. Currently, Europe dominates the global bioreactors and fermenters market and accounts for the largest revenue share. Further, the market in Europe is expected to grow at a higher CAGR in the coming years.
Example Players in the Bioreactors and Fermenters Market
- Applikon Biotechnology
- Bionet
- Cytiva
- Eppendorf
- Merck
- Ollital Technology
- Parr Instrument Company
- Sartorius
- Shanghai Bailun Biological Technology
- Solaris Biotech
- Solida Biotech
- Zhengzhou Laboao Instrument Equipment (LABAO)
BIOREACTORS AND FERMENTERS MARKET: RESEARCH COVERAGE
- Market Sizing and Opportunity Analysis: The report features an in-depth analysis of the global bioreactors and fermenters market, focusing on key market segments, including [A] type of product, [B] fabrication material, [C] type of bioprocess, [D] type of biologic and [E] key geographical regions.
- Market Landscape: A comprehensive evaluation of the companies engaged in manufacturing of bioreactors and fermenters, based on several relevant parameters, such as [A] year of establishment, [B] company size, [C] region of headquarters, [D] geographical reach, [E] capacity, [F] scale of operation, [G] scalability, [H] type of bioprocess, [I] type of cell culture, [J] mode of operation and [K] type of end user.
- Company Competitiveness Analysis: A comprehensive competitive analysis of bioreactors and fermenter manufacturers, examining factors, such as [A] manufacturer strength and [B] portfolio strength.
- Company Profiles: In-depth profiles of key manufacturers engaged in the bioreactors and fermenter market, focusing on [A] overview of the company, [B] financial information (if available), [C] product portfolio, and [D] recent developments and [E] an informed future outlook.
- Capacity Analysis: An insightful analysis of the global installed bioreactors and fermenters capacity of biologics, based on several relevant parameters, such as [A] fabrication material, [B] target disease indication, [C] source of cell culture, [D] reactor volume, [E] type of manufacturer and [F] key geographical regions.
- Case Study: A detailed discussion on the market landscape of bioprocess controllers and automation systems, based on several parameters, such as [A] scale of operation, [B] key features, [C] compatibility with bioreactor system, [D] type of bioprocess and [E] type of process controlled. Additionally, a comprehensive evaluation of companies involved in the development of bioprocess control software, and upstream and downstream controllers, based on several relevant parameters, such as [A] year of establishment, [B] company size, and [C] location of headquarters.
KEY QUESTIONS ANSWERED IN THIS REPORT
- How many companies are currently engaged in this market?
- Which are the leading companies in this market?
- What factors are likely to influence the evolution of this market?
- What is the current and future market size?
- What is the CAGR of this market?
- How is the current and future market opportunity likely to be distributed across key market segments?
REASONS TO BUY THIS REPORT
- The report provides a comprehensive market analysis, offering detailed revenue projections of the overall market and its specific sub-segments. This information is valuable to both established market leaders and emerging entrants.
- Stakeholders can leverage the report to gain a deeper understanding of the competitive dynamics within the market. By analyzing the competitive landscape, businesses can make informed decisions to optimize their market positioning and develop effective go-to-market strategies.
- The report offers stakeholders a comprehensive overview of the market, including key drivers, barriers, opportunities, and challenges. This information empowers stakeholders to stay abreast of market trends and make data-driven decisions to capitalize on growth prospects.
ADDITIONAL BENEFITS
- Complimentary PPT Insights Packs
- Complimentary Excel Data Packs for all Analytical Modules in the Report
- 15% Free Content Customization
- Detailed Report Walkthrough Session with Research Team
- Free Updated report if the report is 6-12 months old or older
TABLE OF CONTENTS
1. PREFACE
- 1.1. Introduction
- 1.2. Key Market Insights
- 1.3. Scope of the Report
- 1.4. Research Methodology
- 1.5. Frequently Asked Questions
- 1.6. Chapter Outlines
2. EXECUTIVE SUMMARY
3. INTRODUCTION
- 3.1. Chapter Overview
- 3.2. Overview of Bioreactors
- 3.3. Components of a Bioreactor
- 3.4. Types of Bioreactors
- 3.4.1. Classification based on Type of Bioprocess
- 3.4.2. Classification based on Mode of Action
- 3.5. Applications of Bioreactors
- 3.6. Future Perspectives
4. FERMENTER AND BIOREACTOR MANUFACTURERS: MARKET LANDSCAPE
- 4.1. Chapter Overview
- 4.2. Fermenter and Bioreactor Manufacturers: Overall Market Landscape
- 4.2.1. Analysis by Year of Establishment
- 4.2.2. Analysis by Company Size
- 4.2.3. Analysis by Region of Headquarters
- 4.2.4. Analysis by Location of Headquarters
- 4.2.5. Analysis by Year of Establishment and Region of Headquarters
- 4.2.6. Analysis by Company Size and Region of Headquarters
- 4.2.7. Analysis by Year of Establishment, Company Size and Region of Headquarters
- 4.2.8. Analysis by Geographical Reach
- 4.2.9. Analysis by Region of Headquarters and Geographical Reach
- 4.2.10. Analysis by Type of Product
- 4.2.11. Analysis by Capacity
- 4.2.12. Analysis by Scale of Operation
- 4.2.13. Analysis by Scalability
- 4.2.14. Analysis by Type of Bioprocess
- 4.2.15. Analysis by Type of Cell Culture
- 4.2.16. Analysis by Mode of Operation
- 4.2.17. Analysis by Type of End-user
5. COMPANY COMPETITIVENESS ANALYSIS
- 5.1. Chapter Overview
- 5.2. Assumptions / Key Parameters
- 5.3. Methodology
- 5.4. Company Competitiveness Analysis: Small Companies
- 5.4.1. Company Competitiveness Analysis: Small Companies based in North America
- 5.4.2. Company Competitiveness Analysis: Small Companies based in Europe
- 5.4.3. Company Competitiveness Analysis: Small Companies based in Asia-Pacific and Rest of the World
- 5.5. Company Competitiveness Analysis: Mid-sized Companies
- 5.5.1. Company Competitiveness Analysis: Mid-sized Companies based in North America
- 5.5.2. Company Competitiveness Analysis: Mid-sized Companies based in Europe
- 5.5.3. Company Competitiveness Analysis: Mid-sized Companies based in Asia-Pacific and Rest of the World
- 5.6. Company Competitiveness Analysis: Large and Very Large Companies
6. COMPANY PROFILES
- 6.1. Chapter Overview
- 6.2. Applikon Biotechnology (acquired by Getinge)
- 6.2.1. Company Overview
- 6.2.2. Product Portfolio
- 6.2.3. Recent Developments and Future Outlook
- 6.3. Bionet
- 6.3.1. Company Overview
- 6.3.2. Product Portfolio
- 6.3.3. Recent Developments and Future Outlook
- 6.4. Cytiva
- 6.4.1. Company Overview
- 6.4.2. Financial Information
- 6.4.3. Product Portfolio
- 6.4.4. Recent Developments and Future Outlook
- 6.5. Eppendorf
- 6.5.1. Company Overview
- 6.5.2. Financial Information
- 6.5.3. Product Portfolio
- 6.5.4. Recent Developments and Future Outlook
- 6.6. Merck
- 6.6.1. Company Overview
- 6.6.2. Financial Information
- 6.6.3. Product Portfolio
- 6.6.4. Recent Developments and Future Outlook
- 6.7. Ollital Technology
- 6.7.1. Company Overview
- 6.7.2. Product Portfolio
- 6.7.3. Recent Developments and Future Outlook
- 6.8. Parr Instrument Company
- 6.8.1. Company Overview
- 6.8.2. Product Portfolio
- 6.8.3. Recent Developments and Future Outlook
- 6.9. Sartorius
- 6.9.1. Company Overview
- 6.9.2. Financial Information
- 6.9.3. Product Portfolio
- 6.9.4. Recent Developments and Future Outlook
- 6.10. Shanghai Bailun Biological Technology
- 6.10.1. Company Overview
- 6.10.2. Product Portfolio
- 6.10.3. Recent Developments and Future Outlook
- 6.11. Solaris Biotech (acquired by Donaldson Company)
- 6.11.1. Company Overview
- 6.11.2. Product Portfolio
- 6.11.3. Recent Developments and Future Outlook
- 6.12. Solida Biotech
- 6.12.1. Company Overview
- 6.12.2. Product Portfolio
- 6.12.3. Recent Developments and Future Outlook
- 6.13. Zhengzhou Laboao Instrument Equipment (LABAO)
- 6.13.1. Company Overview
- 6.13.2. Product Portfolio
- 6.13.3. Recent Developments and Future Outlook
7. CAPACITY ANALYSIS
- 7.1. Chapter Overview
- 7.2. Key Assumptions and Methodology
- 7.2.1. Bioreactors and Fermenters: Global Installed Capacity of Biologics
- 7.2.1.1. Analysis by Fabrication Material
- 7.2.1.2. Analysis by Source of Cell Culture
- 7.2.1.3. Analysis by Reactor Volume
- 7.2.1.4. Analysis by Type of Manufacturer
- 7.2.1.5. Analysis by Key Geographical Regions
- 7.2.1. Bioreactors and Fermenters: Global Installed Capacity of Biologics
- 7.3. Concluding Remarks
8. CASE STUDY: BIOPROCESS CONTROLLERS AND AUTOMATION SYSTEMS
- 8.1. Chapter Overview
- 8.2. Bioprocess Control Software: Overall Market Landscape
- 8.2.1. Analysis by Scale of Operation
- 8.2.2. Analysis by Key Features
- 8.2.3. Analysis by Compatibility with System
- 8.2.4. Analysis by Type of Process Controlled
- 8.3. Bioprocess Control Software Developers: Overall Market Landscape
- 8.3.1. Analysis by Year of Establishment
- 8.3.2. Analysis by Company Size
- 8.3.3. Analysis by Location of Headquarters
- 8.4. Upstream Controllers: Overall Market Landscape
- 8.4.1. Analysis by Scale of Operation
- 8.4.2. Analysis by Key Features
- 8.4.3. Analysis by Compatibility with Bioreactor System
- 8.4.4. Analysis by Type of Bioprocess
- 8.4.5. Analysis by Type of Process Controlled
- 8.5. Upstream Controller Developers: Overall Market Landscape
- 8.5.1. Analysis by Year of Establishment
- 8.5.2. Analysis by Company Size
- 8.5.3. Analysis by Location of Headquarters
- 8.6. Downstream Controller Systems: Overall Market Landscape
- 8.6.1. Analysis by Scale of Operation
- 8.6.2. Analysis by Key Features
- 8.6.3. Analysis by Type of System
- 8.6.4. Analysis by Type of Bioprocess
- 8.6.5. Analysis by Application Area
- 8.7. Downstream Controller System Developers: Overall Market Landscape
- 8.7.1. Analysis by Year of Establishment
- 8.7.2. Analysis by Company Size
- 8.7.3. Analysis by Location of Headquarters
9. MARKET FORECAST
- 9.1. Chapter Overview
- 9.2. Key Assumptions and Forecast Methodology
- 9.3. Global Fermenters and Bioreactors Market, Till 2035
- 9.3.1. Global Fermenters and Bioreactors Market, Till 2035: Distribution by Type of Product
- 9.3.1.1. Global Bioreactors Market, Till 2035
- 9.3.1.2. Global Fermenters Market, Till 2035
- 9.3.2. Global Fermenters and Bioreactors Market, Till 2035: Distribution by Fabrication Material
- 9.3.2.1. Global Glass Fermenters and Bioreactors Market, Till 2035
- 9.3.2.2. Global Stainless Steel Fermenters and Bioreactors Market, Till 2035
- 9.3.2.3. Global Single Use Fermenters and Bioreactors Market, Till 2035
- 9.3.3. Global Fermenters and Bioreactors Market, Till 2035: Distribution by Type of Bioprocess
- 9.3.3.1. Global Fermenters and Bioreactors Market for Batch and Fed-batch Process, Till 2035
- 9.3.3.2. Global Fermenters and Bioreactors Market for Continuous Process, Till 2035
- 9.3.4. Global Fermenters and Bioreactors Market, Till 2035: Distribution by Type of Biologic
- 9.3.4.1. Global Fermenters and Bioreactors Market for Antibodies, Till 2035
- 9.3.4.2. Global Fermenters and Bioreactors Market for Vaccines, Till 2035
- 9.3.4.3. Global Fermenters and Bioreactors Market for Cell Therapies, Till 2035
- 9.3.4.4. Global Fermenters and Bioreactors Market for Other Biologics, Till 2035
- 9.3.5. Global Fermenters and Bioreactors Market, Till 2035: Distribution by Key Geographical Regions
- 9.3.5.1. Global Fermenters and Bioreactors Market in North America, Till 2035
- 9.3.5.2. Global Fermenters and Bioreactors Market in Europe, Till 2035
- 9.3.5.3. Global Fermenters and Bioreactors Market in Asia-Pacific, Till 2035
- 9.3.5.4. Global Fermenters and Bioreactors Market in Middle East and North Africa, Till 2035
- 9.3.5.5. Global Fermenters and Bioreactors Market in Latin America, Till 2035
- 9.3.1. Global Fermenters and Bioreactors Market, Till 2035: Distribution by Type of Product
10. EXECUTIVE INSIGHTS
11. CONCLUDING REMARKS
12. APPENDIX 1: TABULATED DATA
13. APPENDIX 2: LIST OF COMPANIES AND ORGANIZATIONS
List of Tables
- Table 4.1 Fermenter and Bioreactor Manufacturers: List of Companies
- Table 4.2 Fermenter and Bioreactor Manufacturers: Information on Geographical Reach
- Table 4.3 Fermenter and Bioreactor Manufacturers: Information on Volume and Type of Bioreactor and Fermenter
- Table 4.4 Fermenter and Bioreactor Manufacturers: Information on Scale of Operation and Scalability
- Table 4.5 Fermenter and Bioreactor Manufacturers: Type of Bioprocess and Type of Cell Culture
- Table 4.6 Fermenter and Bioreactor Manufacturers: Information on Mode of Operation and Type of End-user
- Table 6.1 Fermenter and Bioreactor Manufacturers: List of Profiled Companies
- Table 6.2 Applikon Biotechnology: Company Snapshot
- Table 6.3 Applikon Biotechnology: Bioreactor Portfolio
- Table 6.4 Applikon Biotechnology: Recent Developments and Future Outlook
- Table 6.5 Bionet: Company Snapshot
- Table 6.6 Bionet: Bioreactor Portfolio
- Table 6.7 Bionet: Recent Developments and Future Outlook
- Table 6.8 Cytiva: Company Snapshot
- Table 6.9 Cytiva: Bioreactor Portfolio
- Table 6.10 Cytiva: Recent Developments and Future Outlook
- Table 6.11 Eppendorf: Company Snapshot
- Table 6.12 Eppendorf: Bioreactor Portfolio
- Table 6.13 Eppendorf: Recent Developments and Future Outlook
- Table 6.14 Merck: Company Snapshot
- Table 6.15 Merck: Bioreactor Portfolio
- Table 6.16 Merck: Recent Developments and Future Outlook
- Table 6.17 Ollital Technology: Company Snapshot
- Table 6.18 Ollital Technology: Bioreactor Portfolio
- Table 6.19 Ollital Technology: Recent Developments and Future Outlook
- Table 6.20 Parr Instrument Company: Company Snapshot
- Table 6.21 Parr Instrument Company: Bioreactor Portfolio
- Table 6.22 Parr Instrument Company: Recent Developments and Future Outlook
- Table 6.23 Sartorius: Company Snapshot
- Table 6.24 Sartorius: Bioreactor Portfolio
- Table 6.25 Sartorius: Recent Developments and Future Outlook
- Table 6.26 Shanghai Bailun Biological Technology: Company Snapshot
- Table 6.27 Shanghai Bailun Biological Technology: Bioreactor Portfolio
- Table 6.28 Shanghai Bailun Biological Technology: Recent Developments and Future Outlook
- Table 6.29 Solaris Biotech: Company Snapshot
- Table 6.30 Solaris Biotech: Bioreactor Portfolio
- Table 6.31 Solaris Biotech: Recent Developments and Future Outlook
- Table 6.32 Solida Biotech: Company Snapshot
- Table 6.33 Solida Biotech: Bioreactor Portfolio
- Table 6.34 Solida Biotech: Recent Developments and Future Outlook
- Table 6.35 Zhengzhou Laboao Instrument Equipment (LABAO): Company Snapshot
- Table 6.36 Zhengzhou Laboao Instrument Equipment (LABAO): Bioreactor Portfolio
- Table 6.37 Zhengzhou Laboao Instrument Equipment (LABAO): Recent Developments and Future Outlook
- Table 7.1 Capacity Analysis: Information on Contract Biomanufacturing Capacity
- Table 7.2 Capacity Analysis: Average Capacity per Category (Sample Data Set)
- Table 7.3 Capacity Analysis: Average Capacity for Mammalian Expression System (Sample Data Set)
- Table 7.4 Capacity Analysis: Average Capacity for Microbial Expression System (Sample Data Set)
- Table 7.5 Capacity Analysis: Global Distribution of Contract, in-house and Hybrid Biomanufacturing Capacity
- Table 8.1 Bioprocess Control Software: Information on Key Features, Compatibility with Bioreactor System and Process Controlled
- Table 8.2 Upstream Controllers: Information on Key Features, Type of Bioprocess and Compatibility with Bioreactor System
- Table 8.3 Downstream Controller Systems: Information on Key Features, Type of System, Type of Bioprocess and Application Area
- Table 10.1 Ensofa Projects: Key Highlights
- Table 10.2 Sunrise Process Equipments: Key Highlights
- Table 10.3 CerCell: Key Highlights
- Table 10.4 CelVivo: Key Highlights
- Table 12.1 Fermenter and Bioreactor Manufacturers: Distribution by Year of Establishment
- Table 12.2 Fermenter and Bioreactor Manufacturers: Distribution by Company Size
- Table 12.3 Fermenter and Bioreactor Manufacturers: Distribution by Region of Headquarters
- Table 12.4 Fermenter and Bioreactor Manufacturers: Distribution by Location of Headquarters
- Table 12.5 Fermenter and Bioreactor Manufacturers: Distribution by Year of Establishment and Region of Headquarters
- Table 12.6 Fermenter and Bioreactor Manufacturers: Distribution by Company Size and Region of Headquarters
- Table 12.7 Fermenter and Bioreactor Manufacturers: Distribution by Year of Establishment, Company Size and Region of Headquarters
- Table 12.8 Fermenter and Bioreactor Manufacturers: Distribution by Geographical Reach
- Table 12.9 Fermenter and Bioreactor Manufacturers: Distribution by Region of Headquarters Region and Geographical Reach
- Table 12.10 Fermenter and Bioreactor Manufacturers: Distribution by Type of Product
- Table 12.11 Fermenter and Bioreactor Manufacturers: Distribution by Capacity
- Table 12.12 Fermenter and Bioreactor Manufacturers: Distribution by Scale of Operation
- Table 12.13 Fermenter and Bioreactor Manufacturers: Distribution by Scalability
- Table 12.14 Fermenter and Bioreactor Manufacturers: Distribution by Type of Bioprocess
- Table 12.15 Fermenter and Bioreactor Manufacturers: Analysis by Type of Cell Culture
- Table 12.16 Fermenter and Bioreactor Manufacturers: Analysis by Mode of Operation
- Table 12.17 Fermenter and Bioreactor Manufacturers: Analysis by Type of End-user
- Table 12.18 Cytiva: Annual Revenues, Since FY 2017 (USD Million)
- Table 12.19 Eppendorf: Annual Revenues, Since FY 2017 (EUR Million)
- Table 12.20 Merck: Annual Revenues, Since FY 2017 (EUR Billion)
- Table 12.21 Sartorius: Annual Revenues, Since FY 2017 (EUR Billion)
- Table 12.22 Global Installed Bioreactors and Fermenters Capacity (by Million Liters): Distribution by Fabrication Material
- Table 12.23 Global Installed Bioreactors and Fermenters Capacity (by Million Liters): Distribution by Source of Cell Culture
- Table 12.24 Global Installed Bioreactors and Fermenters Capacity (by Million Liters): Distribution by Reactor Volume
- Table 12.25 Global Installed Bioreactors and Fermenters Capacity (by Million Liters): Distribution by Type of Manufacturer
- Table 12.26 Global Installed Bioreactors and Fermenters Capacity (by Million Liters): Distribution by Key Geographical Regions
- Table 12.27 Bioprocess Control Software: Distribution by Scale of Operation
- Table 12.28 Bioprocess Control Software: Distribution by Key Features
- Table 12.29 Bioprocess Control Software: Distribution by Compatibility with Systems
- Table 12.30 Bioprocess Control Software: Distribution by Type of Process Controlled
- Table 12.31 Bioprocess Control Software Developers: Distribution by Year of Establishment
- Table 12.32 Bioprocess Control Software Developers: Distribution by Company Size
- Table 12.33 Bioprocess Control Software Developers: Distribution by Location of Headquarters
- Table 12.34 Upstream Controllers: Distribution by Scale of Operation
- Table 12.35 Upstream Controllers: Distribution by Key Features
- Table 12.36 Upstream Controllers: Distribution by Compatibility with Bioreactor Systems
- Table 12.37 Upstream Controllers: Distribution by Type of Bioprocess
- Table 12.38 Upstream Controllers: Distribution by Type of Process Controlled
- Table 12.39 Upstream Controller Developers: Distribution by Year of Establishment
- Table 12.40 Upstream Controller Developers: Distribution by Company Size
- Table 12.41 Upstream Controller Developers: Distribution by Location of Headquarters
- Table 12.42 Downstream Controller Systems: Distribution by Scale of Operation
- Table 12.43 Downstream Controller Systems: Distribution by Key Features
- Table 12.44 Downstream Controller Systems: Distribution by Type of System
- Table 12.45 Downstream Controller Systems: Distribution by Type of Bioprocess
- Table 12.46 Downstream Controller Systems: Distribution by Application Area
- Table 12.47 Downstream Controller System Developers: Distribution by Year of Establishment
- Table 12.48 Downstream Controller System Developers: Distribution by Company Size
- Table 12.49 Downstream Controller System Developers: Distribution by Location of Headquarters
- Table 12.50 Global Fermenters and Bioreactors Market, Till 2035 (USD Billion)
- Table 12.51 Global Fermenters and Bioreactors Market, Till 2035: Distribution by Type of Product (USD Billion)
- Table 12.52 Global Bioreactors Market, Till 2035 (USD Billion)
- Table 12.53 Global Fermenters Market, Till 2035 (USD Billion)
- Table 12.54 Global Fermenters and Bioreactors Market, Till 2035: Distribution by Fabrication Material
- Table 12.55 Global Glass Fermenters and Bioreactors Market, Till 2035
- Table 12.56 Global Stainless Steel Fermenters and Bioreactors Market, Till 2035
- Table 12.57 Global Single Use Fermenters and Bioreactors Market, Till 2035
- Table 12.58 Global Fermenters and Bioreactors Market, Till 2035: Distribution by Type of Bioprocess
- Table 12.59 Global Fermenters and Bioreactors Market for Batch and Fed-batch Process, Till 2035
- Table 12.60 Global Fermenters and Bioreactors Market for Continuous Process, Till 2035
- Table 12.61 Global Fermenters and Bioreactors Market, Till 2035: Distribution by Type of Biologic
- Table 12.62 Global Fermenters and Bioreactors Market for Antibodies, Till 2035
- Table 12.63 Global Fermenters and Bioreactors Market for Vaccines, Till 2035
- Table 12.64 Global Fermenters and Bioreactors Market for Cell Therapies, Till 2035
- Table 12.65 Global Fermenters and Bioreactors Market for Other Biologics, Till 2035
- Table 12.66 Global Fermenters and Bioreactors Market, Till 2035: Distribution by Key Geographical Regions
- Table 12.67 Fermenters and Bioreactors Market in North America, Till 2035
- Table 12.68 Fermenters and Bioreactors Market in Europe, Till 2035
- Table 12.69 Fermenters and Bioreactors Market in Asia-Pacific, Till 2035
- Table 12.70 Fermenters and Bioreactors in Middle East and North Africa, Till 2035
- Table 12.71 Fermenters and Bioreactors Market in Latin America, Till 2035
List of Figures
- Figure 2.1 Executive Summary: Overall Market Landscape
- Figure 2.2 Executive Summary: Capacity Analysis
- Figure 2.3 Executive Summary: Market Forecast
- Figure 3.1 Components of a Bioreactor
- Figure 3.2 Types of Bioreactors (based on Type of Bioprocess)
- Figure 3.3 Types of Bioreactors (based on Mode of Action)
- Figure 3.4 Industries Employing Bioreactors
- Figure 3.5 Applications of Bioreactors in Pharmaceutical Industry
- Figure 4.1 Fermenter and Bioreactor Manufacturers: Distribution by Year of Establishment
- Figure 4.2 Fermenter and Bioreactor Manufacturers: Distribution by Company Size
- Figure 4.3 Fermenter and Bioreactor Manufacturers: Distribution by Region of Headquarters
- Figure 4.4 Fermenter and Bioreactor Manufacturers: Distribution by Location of Headquarters
- Figure 4.5 Fermenter and Bioreactor Manufacturers: Distribution by Year of Establishment and Region of Headquarters
- Figure 4.6 Fermenter and Bioreactor Manufacturers: Distribution by Company Size and Region of Headquarters
- Figure 4.7 Fermenter and Bioreactor Manufacturers: Distribution by Year of Establishment, Company Size and Region of Headquarters
- Figure 4.8 Fermenter and Bioreactor Manufacturers: Distribution by Geographical Reach
- Figure 4.9 Fermenter and Bioreactor Manufacturers: Distribution by Region of Headquarters and Geographical Reach
- Figure 4.10 Fermenter and Bioreactor Manufacturers: Distribution by Type of Product
- Figure 4.11 Fermenter and Bioreactor Manufacturers: Distribution by Capacity
- Figure 4.12 Fermenter and Bioreactor Manufacturers: Distribution by Scale of Operation
- Figure 4.13 Fermenter and Bioreactor Manufacturers: Distribution by Scalability
- Figure 4.14 Fermenter and Bioreactor Manufacturers: Distribution by Type of Bioprocess
- Figure 4.15 Fermenter and Bioreactor Manufacturers: Distribution by Type of Cell Culture
- Figure 4.16 Fermenter and Bioreactor Manufacturers: Distribution by Mode of Operation
- Figure 4.17 Fermenter and Bioreactor Manufacturers: Distribution by Type of End-user
- Figure 5.1 Competitiveness Analysis: Small Companies
- Figure 5.2 Competitiveness Analysis: Small Companies based in North America
- Figure 5.3 Competitiveness Analysis: Small Companies based in Europe
- Figure 5.4 Competitiveness Analysis: Small Companies based in Asia-Pacific and Rest of the World
- Figure 5.5 Competitiveness Analysis: Mid-sized Companies
- Figure 5.6 Competitiveness Analysis: Mid-sized Companies based in North America
- Figure 5.7 Competitiveness Analysis: Mid-sized Companies based in Europe
- Figure 5.8 Competitiveness Analysis: Mid-sized Companies based in Asia-Pacific and Rest of the World
- Figure 5.9 Competitiveness Analysis: Large and Very Large Companies
- Figure 5.10 Competitiveness Analysis of Fermenter and Bioreactor Manufacturers: Competitiveness Score of Top Players
- Figure 6.1 Cytiva: Annual Revenues, Since FY 2017 (USD Million)
- Figure 6.2 Eppendorf: Annual Revenues, Since FY 2017 (EUR Million)
- Figure 6.3 Merck: Annual Revenues, Since FY 2017 (EUR Billion)
- Figure 6.4 Sartorius: Annual Revenues, Since FY 2017 (EUR Billion)
- Figure 7.1 Global Installed Bioreactors and Fermenters Capacity (by Million Liters): Distribution by Fabrication Material
- Figure 7.2 Global Installed Bioreactors and Fermenters Capacity (by Million Liters): Distribution by Source of Cell Culture
- Figure 7.3 Global Installed Bioreactors and Fermenters Capacity (by Million Liters): Distribution by Reactor Volume
- Figure 7.4 Global Installed Bioreactors and Fermenters Capacity (by Million Liters): Distribution by Type of Manufacturer
- Figure 7.5 Global Installed Bioreactors and Fermenters Capacity (by Million Liters): Distribution by Key Geographical Regions
- Figure 8.1 Bioprocess Control Software: Distribution by Scale of Operation
- Figure 8.2 Bioprocess Control Software: Distribution by Key Features
- Figure 8.3 Bioprocess Control Software: Distribution by Compatibility with System
- Figure 8.4 Bioprocess Control Software: Distribution by Type of Process Controlled
- Figure 8.5 Bioprocess Control Software Developers: Distribution by Year of Establishment
- Figure 8.6 Bioprocess Control Software Developers: Distribution by Company Size
- Figure 8.7 Bioprocess Control Software Developers: Distribution by Location of Headquarters
- Figure 8.8 Upstream Controllers: Distribution by Scale of Operation
- Figure 8.9 Upstream Controllers: Distribution by Key Features
- Figure 8.10 Upstream Controllers: Distribution by Compatibility with Bioreactor System
- Figure 8.11 Upstream Controllers: Distribution by Type of Bioprocess
- Figure 8.12 Upstream Controllers: Distribution by Type of Process Controlled
- Figure 8.13 Upstream Controller Developers: Distribution by Year of Establishment
- Figure 8.14 Upstream Controller Developers: Distribution by Company Size
- Figure 8.15 Upstream Controller Developers: Distribution by Location of Headquarters
- Figure 8.16 Downstream Controller Systems: Distribution by Scale of Operation
- Figure 8.17 Downstream Controller Systems: Distribution by Key Features
- Figure 8.18 Downstream Controller Systems: Distribution by Type of System
- Figure 8.19 Downstream Controller Systems: Distribution by Type of Bioprocess
- Figure 8.20 Downstream Controller Systems: Distribution by Application Area
- Figure 8.21 Downstream Controller System Developers: Distribution by Year of Establishment
- Figure 8.22 Downstream Controller System Developers: Distribution by Company Size
- Figure 8.23 Downstream Controller System Developers: Distribution by Location of Headquarters
- Figure 9.1 Global Fermenters and Bioreactors Market, Till 2035 (USD Billion)
- Figure 9.2 Global Fermenters and Bioreactors Market, Till 2035: Distribution by Type of Product (USD Billion)
- Figure 9.3 Global Bioreactors Market, Till 2035 (USD Billion)
- Figure 9.4 Global Fermenters Market, Till 2035 (USD Billion)
- Figure 9.5 Global Fermenters and Bioreactors Market, Till 2035: Distribution by Fabrication Material
- Figure 9.6 Global Glass Fermenters and Bioreactors Market, Till 2035
- Figure 9.7 Global Stainless Steel Fermenters and Bioreactors Market, Till 2035
- Figure 9.7 Global Single Use Fermenters and Bioreactors Market, Till 2035
- Figure 9.8 Global Fermenters and Bioreactors Market, Till 2035: Distribution by Type of Bioprocess
- Figure 9.9 Global Fermenters and Bioreactors Market for Batch and Fed-batch Process, Till 2035
- Figure 9.10 Global Fermenters and Bioreactors Market for Continuous Process, Till 2035
- Figure 9.11 Global Fermenters and Bioreactors Market, Till 2035: Distribution by Type of Biologic
- Figure 9.12 Global Fermenters and Bioreactors Market for Antibodies, Till 2035
- Figure 9.13 Global Fermenters and Bioreactors Market for Vaccines, Till 2035
- Figure 9.14 Global Fermenters and Bioreactors Market for Cell Therapies, Till 2035
- Figure 9.15 Global Fermenters and Bioreactors Market for Other Biologics, Till 2035
- Figure 9.16 Global Fermenters and Bioreactors Market, Till 2035: Distribution by Key Geographical Regions
- Figure 9.17 Fermenters and Bioreactors Market in North America, Till 2035
- Figure 9.18 Fermenters and Bioreactors Market in Europe, Till 2035
- Figure 9.19 Fermenters and Bioreactors Market in Asia-Pacific, Till 2035
- Figure 9.20 Fermenters and Bioreactors Market in Middle East and North Africa, Till 2035
- Figure 9.21 Fermenters and Bioreactors Market in Latin America, Till 2035
- Figure 11.1 Concluding Remarks: Overall Market Landscape of Fermenter and Bioreactor Manufacturers
- Figure 11.2 Concluding Remarks: Geographical Distribution of Fermenter and Bioreactor Manufacturers
- Figure 11.3 Concluding Remarks: Capacity Analysis
- Figure 11.4 Concluding Remarks: Market Forecast


