


 |
市场调查报告书
商品编码
1752085
智慧灌溉的全球市场(~2035年):各元件类型,各系统类型,各应用领域,类别企业,各地区,产业趋势,预测Smart Irrigation Market, Till 2035: Distribution by Type of Component, Type of System, Area of Application, Type of Enterprise and Geographical Regions: Industry Trends and Global Forecasts |
||||||
智慧灌溉市场概况
预计2035年,全球智慧灌溉市场规模将从目前的18.9亿美元增至74.7亿美元,预测期内复合年增长率为13.28%。
智慧灌溉市场:成长与趋势
根据联合国粮食及农业组织的数据,目前全球灌溉面积超过3.05亿公顷。这标誌着灌溉技术突破性的融合。值得注意的是,随着智慧技术越来越多地融入各种农业实践,以加强作物管理和资源利用,灌溉人工智慧必将改变整个产业。
智慧灌溉的主要优点包括节水节能、降低人力成本、改善植物健康、显着节省长期成本。此外,智慧灌溉还提供多种功能,例如天气响应和土壤湿度监测技术,可即时调整灌溉计划,透过移动设备进行远端访问,以及利用数据分析进行持续优化。必须认识到,互联网的快速发展和日益增强的社会意识正在推动人工智慧和物联网等技术创新在关键行业中的应用。
智慧灌溉市场正成为全球技术创新和数位转型演进的重要组成部分,旨在提高农业效率和节约用水。物联网设备利用感测器收集有关土壤湿度、天气模式和作物生长状况的即时信息,对于充分发挥智慧灌溉市场的潜力至关重要。此外,人工智慧工具可以分析数据,促进准确的预测模型和自适应灌溉策略,从而提高水管理的效率和永续性。
因此,由于技术的持续进步和投资的增加,预计智慧灌溉市场在预测期内将大幅成长。
本报告提供全球智慧灌溉市场相关调查,市场规模的估计与机会分析,竞争情形,企业简介,SWOT分析等资讯。
目录
章节1 报告概要
第1章 序文
第2章 调查手法
第3章 市场动态
第4章 宏观经济指标
章节2 定性性的知识和见识
第5章 摘要整理
第6章 简介
第7章 法规情势
章节3 市场概要
第8章 主要企业整体性资料库
第9章 竞争情形
第10章 閒置频段分析
第11章 企业的竞争力的分析
第12章 智慧灌溉市场上Start-Ups生态系统
章节4 企业简介
第13章 企业简介
- 章概要
- AquaSpy
- Banyan Water
- Caipos
- Calsense
- Delta-T Devices
- ET Water
- Galcon
- Hunter Industries
- HydroPoint
- Jain Irrigation
- Netafim
- Rachio
- Rain Bird
- Soil Scout Oy
- The Toro Company
- Weathermatic
章节5 市场趋势
第14章 大趋势分析
第15章 未满足需求分析
第16章 专利分析
第17章 近几年的发展
章节6 市场机会分析
第18章 全球智慧灌溉市场
第19章 市场机会:各元件类型
第20章 市场机会:各系统类型
第21章 市场机会:各应用领域
第22章 市场机会:类别企业
第23章 北美的智慧灌溉市场机会
第24章 欧洲的智慧灌溉市场机会
第25章 亚洲的智慧灌溉市场机会
第26章 中东·北非(MENA)的智慧灌溉市场机会
第27章 南美的智慧灌溉市场机会
第28章 其他地区的智慧灌溉市场机会
第29章 市场集中的分析:各主要企业
第30章 邻近市场的分析
章节7 策略工具
第31章 胜利的关键策略
第32章 波特的五力分析
第33章 SWOT分析
第34章 价值链分析
第35章 Roots的策略性建议
章节8 其他的独家发现和见识
第36章 来自1次调查的知识和见识
第37章 报告的结论
章节9 附录
Smart Irrigation Market Overview
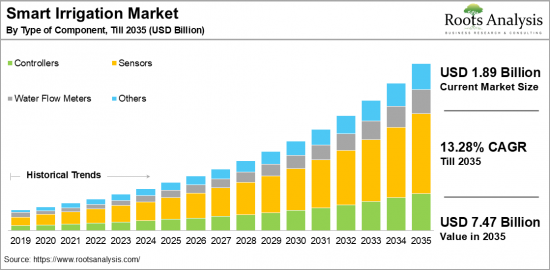
As per Roots Analysis, the global smart irrigation market size is estimated to grow from USD 1.89 billion in the current year to USD 7.47 billion by 2035, at a CAGR of 13.28% during the forecast period, till 2035.
The opportunity for smart irrigation market has been distributed across the following segments:
Type of Component
- Controllers
- Sensors
- Water Flow Meters
- Others
Type of System
- Sensor-Based Controller Systems
- Weather-Based Controller Systems
Area of Application
- Agricultural
- Non-Agricultural
Type of Enterprise
- Large
- Small and Medium Enterprise
Geographical Regions
- North America
- US
- Canada
- Mexico
- Other North American countries
- Europe
- Austria
- Belgium
- Denmark
- France
- Germany
- Ireland
- Italy
- Netherlands
- Norway
- Russia
- Spain
- Sweden
- Switzerland
- UK
- Other European countries
- Asia
- China
- India
- Japan
- Singapore
- South Korea
- Other Asian countries
- Latin America
- Brazil
- Chile
- Colombia
- Venezuela
- Other Latin American countries
- Middle East and North Africa
- Egypt
- Iran
- Iraq
- Israel
- Kuwait
- Saudi Arabia
- UAE
- Other MENA countries
- Rest of the World
- Australia
- New Zealand
- Other countries
SMART IRRIGATION MARKET: GROWTH AND TRENDS
According to the Food and Agriculture Organization, over 305 million hectares worldwide are currently set up for irrigation. This demonstrates the groundbreaking integration of technology into irrigation. It is important to note that artificial intelligence in irrigation is set to transform the industry as smart technologies are increasingly incorporated into various agricultural practices to enhance crop management and resource use.
Some key benefits of smart irrigation include water and energy savings, reduced labor costs, improved plant health, and substantial long-term cost reductions. Additionally, smart irrigation provides various features, such as weather-responsive and soil moisture monitoring technologies that adjust watering schedules in real-time, remote access via mobile devices, and data analytics for continuous optimization. It is essential to recognize that the adoption of technological innovations like AI and IoT in major industries is increasing due to the rapid expansion of the internet and growing public awareness.
The smart irrigation market is rising as an essential element in the global evolution towards innovation and digital change aimed at achieving greater farming efficiency and water conservation. Internet of Things (IoT) devices have been crucial in realizing the full potential of the smart irrigation market by utilizing sensors to gather real-time information on soil moisture, weather patterns, and crop conditions. Further, AI-powered tools facilitate precise predictive modeling and adaptable irrigation strategies by analyzing data, thereby improving both efficiency and sustainability in water management.
As a result, with ongoing technological advancements and increasing investment, the smart irrigation market is anticipated to grow significantly during the forecast period.
SMART IRRIGATION MARKET: KEY SEGMENTS
Market Share by Type of Component
Based on type of component, the global smart irrigation market is segmented into controllers, sensors, water flow meters and others. According to our estimates, currently, sensors capture the majority share of the market. Further, this segment is expected to grow at a higher CAGR during the forecast period. This can be attributed to several factors, including their essential function in improving agricultural output and resource utilization by offering real-time information on soil moisture, temperature, and humidity.
Market Share by Type of System
Based on type of system, the smart irrigation market is segmented into sensor-based controller systems and weather-based controller systems. According to our estimates, currently, sensor-based controller systems capture the majority of the market. Further, this segment is expected to grow at a higher CAGR during the forecast period. This can be attributed to its capability to examine extensive datasets from various sources, along with its enhanced efficiency and flexibility in comparison to irrigation control systems that rely on weather data.
Market Share by Area of Application
Based on area of application, the smart irrigation market is segmented into agricultural and non-agricultural. According to our estimates, currently, non-agricultural segment captures the majority share of the market. This can be attributed to the growing need for effective water management in landscaping, golf courses, and sports venues, especially in urban locations experiencing water shortages.
Market Share by Type of Enterprise
Based on type of enterprise, the smart irrigation market is segmented into large and small and medium enterprise. According to our estimates, currently, large companies capture the majority share of the market. Further, this segment is expected to grow at a higher CAGR during the forecast period. This can be attributed to its ability to invest in advanced irrigation technologies, leverage significant resources, enhance economies of scale, and promote business expansion.
Market Share by Geographical Regions
Based on geographical regions, the smart irrigation market is segmented into North America, Europe, Asia, Latin America, Middle East and North Africa, and the rest of the world. According to our estimates, currently, North America captures the majority share of the market. However, owing to the significant investments, government programs, and the expanding irrigation sector in nations such as China and India, the market in Asia is anticipated to grow at a relatively higher CAGR during the forecast period.
Example Players in Smart Irrigation Market
- AquaSpy
- Banyan Water
- Caipos
- Calsense
- Delta-T Devices
- ET Water
- Galcon
- Hunter Industries
- HydroPoint
- Jain Irrigation
- Netafim
- Rachio
- Rain Bird
- Soil Scout Oy
- The Toro Company
- Weathermatic
SMART IRRIGATION MARKET: RESEARCH COVERAGE
The report on the smart irrigation market features insights on various sections, including:
- Market Sizing and Opportunity Analysis: An in-depth analysis of the smart irrigation market, focusing on key market segments, including [A] type of component, [B] type of system, [C] area of application, [D] type of enterprise, [E] geographical regions.
- Competitive Landscape: A comprehensive analysis of the companies engaged in the smart irrigation market, based on several relevant parameters, such as [A] year of establishment, [B] company size, [C] location of headquarters and [D] type of component, [E] type of system, [F] area of application, [G] type of enterprise
- Company Profiles: Elaborate profiles of prominent players engaged in the smart irrigation market, providing details on [A] location of headquarters, [B]company size, [C] company mission, [D] company footprint, [E] management team, [F] contact details, [G] financial information, [H] operating business segments, [I] smart irrigation portfolio, [J] moat analysis, [K] recent developments, and an informed future outlook.
- Megatrends: An evaluation of ongoing megatrends in smart irrigation industry.
- Patent Analysis: An insightful analysis of patents filed / granted in the smart irrigation domain, based on relevant parameters, including [A] type of patent, [B] patent publication year, [C] patent age and [D] leading players.
- Recent Developments: An overview of the recent developments made in the smart irrigation market, along with analysis based on relevant parameters, including [A] year of initiative, [B] type of initiative, [C] geographical distribution and [D] most active players.
- Porter's Five Forces Analysis: An analysis of five competitive forces prevailing in the smart irrigation market, including threats of new entrants, bargaining power of buyers, bargaining power of suppliers, threats of substitute products and rivalry among existing competitors.
- SWOT Analysis: An insightful SWOT framework, highlighting the strengths, weaknesses, opportunities and threats in the domain. Additionally, it provides Harvey ball analysis, highlighting the relative impact of each SWOT parameter.
KEY QUESTIONS ANSWERED IN THIS REPORT
- How many companies are currently engaged in smart irrigation market?
- Which are the leading companies in this market?
- What factors are likely to influence the evolution of this market?
- What is the current and future market size?
- What is the CAGR of this market?
- How is the current and future market opportunity likely to be distributed across key market segments?
REASONS TO BUY THIS REPORT
- The report provides a comprehensive market analysis, offering detailed revenue projections of the overall market and its specific sub-segments. This information is valuable to both established market leaders and emerging entrants.
- Stakeholders can leverage the report to gain a deeper understanding of the competitive dynamics within the market. By analyzing the competitive landscape, businesses can make informed decisions to optimize their market positioning and develop effective go-to-market strategies.
- The report offers stakeholders a comprehensive overview of the market, including key drivers, barriers, opportunities, and challenges. This information empowers stakeholders to stay abreast of market trends and make data-driven decisions to capitalize on growth prospects.
ADDITIONAL BENEFITS
- Complimentary Excel Data Packs for all Analytical Modules in the Report
- 15% Free Content Customization
- Detailed Report Walkthrough Session with Research Team
- Free Updated report if the report is 6-12 months old or older
TABLE OF CONTENTS
SECTION I: REPORT OVERVIEW
1. PREFACE
- 1.1. Introduction
- 1.2. Market Share Insights
- 1.3. Key Market Insights
- 1.4. Report Coverage
- 1.5. Key Questions Answered
- 1.6. Chapter Outlines
2. RESEARCH METHODOLOGY
- 2.1. Chapter Overview
- 2.2. Research Assumptions
- 2.3. Database Building
- 2.3.1. Data Collection
- 2.3.2. Data Validation
- 2.3.3. Data Analysis
- 2.4. Project Methodology
- 2.4.1. Secondary Research
- 2.4.1.1. Annual Reports
- 2.4.1.2. Academic Research Papers
- 2.4.1.3. Company Websites
- 2.4.1.4. Investor Presentations
- 2.4.1.5. Regulatory Filings
- 2.4.1.6. White Papers
- 2.4.1.7. Industry Publications
- 2.4.1.8. Conferences and Seminars
- 2.4.1.9. Government Portals
- 2.4.1.10. Media and Press Releases
- 2.4.1.11. Newsletters
- 2.4.1.12. Industry Databases
- 2.4.1.13. Roots Proprietary Databases
- 2.4.1.14. Paid Databases and Sources
- 2.4.1.15. Social Media Portals
- 2.4.1.16. Other Secondary Sources
- 2.4.2. Primary Research
- 2.4.2.1. Introduction
- 2.4.2.2. Types
- 2.4.2.2.1. Qualitative
- 2.4.2.2.2. Quantitative
- 2.4.2.3. Advantages
- 2.4.2.4. Techniques
- 2.4.2.4.1. Interviews
- 2.4.2.4.2. Surveys
- 2.4.2.4.3. Focus Groups
- 2.4.2.4.4. Observational Research
- 2.4.2.4.5. Social Media Interactions
- 2.4.2.5. Stakeholders
- 2.4.2.5.1. Company Executives (CXOs)
- 2.4.2.5.2. Board of Directors
- 2.4.2.5.3. Company Presidents and Vice Presidents
- 2.4.2.5.4. Key Opinion Leaders
- 2.4.2.5.5. Research and Development Heads
- 2.4.2.5.6. Technical Experts
- 2.4.2.5.7. Subject Matter Experts
- 2.4.2.5.8. Scientists
- 2.4.2.5.9. Doctors and Other Healthcare Providers
- 2.4.2.6. Ethics and Integrity
- 2.4.2.6.1. Research Ethics
- 2.4.2.6.2. Data Integrity
- 2.4.3. Analytical Tools and Databases
- 2.4.1. Secondary Research
3. MARKET DYNAMICS
- 3.1. Forecast Methodology
- 3.1.1. Top-Down Approach
- 3.1.2. Bottom-Up Approach
- 3.1.3. Hybrid Approach
- 3.2. Market Assessment Framework
- 3.2.1. Total Addressable Market (TAM)
- 3.2.2. Serviceable Addressable Market (SAM)
- 3.2.3. Serviceable Obtainable Market (SOM)
- 3.2.4. Currently Acquired Market (CAM)
- 3.3. Forecasting Tools and Techniques
- 3.3.1. Qualitative Forecasting
- 3.3.2. Correlation
- 3.3.3. Regression
- 3.3.4. Time Series Analysis
- 3.3.5. Extrapolation
- 3.3.6. Convergence
- 3.3.7. Forecast Error Analysis
- 3.3.8. Data Visualization
- 3.3.9. Scenario Planning
- 3.3.10. Sensitivity Analysis
- 3.4. Key Considerations
- 3.4.1. Demographics
- 3.4.2. Market Access
- 3.4.3. Reimbursement Scenarios
- 3.4.4. Industry Consolidation
- 3.5. Robust Quality Control
- 3.6. Key Market Segmentations
- 3.7. Limitations
4. MACRO-ECONOMIC INDICATORS
- 4.1. Chapter Overview
- 4.2. Market Dynamics
- 4.2.1. Time Period
- 4.2.1.1. Historical Trends
- 4.2.1.2. Current and Forecasted Estimates
- 4.2.2. Currency Coverage
- 4.2.2.1. Overview of Major Currencies Affecting the Market
- 4.2.2.2. Impact of Currency Fluctuations on the Industry
- 4.2.3. Foreign Exchange Impact
- 4.2.3.1. Evaluation of Foreign Exchange Rates and Their Impact on Market
- 4.2.3.2. Strategies for Mitigating Foreign Exchange Risk
- 4.2.4. Recession
- 4.2.4.1. Historical Analysis of Past Recessions and Lessons Learnt
- 4.2.4.2. Assessment of Current Economic Conditions and Potential Impact on the Market
- 4.2.5. Inflation
- 4.2.5.1. Measurement and Analysis of Inflationary Pressures in the Economy
- 4.2.5.2. Potential Impact of Inflation on the Market Evolution
- 4.2.6. Interest Rates
- 4.2.6.1. Overview of Interest Rates and Their Impact on the Market
- 4.2.6.2. Strategies for Managing Interest Rate Risk
- 4.2.7. Commodity Flow Analysis
- 4.2.7.1. Type of Commodity
- 4.2.7.2. Origins and Destinations
- 4.2.7.3. Values and Weights
- 4.2.7.4. Modes of Transportation
- 4.2.8. Global Trade Dynamics
- 4.2.8.1. Import Scenario
- 4.2.8.2. Export Scenario
- 4.2.9. War Impact Analysis
- 4.2.9.1. Russian-Ukraine War
- 4.2.9.2. Israel-Hamas War
- 4.2.10. COVID Impact / Related Factors
- 4.2.10.1. Global Economic Impact
- 4.2.10.2. Industry-specific Impact
- 4.2.10.3. Government Response and Stimulus Measures
- 4.2.10.4. Future Outlook and Adaptation Strategies
- 4.2.11. Other Indicators
- 4.2.11.1. Fiscal Policy
- 4.2.11.2. Consumer Spending
- 4.2.11.3. Gross Domestic Product (GDP)
- 4.2.11.4. Employment
- 4.2.11.5. Taxes
- 4.2.11.6. R&D Innovation
- 4.2.11.7. Stock Market Performance
- 4.2.11.8. Supply Chain
- 4.2.11.9. Cross-Border Dynamics
- 4.2.1. Time Period
SECTION II: QUALITATIVE INSIGHTS
5. EXECUTIVE SUMMARY
6. INTRODUCTION
- 6.1. Chapter Overview
- 6.2. Overview of Smart Irrigation Market
- 6.2.1. Type of Component
- 6.2.2. Type of System
- 6.2.3. Area of Application
- 6.2.4. Type of Enterprise
- 6.3. Future Perspective
7. REGULATORY SCENARIO
SECTION III: MARKET OVERVIEW
8. COMPREHENSIVE DATABASE OF LEADING PLAYERS
9. COMPETITIVE LANDSCAPE
- 9.1. Chapter Overview
- 9.2. Smart Irrigation: Overall Market Landscape
- 9.2.1. Analysis by Year of Establishment
- 9.2.2. Analysis by Company Size
- 9.2.3. Analysis by Location of Headquarters
- 9.2.4. Analysis by Ownership Structure
10. WHITE SPACE ANALYSIS
11. COMPANY COMPETITIVENESS ANALYSIS
12. STARTUP ECOSYSTEM IN THE SMART IRRIGATION MARKET
- 12.1. Smart Irrigation Market: Market Landscape of Startups
- 12.1.1. Analysis by Year of Establishment
- 12.1.2. Analysis by Company Size
- 12.1.3. Analysis by Company Size and Year of Establishment
- 12.1.4. Analysis by Location of Headquarters
- 12.1.5. Analysis by Company Size and Location of Headquarters
- 12.1.6. Analysis by Ownership Structure
- 12.2. Key Findings
SECTION IV: COMPANY PROFILES
13. COMPANY PROFILES
- 13.1. Chapter Overview
- 13.2. AquaSpy *
- 13.2.1. Company Overview
- 13.2.2. Company Mission
- 13.2.3. Company Footprint
- 13.2.4. Management Team
- 13.2.5. Contact Details
- 13.2.6. Financial Performance
- 13.2.7. Operating Business Segments
- 13.2.8. Service / Product Portfolio (project specific)
- 13.2.9. MOAT Analysis
- 13.2.10. Recent Developments and Future Outlook
- 13.3. Banyan Water
- 13.4. Caipos
- 13.5. Calsense
- 13.6. Delta-T Devices
- 13.7. ET Water
- 13.8. Galcon
- 13.9. Hunter Industries
- 13.10. HydroPoint
- 13.11. Jain Irrigation
- 13.12. Netafim
- 13.13. Rachio
- 13.14. Rain Bird
- 13.15. Soil Scout Oy
- 13.16. The Toro Company
- 13.17. Weathermatic
SECTION V: MARKET TRENDS
14. MEGA TRENDS ANALYSIS
15. UNMET NEED ANALYSIS
16. PATENT ANALYSIS
17. RECENT DEVELOPMENTS
- 17.1. Chapter Overview
- 17.2. Recent Funding
- 17.3. Recent Partnerships
- 17.4. Other Recent Initiatives
SECTION VI: MARKET OPPORTUNITY ANALYSIS
18. GLOBAL SMART IRRIGATION MARKET
- 18.1. Chapter Overview
- 18.2. Key Assumptions and Methodology
- 18.3. Trends Disruption Impacting Market
- 18.4. Demand Side Trends
- 18.5. Supply Side Trends
- 18.6. Global Smart Irrigation Market, Historical Trends (Since 2019) and Forecasted Estimates (Till 2035)
- 18.7. Multivariate Scenario Analysis
- 18.7.1. Conservative Scenario
- 18.7.2. Optimistic Scenario
- 18.8. Investment Feasibility Index
- 18.9. Key Market Segmentations
19. MARKET OPPORTUNITY BASED ON TYPE OF COMPONENT
- 19.1. Chapter Overview
- 19.2. Key Assumptions and Methodology
- 19.3. Revenue Shift Analysis
- 19.4. Market Movement Analysis
- 19.5. Penetration-Growth (P-G) Matrix
- 19.6. Smart Irrigation Market for Controllers: Historical Trends (Since 2019) and Forecasted Estimates (Till 2035)
- 19.7. Smart Irrigation Market for Sensors: Historical Trends (Since 2019) and Forecasted Estimates (Till 2035)
- 19.8. Smart Irrigation Market for Water Flow Meters: Historical Trends (Since 2019) and Forecasted Estimates (Till 2035)
- 19.9. Smart Irrigation Market for Others: Historical Trends (Since 2019) and Forecasted Estimates (Till 2035)
- 19.10. Data Triangulation and Validation
- 19.10.1. Secondary Sources
- 19.10.2. Primary Sources
- 19.10.3. Statistical Modeling
20. MARKET OPPORTUNITIES BASED ON TYPE OF SYSTEM
- 20.1. Chapter Overview
- 20.2. Key Assumptions and Methodology
- 20.3. Revenue Shift Analysis
- 20.4. Market Movement Analysis
- 20.5. Penetration-Growth (P-G) Matrix
- 20.6. Smart Irrigation Market for Sensor-Based Controller Systems: Historical Trends (Since 2019) and Forecasted Estimates (Till 2035)
- 20.7. Smart Irrigation Market for Weather-Based Controller Systems: Historical Trends (Since 2019) and Forecasted Estimates (Till 2035)
- 20.8. Data Triangulation and Validation
- 20.8.1. Secondary Sources
- 20.8.2. Primary Sources
- 20.8.3. Statistical Modeling
21. MARKET OPPORTUNITIES BASED ON AREA OF APPLICATION
- 21.1. Chapter Overview
- 21.2. Key Assumptions and Methodology
- 21.3. Revenue Shift Analysis
- 21.4. Market Movement Analysis
- 21.5. Penetration-Growth (P-G) Matrix
- 21.6. Smart Irrigation Market for Agricultural: Historical Trends (Since 2019) and Forecasted Estimates (Till 2035)
- 21.7. Smart Irrigation Market for Non-Agricultural: Historical Trends (Since 2019) and Forecasted Estimates (Till 2035)
- 21.9. Data Triangulation and Validation
- 21.9.1. Secondary Sources
- 21.9.2. Primary Sources
- 21.9.3. Statistical Modeling
22. MARKET OPPORTUNITIES BASED ON TYPE OF ENTERPRISE
- 22.1. Chapter Overview
- 22.2. Key Assumptions and Methodology
- 22.3. Revenue Shift Analysis
- 22.4. Market Movement Analysis
- 22.5. Penetration-Growth (P-G) Matrix
- 22.6. Smart Irrigation Market for Large: Historical Trends (Since 2019) and Forecasted Estimates (Till 2035)
- 22.7. Smart Irrigation Market for Small and Medium Enterprise: Historical Trends (Since 2019) and Forecasted Estimates (Till 2035)
- 22.8. Data Triangulation and Validation
- 22.8.1. Secondary Sources
- 22.8.2. Primary Sources
- 22.8.3. Statistical Modeling
23. MARKET OPPORTUNITIES FOR SMART IRRIGATION IN NORTH AMERICA
- 23.1. Chapter Overview
- 23.2. Key Assumptions and Methodology
- 23.3. Revenue Shift Analysis
- 23.4. Market Movement Analysis
- 23.5. Penetration-Growth (P-G) Matrix
- 23.6. Smart Irrigation Market in North America: Historical Trends (Since 2019) and Forecasted Estimates (Till 2035)
- 23.6.1. Smart Irrigation Market in the US: Historical Trends (Since 2019) and Forecasted Estimates (Till 2035)
- 23.6.2. Smart Irrigation Market in Canada: Historical Trends (Since 2019) and Forecasted Estimates (Till 2035)
- 23.6.3. Smart Irrigation Market in Mexico: Historical Trends (Since 2019) and Forecasted Estimates (Till 2035)
- 23.6.4. Smart Irrigation Market in Other North American Countries: Historical Trends (Since 2019) and Forecasted Estimates (Till 2035)
- 23.7. Data Triangulation and Validation
24. MARKET OPPORTUNITIES FOR SMART IRRIGATION IN EUROPE
- 24.1. Chapter Overview
- 24.2. Key Assumptions and Methodology
- 24.3. Revenue Shift Analysis
- 24.4. Market Movement Analysis
- 24.5. Penetration-Growth (P-G) Matrix
- 24.6. Smart Irrigation Market in Europe: Historical Trends (Since 2019) and Forecasted Estimates (Till 2035)
- 24.6.1. Smart Irrigation Market in Austria: Historical Trends (Since 2019) and Forecasted Estimates (Till 2035)
- 24.6.2. Smart Irrigation Market in Belgium: Historical Trends (Since 2019) and Forecasted Estimates (Till 2035)
- 24.6.3. Smart Irrigation Market in Denmark: Historical Trends (Since 2019) and Forecasted Estimates (Till 2035)
- 24.6.4. Smart Irrigation Market in France: Historical Trends (Since 2019) and Forecasted Estimates (Till 2035)
- 24.6.5. Smart Irrigation Market in Germany: Historical Trends (Since 2019) and Forecasted Estimates (Till 2035)
- 24.6.6. Smart Irrigation Market in Ireland: Historical Trends (Since 2019) and Forecasted Estimates (Till 2035)
- 24.6.7. Smart Irrigation Market in Italy: Historical Trends (Since 2019) and Forecasted Estimates (Till 2035)
- 24.6.8. Smart Irrigation Market in Netherlands: Historical Trends (Since 2019) and Forecasted Estimates (Till 2035)
- 24.6.9. Smart Irrigation Market in Norway: Historical Trends (Since 2019) and Forecasted Estimates (Till 2035)
- 24.6.10. Smart Irrigation Market in Russia: Historical Trends (Since 2019) and Forecasted Estimates (Till 2035)
- 24.6.11. Smart Irrigation Market in Spain: Historical Trends (Since 2019) and Forecasted Estimates (Till 2035)
- 24.6.12. Smart Irrigation Market in Sweden: Historical Trends (Since 2019) and Forecasted Estimates (Till 2035)
- 24.6.13. Smart Irrigation Market in Sweden: Historical Trends (Since 2019) and Forecasted Estimates (Till 2035)
- 24.6.14. Smart Irrigation Market in Switzerland: Historical Trends (Since 2019) and Forecasted Estimates (Till 2035)
- 24.6.15. Smart Irrigation Market in the UK: Historical Trends (Since 2019) and Forecasted Estimates (Till 2035)
- 24.6.16. Smart Irrigation Market in Other European Countries: Historical Trends (Since 2019) and Forecasted Estimates (Till 2035)
- 24.7. Data Triangulation and Validation
25. MARKET OPPORTUNITIES FOR SMART IRRIGATION IN ASIA
- 25.1. Chapter Overview
- 25.2. Key Assumptions and Methodology
- 25.3. Revenue Shift Analysis
- 25.4. Market Movement Analysis
- 25.5. Penetration-Growth (P-G) Matrix
- 25.6. Smart Irrigation Market in Asia: Historical Trends (Since 2019) and Forecasted Estimates (Till 2035)
- 25.6.1. Smart Irrigation Market in China: Historical Trends (Since 2019) and Forecasted Estimates (Till 2035)
- 25.6.2. Smart Irrigation Market in India: Historical Trends (Since 2019) and Forecasted Estimates (Till 2035)
- 25.6.3. Smart Irrigation Market in Japan: Historical Trends (Since 2019) and Forecasted Estimates (Till 2035)
- 25.6.4. Smart Irrigation Market in Singapore: Historical Trends (Since 2019) and Forecasted Estimates (Till 2035)
- 25.6.5. Smart Irrigation Market in South Korea: Historical Trends (Since 2019) and Forecasted Estimates (Till 2035)
- 25.6.6. Smart Irrigation Market in Other Asian Countries: Historical Trends (Since 2019) and Forecasted Estimates (Till 2035)
- 25.7. Data Triangulation and Validation
26. MARKET OPPORTUNITIES FOR SMART IRRIGATION IN MIDDLE EAST AND NORTH AFRICA (MENA)
- 26.1. Chapter Overview
- 26.2. Key Assumptions and Methodology
- 26.3. Revenue Shift Analysis
- 26.4. Market Movement Analysis
- 26.5. Penetration-Growth (P-G) Matrix
- 26.6. Smart Irrigation Market in Middle East and North Africa (MENA): Historical Trends (Since 2019) and Forecasted Estimates (Till 2035)
- 26.6.1. Smart Irrigation Market in Egypt: Historical Trends (Since 2019) and Forecasted Estimates (Till 205)
- 26.6.2. Smart Irrigation Market in Iran: Historical Trends (Since 2019) and Forecasted Estimates (Till 2035)
- 26.6.3. Smart Irrigation Market in Iraq: Historical Trends (Since 2019) and Forecasted Estimates (Till 2035)
- 26.6.4. Smart Irrigation Market in Israel: Historical Trends (Since 2019) and Forecasted Estimates (Till 2035)
- 26.6.5. Smart Irrigation Market in Kuwait: Historical Trends (Since 2019) and Forecasted Estimates (Till 2035)
- 26.6.6. Smart Irrigation Market in Saudi Arabia: Historical Trends (Since 2019) and Forecasted Estimates (Till 2035)
- 26.6.7. Smart Irrigation Market in United Arab Emirates (UAE): Historical Trends (Since 2019) and Forecasted Estimates (Till 2035)
- 26.6.8. Smart Irrigation Market in Other MENA Countries: Historical Trends (Since 2019) and Forecasted Estimates (Till 2035)
- 26.7. Data Triangulation and Validation
27. MARKET OPPORTUNITIES FOR SMART IRRIGATION IN LATIN AMERICA
- 27.1. Chapter Overview
- 27.2. Key Assumptions and Methodology
- 27.3. Revenue Shift Analysis
- 27.4. Market Movement Analysis
- 27.5. Penetration-Growth (P-G) Matrix
- 27.6. Smart Irrigation Market in Latin America: Historical Trends (Since 2019) and Forecasted Estimates (Till 2035)
- 27.6.1. Smart Irrigation Market in Argentina: Historical Trends (Since 2019) and Forecasted Estimates (Till 2035)
- 27.6.2. Smart Irrigation Market in Brazil: Historical Trends (Since 2019) and Forecasted Estimates (Till 2035)
- 27.6.3. Smart Irrigation Market in Chile: Historical Trends (Since 2019) and Forecasted Estimates (Till 2035)
- 27.6.4. Smart Irrigation Market in Colombia Historical Trends (Since 2019) and Forecasted Estimates (Till 2035)
- 27.6.5. Smart Irrigation Market in Venezuela: Historical Trends (Since 2019) and Forecasted Estimates (Till 2035)
- 27.6.6. Smart Irrigation Market in Other Latin American Countries: Historical Trends (Since 2019) and Forecasted Estimates (Till 2035)
- 27.7. Data Triangulation and Validation
28. MARKET OPPORTUNITIES FOR SMART IRRIGATION IN REST OF THE WORLD
- 28.1. Chapter Overview
- 28.2. Key Assumptions and Methodology
- 28.3. Revenue Shift Analysis
- 28.4. Market Movement Analysis
- 28.5. Penetration-Growth (P-G) Matrix
- 28.6. Smart Irrigation Market in Rest of the World: Historical Trends (Since 2019) and Forecasted Estimates (Till 2035)
- 28.6.1. Smart Irrigation Market in Australia: Historical Trends (Since 2019) and Forecasted Estimates (Till 2035)
- 28.6.2. Smart Irrigation Market in New Zealand: Historical Trends (Since 2019) and Forecasted Estimates (Till 2035)
- 28.6.3. Smart Irrigation Market in Other Countries
- 28.7. Data Triangulation and Validation
29. MARKET CONCENTRATION ANALYSIS: DISTRIBUTION BY LEADING PLAYERS
- 29.1. Leading Player 1
- 29.2. Leading Player 2
- 29.3. Leading Player 3
- 29.4. Leading Player 4
- 29.5. Leading Player 5
- 29.6. Leading Player 6
- 29.7. Leading Player 7
- 29.8. Leading Player 8
30. ADJACENT MARKET ANALYSIS
SECTION VII: STRATEGIC TOOLS
31. KEY WINNING STRATEGIES
32. PORTER'S FIVE FORCES ANALYSIS
33. SWOT ANALYSIS
34. VALUE CHAIN ANALYSIS
35. ROOTS STRATEGIC RECOMMENDATIONS
- 35.1. Chapter Overview
- 35.2. Key Business-related Strategies
- 35.2.1. Research & Development
- 35.2.2. Product Manufacturing
- 35.2.3. Commercialization / Go-to-Market
- 35.2.4. Sales and Marketing
- 35.3. Key Operations-related Strategies
- 35.3.1. Risk Management
- 35.3.2. Workforce
- 35.3.3. Finance
- 35.3.4. Others
SECTION VIII: OTHER EXCLUSIVE INSIGHTS
36. INSIGHTS FROM PRIMARY RESEARCH
37. REPORT CONCLUSION
SECTION IX: APPENDIX
38. TABULATED DATA
39. LIST OF COMPANIES AND ORGANIZATIONS
40. CUSTOMIZATION OPPORTUNITIES
41. ROOTS SUBSCRIPTION SERVICES
42. AUTHOR DETAILS
 智慧灌溉控制器市场:2026-2032年全球市场预测(依连接方式、产品类型、安装方式、最终用户和销售管道)
 智慧灌溉市场分析及预测(至2035年):按类型、产品类型、服务、技术、组件、应用、设备、最终用户、解决方案划分4G Cat.1智慧控制器市场按产品类型、应用、终端用户产业和销售管道-全球预测(2026-2032年)
 智慧灌溉控制器市场-全球产业规模、份额、趋势、机会和预测,按类型(基于气象条件和基于土壤湿度条件)、应用(非农业和农业)、地区和竞争格局划分,2020-2030年预测
 智慧灌溉系统市场预测至2032年:按组件、灌溉类型、应用、最终用户和地区分類的全球分析
 智慧型喷灌控制器:全球市场份额和排名、总收入和需求预测(2025-2031 年)
 智慧灌溉市场规模、份额和趋势分析报告:按组件、技术、系统、最终用途、地区和细分市场预测(2025-2033 年)
 全球智慧灌溉市场:2025-2030 年预测
 全球智慧灌溉市场(按组件、系统类型、应用和地区划分)- 预测至 2030 年智慧灌溉市场-全球产业规模、份额、趋势、机会和预测(按类型、组件、最终用途、地区和竞争细分,2020-2030 年)