


 |
市场调查报告书
商品编码
1762524
实验室自动化市场:产业趋势和全球预测 - 依自动化阶段、设备类型、应用、最终用户和主要地区Lab Automation Market: Industry Trends and Global Forecasts - Distribution by Stage of Automation, Type of Instrument, Application, End-user and Key Geographical Regions |
||||||
实验室自动化市场:概览
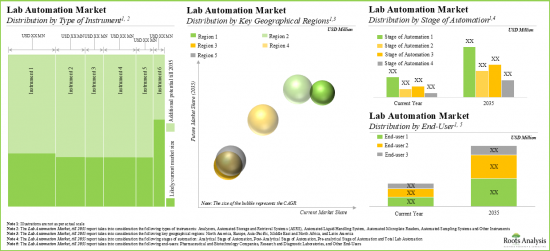
预计到2035年,全球实验室自动化市场规模将从目前的65亿美元成长至 160亿美元,预测期内年复合成长率为 9.4%。
市场区隔根据以下参数划分市场规模与市场机会:
自动化阶段
- 分析前阶段
- 分析阶段
- 分析后阶段
- 实验室全面自动化
装置类型
- 自动化液体处理系统
- 自动化微孔板读数仪
- 自动化取样系统
- 分析仪器
- 自动储存与检索系统(ASRS)
- 其他
应用
- 诊断
- 遗传学实验室解决方案
- 微生物学
- 药物研发
- 蛋白质体学解决方案
- 其他
最终使用者
- 製药和生技公司
- 研究与诊断实验室
- 其他
主要地区
- 北美
- 欧洲
- 亚太地区
- 中东和北非
- 拉丁美洲
实验室自动化市场:成长与趋势
实验室自动化是近年来诊断测试科学领域最重要的趋势之一。实验室自动化始于20 世纪 50年代,目标是减少实验室检测中的人为错误和周转时间。值得注意的是,在所有实验室流程中,人为错误约占分析前错误的30%至 86%。因此,使用机器人代替人类可以有效且快速地消除这些显着的误差。多年来,实验室自动化吸引了研究人员和业内人士的广泛关注。这是因为机器有可能在任何研究或技术领域取代体力劳动。这是因为自动化提高了流程品质,消除了人为错误和差异性,最终使操作更具成本效益、更有效率、更快捷。
此外,鑑于过去十年实验室自动化概念的快速发展,该领域的新技术展现出巨大的潜力。事实上,许多实验室管理人员探索移动机器人领域,以简化重复性任务并提高效率。许多科学家设想开发能够在实验室内独立运输和处理材料的机器人实验室助手。实验室自动化设备(例如自动液体处理系统)具有许多优势,例如简化样品製备,同时保持一致的高精度,使实验室摆脱手动任务,并使其能够处理更多样品,同时保持可重复性。此外,自动储存和检索系统(ASRS)透过消除拾取、储存、组装和补货等任务中的人工需求,降低了营运的变动成本。因此,由于研究力度的加大、先进设备的开发以及各利益相关方的努力,该行业领域在未来有望实现显着成长。
实验室自动化市场:关键洞察
本报告深入探讨了实验室自动化市场的现状,并识别了行业内的潜在成长机会。报告的主要调查结果包括:
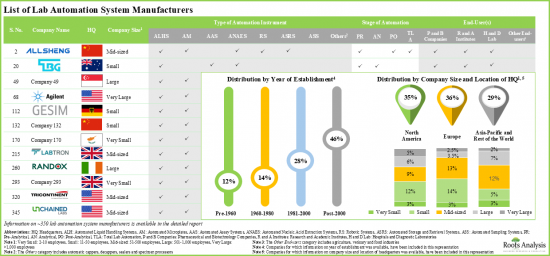
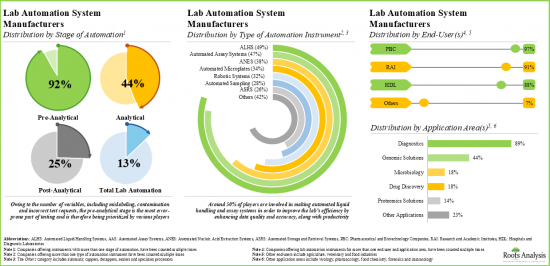
- 超过 90%的实验室自动化系统製造商致力于基于预分析阶段的仪器。其中,ALHS 和 AAS 被製药和生物技术公司广泛采用。
- 为了获得竞争优势,各公司正积极提升现有能力,强化各自的产品组合,并努力遵循不断发展的产业基准。
- 合作活动正以约 25%的年复合成长率成长。事实上,与实验室自动化相关的最大交易都是在过去三年签署的。
- 近期,已有超过 6,200 项与实验室自动化相关的专利被提交/授予,凸显了利益相关者对可扩展和可配置实验室自动化系统日益成长的兴趣。
- 大多数实验室自动化软体供应商的总部都位于北美,规模较小的公司占据了超过 55%的市场。
- 医疗保健产业日益普及的实验室自动化预计将为实验室自动化软体供应商创造丰厚的商机。
- 预计该市场的年复合成长率为 9.4%,且在不同仪器类型、地理、自动化阶段和最终用户方面存在着多样化的机会。
实验室自动化市场:关键细分市场
根据自动化阶段,市场细分为分析前阶段、分析阶段、分析后阶段和实验室整体自动化。目前,分析前阶段占据全球实验室自动化市场的最大占有率。然而,预计在预测期内,整个实验室自动化领域将呈现最高的市场成长。
依设备类型,市场细分为自动化液体处理系统、自动化微孔板读数仪、自动化取样系统、分析仪器、自动化储存和检索系统(ASRS)以及其他设备。目前,自动化液体处理系统领域在全球实验室自动化市场中占有最大占有率。此外,预计在预测期内,分析仪器领域的年复合成长率将更高。
依应用细分,市场细分为诊断、基因组学解决方案、微生物学、药物研发、蛋白质体学解决方案和其他应用。目前,诊断领域在全球实验室自动化市场中占有最大占有率。此外,预计在预测期内,药物研发领域的年复合成长率将更高。
依最终用户细分,市场细分为生物製药行业、研究和学术机构以及其他最终用户。目前,生物技术和製药产业占据全球实验室自动化市场的最大占有率。然而,预计其他终端用户细分市场在预测期内将以更高的年复合成长率成长。
依主要地区划分,市场分为北美、欧洲、亚太地区、中东和北非以及拉丁美洲。目前,北美在全球实验室自动化市场占据主导地位,占据最大的收入占有率。此外,亚太市场未来很可能会以更高的年复合成长率成长。
实验室自动化市场参与者
- Abbott
- Anton Paar
- BD
- Beckman Coulter
- ERWEKA
- Leuze
- Ortho Clinical Diagnostics
- Pall Corporation
- PerkinElmer
- Roche Diagnostics
- Siemens Healthineers
- SYSTAG
目录
第1章 简介
第2章 执行摘要
第3章 简介
- 实验室自动化概述
- 实验室自动化的历史演变
- 实验室自动化阶段
- 实验室自动化流程
- 实验室自动化相对于手作的优势
- 实验室自动化的挑战
- 未来展望
第4章 市场格局
- 实验室自动化系统製造商:市场格局
第5章 竞争分析
第6章 公司简介
- Abbott
- Anton Paar
- BD
- Beckman Coulter
- ERWEKA
- Leuze
- Ortho Clinical Diagnostics
- Pall Corporation
- PerkinElmer
- Roche Diagnostics
- Siemens Healthineers
- SYSTAG
第7章 案例研究:实验室自动化软体
- 实验室自动化软体供应商:市场格局
第8章 伙伴关係与合作
- 合作模式
- 实验室自动化:合作伙伴关係与合作列表
第9章 专利分析
第10章 市场预测与机会分析
- 研究方法与关键假设
- 2035年全球实验室自动化市场
第11章 高层洞察
第12章 附录1:表格资料
第13章 附录2:公司与组织清单
LAB AUTOMATION MARKET: OVERVIEW
As per Roots Analysis, the global lab automation market is estimated to grow from USD 6.5 billion in the current year to USD 16 billion by 2035, at a CAGR of 9.4% during the forecast period, till 2035.
The market sizing and opportunity analysis has been segmented across the following parameters:
Stage of Automation
- Pre-Analytical Stage
- Analytical Stage
- Post-Analytical Stage
- Total Lab Automation
Type of Instrument
- Automated Liquid Handling Systems
- Automated Microplate Readers
- Automated Sampling Systems
- Analyzers
- Automated Storage and Retrieval Systems (ASRS)
- Other Instruments
Application
- Diagnostics
- Genomic Solutions
- Microbiology
- Drug Discovery
- Proteomic Solutions
- Other Applications
End-user
- Pharmaceutical and Biotechnology Companies
- Research and Diagnostic Laboratories
- Other End-users
Key Geographical Regions
- North America
- Europe
- Asia-Pacific
- Middle East and North Africa
- Latin America
LAB AUTOMATION MARKET: GROWTH AND TRENDS
Laboratory automation has been one of the most significant developments in diagnostic laboratory sciences in recent years. The purpose of laboratory automation, which began in the 1950s, is to reduce human error and turnaround time for laboratory testing. It is worth highlighting that human error accounts for approximately 30% to 86% of all pre-analytical mistakes among all laboratory processes. As a result, the implementation of robots in place of humans can effectively and immediately eliminate this significant amount of inaccuracy. Over the years, lab automation has garnered significant interest from researchers as well as from industry players, owing to the potential of machines to replace manual operations in every field of research and technology. This is because automation enhances process quality, eliminates human error and variability, and eventually makes operations more cost-effective, efficient, and quick.
Further, given the rate at which the concept of lab automation has evolved over the last decade, new technologies in this domain have demonstrated enormous potential. In fact, many lab managers are exploring the field of mobile robots as a means to streamline repetitive tasks and enhance efficiency. A robotic lab assistant that can independently transport and handle materials in the lab has been conceptualized by many scientists. Lab automation devices, such as automated liquid handling systems, have several advantages, including the ability to simplify sample preparation while maintaining consistent high accuracy and allowing labs to free up manual labor and run more samples along with maintaining reproducibility. In addition, automated storage and retrieval systems (ASRS) lower down the variable cost of operations by eliminating the need for manual labor for tasks such as picking, storing, assembly and inventory replenishment. Consequently, owing to the growing research efforts, development of advanced instrumentations, and efforts of various stakeholders, this segment of industry is likely to witness noteworthy growth in the foreseen future.
LAB AUTOMATION MARKET: KEY INSIGHTS
The report delves into the current state of the lab automation market and identifies potential growth opportunities within industry. Some key findings from the report include:
- More than 90% of the lab automation system manufacturers are focusing on pre-analytical stage-based instruments; of these, ALHS and AAS have been more widely adopted by pharma and biotech companies.
- In pursuit of gaining a competitive edge, companies are actively enhancing their existing capabilities to strengthen their respective product portfolios and drive compliance to evolving industry benchmarks.
- The partnership activity has increased at a CAGR of around 25%; in fact, the maximum deals related to lab automation have been inked in the last three years.
- More than 6,200 patents related to lab automation have been filed / granted recently, highlighting the growing interest of stakeholders in scalable and configurable lab automation systems.
- Majority of the lab automation software providers are headquartered in North America; more than 55% of the market is captured by small players.
- The increasing adoption of lab automation in the healthcare industry is anticipated to create profitable business opportunities for lab automation software providers.
- The market is estimated to grow at an annualized rate of 9.4%; the opportunity is likely to be well distributed across various types of instruments, geographical regions, stages of automation and end-users.
LAB AUTOMATION MARKET: KEY SEGMENTS
Pre-analytical Stage Segment holds the Largest Share of the Lab Automation Market
Based on the stage of automation, the market is segmented into pre-analytical stage, analytical stage, post-analytical stage and total lab automation. At present, the pre-analytical stage segment holds the maximum share of the global lab automation market. However, the total lab automation segment is expected to show the highest market growth potential during the forecast period.
By Type of Instrument, Analyzers is the Fastest Growing Segment of the Global Lab Automation Market
Based on the type of instrument, the market is segmented into automated liquid handling systems, automated microplate readers, automated sampling systems, analyzers, automated storage and retrieval systems (ASRS), and other instruments. At present, the automated liquid handling systems segment holds the maximum share of the global lab automation market. Further, the market for analyzers segment is expected to grow at a higher CAGR during the forecast period.
By Application, Diagnostics Segment Accounts for the Largest Share of the Global Lab Automation Market
Based on the application, the market is segmented into diagnostics, genomic solutions, microbiology, drug discovery, proteomic solutions and other applications. Currently, the diagnostics segment captures the highest proportion of the global lab automation market. Further, the drug discovery segment is expected to grow at a higher CAGR during the forecast period.
By End-user, Other End-users is the Fastest Growing Segment of the Global Lab Automation Market
Based on the end-user, the market is segmented into biotechnology and pharmaceutical industries, research and academic institutes and other end users. At present, the biotechnology and pharmaceutical industries segment holds the maximum share of the global lab automation market. However, the market for the other end-user segment is expected to grow at a higher CAGR during the forecast period.
North America Accounts for the Largest Share of the Market
Based on key geographical regions, the market is segmented into North America, Europe, Asia-Pacific, Middle East and North Africa, and Latin America. Currently, North America dominates the global lab automation market and accounts for the largest revenue share. Further, the market Asia-Pacific is likely to grow at a higher CAGR in the coming future.
Example Players in the Lab Automation Market
- Abbott
- Anton Paar
- BD
- Beckman Coulter
- ERWEKA
- Leuze
- Ortho Clinical Diagnostics
- Pall Corporation
- PerkinElmer
- Roche Diagnostics
- Siemens Healthineers
- SYSTAG
LYOPHILIZATION SERVICES MARKET: RESEARCH COVERAGE
- Market Sizing and Opportunity Analysis: The report features an in-depth analysis of the global lyophilization services market, focusing on key market segments, including [A] stage of automation, [B] type of instrument, [C] application, [D] end-user and [E] key geographical regions.
- Market Landscape: A comprehensive evaluation of around 350 lab automation system manufacturers, based on several relevant parameters, such as [A] year of establishment, [B] company size, [C] location of headquarters, [D] types of lab automation system(s), [E] stage(s) of automation, [F] application area(s) and [G] end-user(s).
- Company Competitiveness Analysis: A comprehensive competitive analysis of lab automation system manufacturers, examining factors, such as [A] company strength, [B] product diversity and [BC] portfolio strength.
- Company Profiles: In-depth profiles of key players that are currently engaged in the development of lab automation systems across North America, Europe and Asia-Pacific and Rest of the World, focusing on [A] overview of the company, [B] financial information (if available), [C] product portfolio and [D] recent developments and an informed future outlook.
- Partnerships and Collaborations: An insightful analysis of the deals inked by stakeholders in this domain, based on several parameters, such as [A] year of partnership, [B] type of partnership, [C] type of partner, [D] type of automation instrument(s), [E] most active players (in terms of number of partnerships) and [F] regional distribution of partnership activity.
- Patent Analysis: An in-depth analysis of patents filed / granted till date related to lab automation, based on various relevant parameters, such as [A] patent publication year, [B] type of patent, [C] patent jurisdiction, [D] CPC symbols, [E] type of applicant, [F] emerging focus areas and [G] leading players (in terms of number of patents filled / granted), [H] leading individual assignees, [I] benchmarking analysis and [J] patent valuation.
- Case Study: A detailed discussion on the lab automation software providers, based on various parameters, such as [A] year of establishment, [B] company size, [C] location of headquarters, [D] type of software, [E] mode(s) of deployment and [F] end-user(s).
KEY QUESTIONS ANSWERED IN THIS REPORT
- How many companies are currently engaged in this market?
- Which are the leading companies in this market?
- What factors are likely to influence the evolution of this market?
- What is the current and future market size?
- What is the CAGR of this market?
- How is the current and future market opportunity likely to be distributed across key market segments?
REASONS TO BUY THIS REPORT
- The report provides a comprehensive market analysis, offering detailed revenue projections of the overall market and its specific sub-segments. This information is valuable to both established market leaders and emerging entrants.
- Stakeholders can leverage the report to gain a deeper understanding of the competitive dynamics within the market. By analyzing the competitive landscape, businesses can make informed decisions to optimize their market positioning and develop effective go-to-market strategies.
- The report offers stakeholders a comprehensive overview of the market, including key drivers, barriers, opportunities, and challenges. This information empowers stakeholders to stay abreast of market trends and make data-driven decisions to capitalize on growth prospects.
ADDITIONAL BENEFITS
- Complimentary Excel Data Packs for all Analytical Modules in the Report
- 15% Free Content Customization
- Detailed Report Walkthrough Session with Research Team
- Free Updated report if the report is 6-12 months old or older
TABLE OF CONTENTS
1. PREFACE
- 1.1. Scope of the Report
- 1.2. Research Methodology
- 1.2.1. Research Assumptions
- 1.2.2. Project Methodology
- 1.2.3. Forecast Methodology
- 1.2.4. Robust Quality Control
- 1.2.5. Key Considerations
- 1.2.5.1. Demographics
- 1.2.5.2. Economic Factors
- 1.2.5.3. Government Regulations
- 1.2.5.4. Supply Chain
- 1.2.5.5. COVID Impact / Related Factors
- 1.2.5.6. Market Access
- 1.2.5.7. Healthcare Policies
- 1.2.5.8. Industry Consolidation
- 1.3 Key Questions Answered
- 1.4. Chapter Outlines
2. EXECUTIVE SUMMARY
3. INTRODUCTION
- 3.1. Overview of Lab Automation
- 3.2. Historical Evolution of Lab Automation
- 3.3. Stages of Lab Automation
- 3.4. Process of Lab Automation
- 3.5. Advantages of Lab Automation Over Manual Handling
- 3.6. Challenges associated with Lab Automation
- 3.7. Future Perspectives
4. MARKET LANDSCAPE
- 4.1. Lab Automation System Manufacturers: Overall Market Landscape
- 4.1.1. Analysis by Year of Establishment
- 4.1.2. Analysis by Company Size
- 4.1.3. Analysis by Location of Headquarters
- 4.1.4. Analysis by Company Size and Location of Headquarters
- 4.1.5. Analysis by Type of Lab Automation System(s)
- 4.1.6. Analysis by Type of Automated Liquid Handler(s)
- 4.1.7. Analysis by Type of Automated Microplate(s)
- 4.1.8. Analysis by Stage(s) of Automation
- 4.1.9. Analysis by Application Area(s)
- 4.1.10. Analysis by Type of Lab Automation System(s) and Application Area(s)
- 4.1.11. Analysis by End-user(s)
- 4.1.12. Analysis by Stage(s) of Automation and End-user(s)
5. COMPANY COMPETITIVENESS ANALYSIS
- 5.1. Assumptions and Key Parameters
- 5.2. Methodology
- 5.3. Competitiveness Analysis: Very Small Companies based in North America (Peer Group I)
- 5.4. Competitiveness Analysis: Small Companies based in North America (Peer Group II)
- 5.5 Competitiveness Analysis: Mid-sized Players based in North America (Peer Group III)
- 5.6. Competitiveness Analysis: Large Companies based in North America (Peer Group IV)
- 5.7. Competitiveness Analysis: Very Large Companies based in North America (Peer Group V)
- 5.8 Competitiveness Analysis: Very Small Companies based in Europe (Peer Group VI)
- 5.9. Competitiveness Analysis: Small Companies based in Europe (Peer Group VII)
- 5.10. Competitiveness Analysis: Mid-sized Companies based in Europe (Peer Group VII)
- 5.11. Competitiveness Analysis: Large Companies based in Europe (Peer Group IX)
- 5.12. Competitiveness Analysis: Very Large Companies based in Europe (Peer Group X)
- 5.13. Competitiveness Analysis: Very Small Companies based in Asia-Pacific and Rest of the World (Peer Group XI)
- 5.14. Competitiveness Analysis: Small Companies based in Asia-Pacific and Rest of the World (Peer Group XII)
- 5.15. Competitiveness Analysis: Mid-sized Companies based in Asia-Pacific and Rest of the World (Peer Group XIII)
- 5.16. Competitiveness Analysis: Large Companies based in Asia-Pacific and Rest of the World (Peer Group XIV)
- 5.17. Competitiveness Analysis: Very Large Companies based in Asia-Pacific and Rest of the World (Peer Group XV)
6. COMPANY PROFILES
- 6.1. Abbott
- 6.1.1. Company Overview
- 6.1.2. Financial Information
- 6.1.3. Lab Automation Product Portfolio
- 6.1.4. Recent Developments and Future Outlook
- 6.2. Anton Paar
- 6.2.1. Company Overview
- 6.2.2. Financial Information
- 6.2.3. Lab Automation Product Portfolio
- 6.2.4. Recent Developments and Future Outlook
- 6.3. BD
- 6.3.1. Company Overview
- 6.3.2. Financial Information
- 6.3.3. Lab Automation Product Portfolio
- 6.3.4. Recent Developments and Future Outlook
- 6.4. Beckman Coulter
- 6.4.1. Company Overview
- 6.4.2. Financial Information
- 6.4.3. Lab Automation Product Portfolio
- 6.4.4. Recent Developments and Future Outlook
- 6.5. ERWEKA
- 6.5.1. Company Overview
- 6.5.2. Financial Information
- 6.5.3. Lab Automation Product Portfolio
- 6.5.4. Recent Developments and Future Outlook
- 6.6. Leuze
- 6.6.1. Company Overview
- 6.6.2. Financial Information
- 6.6.3. Lab Automation Product Portfolio
- 6.6.4. Recent Developments and Future Outlook
- 6.7. Ortho Clinical Diagnostics
- 6.7.1. Company Overview
- 6.7.2. Financial Information
- 6.7.3. Lab Automation Product Portfolio
- 6.7.4. Recent Developments and Future Outlook
- 6.8. Pall Corporation
- 6.8.1. Company Overview
- 6.8.2. Financial Information
- 6.8.3. Lab Automation Product Portfolio
- 6.8.4. Recent Developments and Future Outlook
- 6.9. PerkinElmer
- 6.9.1. Company Overview
- 6.9.2. Financial Information
- 6.9.3. Lab Automation Product Portfolio
- 6.9.4. Recent Developments and Future Outlook
- 6.10. Roche Diagnostics
- 6.10.1. Company Overview
- 6.10.2. Financial Information
- 6.10.3. Lab Automation Product Portfolio
- 6.10.4. Recent Developments and Future Outlook
- 6.11. Siemens Healthineers
- 6.11.1. Company Overview
- 6.11.2. Financial Information
- 6.11.3. Lab Automation Product Portfolio
- 6.11.4. Recent Developments and Future Outlook
- 6.12. SYSTAG
- 6.12.1. Company Overview
- 6.12.2. Financial Information
- 6.12.3. Lab Automation Product Portfolio
- 6.12.4. Recent Developments and Future Outlook
7. CASE STUDY: LAB AUTOMATION SOFTWARE
- 7.1. Lab Automation Software Providers: Overall Market Landscape
- 7.1.1. Analysis by Year of Establishment
- 7.1.2. Analysis by Company Size
- 7.1.3. Analysis by Location of Headquarters
- 7.1.4. Analysis by Company Size and Location of Headquarters
- 7.1.5. Analysis by Type of Software
- 7.1.6. Analysis by Mode(s) of Deployment
- 7.1.7. Analysis by Type of Software and Mode(s) of Deployment
- 7.1.8. Analysis by End-user(s)
- 7.1.9. Analysis by Type of Software and End-user(s)
8. PARTNERSHIPS AND COLLABORATIONS
- 8.1. Partnership Models
- 8.2. Lab Automation: List of Partnerships and Collaborations
- 8.2.1. Analysis by Year of Partnership
- 8.2.2. Analysis by Type of Partnership
- 8.2.3. Analysis by Year and Type of Partnership
- 8.2.4. Analysis by Type of Partner
- 8.2.5. Analysis by Year of Partnership and Type of Partner
- 8.2.6. Analysis by Type of Partnership and Type of Partner
- 8.2.7. Analysis by Type of Automation Instrument(s)
- 8.2.8. Analysis by Type of Partnership and Automation Instrument(s)
- 8.2.9. Most Active Players: Analysis by Number of Partnerships
- 8.2.10. Analysis by Geography
- 8.2.10.1. Local and International Agreements
- 8.2.10.2. Intracontinental and Intercontinental Agreements
9. PATENT ANALYSIS
- 9.1. Methodology and Key Parameters
- 9.2. Lab Automation: List of Patents
- 9.3. Analysis by Patent Publication Year
- 9.4. Analysis by Publication Year and Type of Patent
- 9.5. Analysis by Application Year
- 9.6. Analysis by Patent Jurisdiction
- 9.7. Analysis by CPC Symbols
- 9.8. Analysis by Type of Applicant
- 9.9. Word Cloud: Emerging Focus Areas
- 9.10. Analysis by Patent Age
- 9.11. Leading Industry Players: Analysis by Number of Patents
- 9.12. Leading Non-Industry Players: Analysis by Number of Patents
- 9.13. Leading Individual Assignees: Analysis by Number of Patents
- 9.14. Patent Benchmarking: Analysis of Leading Industry Players by Patent Characterization (CPC Symbols)
- 9.15. Patent Valuation: Methodology and Key Parameters
- 9.15.1. Analysis by Relative Patent Valuation
10. MARKET FORECAST AND OPPORTUNITY ANALYSIS
- 10.1. Methodology and Key Assumptions
- 10.2. Global Lab Automation Market, Till 2035
- 10.2.1. Lab Automation Market: Distribution by Stage of Automation
- 10.2.1.1. Lab Automation Market for Pre-analytical Stage, Till 2035
- 10.2.1.2. Lab Automation Market for Analytical Stage, Till 2035
- 10.2.1.3. Lab Automation Market for Post-analytical Stage, Till 2035
- 10.2.1.4. Lab Automation Market for Total Lab Automation, Till 2035
- 10.2.2. Lab Automation Market: Distribution by Type of Instrument
- 10.2.2.1. Lab Automation Market for Automated Liquid Handling Systems, Till 2035
- 10.2.2.2. Lab Automation Market for Automated Microplate Readers, Till 2035
- 10.2.2.3. Lab Automation Market for Automated Sampling Systems, Till 2035
- 10.2.2.4. Lab Automation Market for Analyzers, Till 2035
- 10.2.2.5. Lab Automation Market for Automated Storage and Retrieval Systems (ASRS), Till 2035
- 10.2.2.6. Lab Automation Market for Other Instruments, Till 2035
- 10.2.3. Lab Automation Market: Distribution by Application
- 10.2.3.1. Lab Automation Market for Diagnostics, Till 2035
- 10.2.3.2. Lab Automation Market for Genomic Solutions, Till 2035
- 10.2.3.3. Lab Automation Market for Microbiology, Till 2035
- 10.2.3.4. Lab Automation Market for Drug Discovery, Till 2035
- 10.2.3.5. Lab Automation Market for Proteomic Solutions, Till 2035
- 10.2.3.6. Lab Automation Market for Other Applications, Till 2035
- 10.2.4. Lab Automation Market: Distribution by End-user
- 10.2.4.1. Lab Automation Market for Research and Diagnostic Laboratories, Till 2035
- 10.2.4.2. Lab Automation Market for Biotechnology and Pharmaceutical Industries, Till 2035
- 10.2.4.3. Lab Automation Market for Other End-users, Till 2035
- 10.2.5. Lab Automation Market: Distribution by Key Geographical Regions
- 10.2.5.1. Lab Automation Market in North America, Till 2035
- 10.2.5.2. Lab Automation Market in Europe, Till 2035
- 10.2.5.3. Lab Automation Market in Asia-Pacific, Till 2035
- 10.2.5.4. Lab Automation Market in Middle East and North Africa, Till 2035
- 10.2.5.5. Lab Automation Market in Latin America, Till 2035
- 10.2.1. Lab Automation Market: Distribution by Stage of Automation
11. EXECUTIVE INSIGHTS
- 11.1. Chapter Overview
- 11.2. Company A
- 11.2.1. Company Overview
- 11.2.2. Interview Transcript: Production and Supply Management Lead
- 11.3. Company B
- 11.3.1. Company Overview
- 11.3.2. Interview Transcript: Chief Executive Officer
- 11.4. Company C
- 11.4.1. Company Overview
- 11.4.2. Interview Transcript: Anonymous
- 11.5. Company D
- 11.5.1. Company Overview
- 11.5.2. Interview Transcript: Project Manager and Business Development
- 11.6. Company E
- 11.6.1. Company Overview
- 11.6.2. Interview Transcript: Chief Commercial Officer
- 11.7. Company F
- 11.7.1. Company Overview
- 11.7.2. Interview Transcript: Account Manager
- 11.8. Company G
- 11.8.1. Company Overview
- 11.8.2. Interview Transcript: Sales Manager
- 11.9. Company H
- 11.9.1. Company Overview
- 11.9.2. Interview Transcript: Co-Founder and Co-Chief Executive Officer
12. APPENDIX I: TABULATED DATA
13. APPENDIX II: LIST OF COMPANIES AND ORGANIZATIONS
List of Tables
- Table 4.1 Lab Automation System Manufacturers: Information on Year of Establishment, Company Size and Location of Headquarters
- Table 4.2 Lab Automation System Manufacturers: Information on Type of Automated Instrument(s)
- Table 4.3 Lab Automation System Manufacturers: Information on Stage(s) of Automation, Application Area(s) and End-user(s)
- Table 6.1 Abbott: Lab Automation Products
- Table 6.2 Abbott: Recent Developments and Future Outlook
- Table 6.3 Anton Paar: Lab Automation Products
- Table 6.4 Anton Paar: Future Outlook
- Table 6.5 BD: Lab Automation Products
- Table 6.6 BD: Recent Developments and Future Outlook
- Table 6.7 Beckman Coulter: Lab Automation Products
- Table 6.8 Beckman Coulter: Recent Developments and Future Outlook
- Table 6.9 ERWEKA: Lab Automation Products
- Table 6.10 ERWEKA: Recent Developments and Future Outlook
- Table 6.11 Leuze: Lab Automation Products
- Table 6.12 Leuze: Recent Developments and Future Outlook
- Table 6.13 Ortho Clinical Diagnostics: Lab Automation Products
- Table 6.14 Ortho Clinical Diagnostics: Recent Developments and Future Outlook
- Table 6.15 Pall Corporation: Lab Automation Products
- Table 6.16 Pall Corporation: Recent Developments and Future Outlook
- Table 6.17 PerkinElmer: Lab Automation Products
- Table 6.18 PerkinElmer: Recent Developments and Future Outlook
- Table 6.19 Roche Diagnostics: Lab Automation Products
- Table 6.20 Roche Diagnostics: Recent Developments and Future Outlook
- Table 6.21 Siemens Healthineers: Lab Automation Products
- Table 6.22 Siemens Healthineers: Recent Developments and Future Outlook
- Table 6.23 SYSTAG: Lab Automation Products
- Table 6.24 SYSTAG: Recent Developments and Future Outlook
- Table 7.1 Lab Automation Software Providers: Information on Location of Headquarters, Company Size, Type of Software, Mode(s) of Deployment and End-User(s)
- Table 8.1 Lab Automation: List of Partnerships and Collaborations
- Table 9.1 Lab Automation: List of Filed / Granted Patents
- Table 9.2 Patent Analysis: Categorization based on Weighted Valuation Scores
- Table 12.1 Lab Automation System Manufacturers: Distribution by Year of Establishment
- Table 12.2 Lab Automation System Manufacturers: Distribution by Company Size
- Table 12.3 Lab Automation System Manufacturers: Distribution by Location of Headquarters (Region-wise)
- Table 12.4 Lab Automation System Manufacturers: Distribution by Location of Headquarters (Country-wise)
- Table 12.5 Lab Automation System Manufacturers: Distribution by Company Size and Location of Headquarters (Region-wise)
- Table 12.6 Lab Automation System Manufacturers: Distribution by Type of Lab Automation system(s)
- Table 12.7 Lab Automation System Manufacturers: Distribution by Type of Automated Liquid Handling System(s)
- Table 12.8 Lab Automation System Manufacturers: Distribution by Type of Automated Microplate(s)
- Table 12.9 Lab Automation System Manufacturers: Distribution by Stage(s) of Automation
- Table 12.10 Lab Automation System Manufacturers: Distribution by Application Area(s)
- Table 12.11 Lab Automation System Manufacturers: Distribution by Type of Lab Automation System(s) and Application Area(s)
- Table 12.12 Lab Automation System Manufacturers: Distribution by End-user(s)
- Table 12.13 Lab Automation System Manufacturers: Distribution by Stage(s) of Automation and End-user(s)
- Table 12.14 Abbott: Annual Revenues, Since FY 2018 (USD Billion)
- Table 12.15 BD: Annual Revenues, Since FY 2018 (USD Billion)
- Table 12.16 Danaher (parent company of Beckman Coulter): Annual Revenues, Since FY 2018 (USD Billion)
- Table 12.17 Ortho Clinical Diagnostics: Annual Revenues, Since FY 2019 (USD Billion)
- Table 12.18 Danaher (parent company of Pall Corporation): Annual Revenues, Since FY 2018 (USD Billion)
- Table 12.19 PerkinElmer: Annual Revenues, Since FY 2018 (USD Billion)
- Table 12.20 Roche Diagnostics: Annual Revenues, Since FY 2018 (CHF Billion)
- Table 12.21 Siemens Healthineers: Annual Revenues, Since FY 2018 (USD Billion)
- Table 12.22 Lab Automation Software Providers: Distribution by Year of Establishment
- Table 12.23 Lab Automation Software Providers: Distribution by Company Size
- Table 12.24 Lab Automation Software Providers: Distribution by Location of Headquarters (Region-wise)
- Table 12.25 Lab Automation Software Providers: Distribution by Location of Headquarters (Country-wise)
- Table 12.26 Lab Automation Software Providers: Distribution by Company Size and Location of Headquarters (Region-wise)
- Table 12.27 Lab Automation Software Providers: Distribution by Type of Software
- Table 12.28 Lab Automation Software Providers: Distribution by Mode(s) of Deployment
- Table 12.29 Lab Automation Software Providers: Distribution by Type of Software and Mode(s) of Deployment
- Table 12.30 Lab Automation Software Providers: Distribution by End-user(s)
- Table 12.31 Lab Automation Software Providers: Distribution by Type of Software and End-user(s)
- Table 12.32 Partnerships and Collaborations: Distribution by Year of Partnership
- Table 12.33 Partnerships and Collaborations: Distribution by Type of Partnership
- Table 12.34 Partnerships and Collaborations: Distribution by Year and Type of Partnership
- Table 12.35 Partnerships and Collaborations: Distribution by Type of Partner
- Table 12.36 Partnerships and Collaborations: Distribution by Year of Partnership and Type of Partner
- Table 12.37 Partnerships and Collaborations: Distribution by Type of Partnership and Type of Partner
- Table 12.38 Partnerships and Collaborations: Distribution by Type of Automation Instrument(s)
- Table 12.39 Most Active Players: Distribution by Number of Partnerships
- Table 12.40 Partnerships and Collaborations: Local and International Agreements
- Table 12.41 Partnerships and Collaborations: Intercontinental and Intracontinental Agreements
- Table 12.42 Patent Analysis: Distribution by Patent Publication Year
- Table 12.43 Patent Analysis: Distribution by Publication Year and Type of Patent
- Table 12.44 Patent Analysis: Distribution by Application Year
- Table 12.45 Patent Analysis: Distribution by Patent Jurisdiction
- Table 12.46 Patent Analysis: Distribution in Asia-Pacific and Rest of the World
- Table 12.47 Patent Analysis: Distribution of Patents in China by Type of Applicant
- Table 12.48 Patent Analysis: List of Top CPC Symbols
- Table 12.49 Patent Analysis: Cumulative Distribution by Type of Applicant
- Table 12.50 Patent Analysis: Distribution by Patent Age
- Table 12.51 Leading Industry Players: Distribution by Number of Patents
- Table 12.52 Leading Non-Industry Players: Distribution by Number of Patents
- Table 12.53 Leading Individual Assignees: Distribution by Number of Patents
- Table 12.54 Patent Valuation: Distribution by Relative Patent Valuation
- Table 12.55 Global Lab Automation Market: Conservative, Base and Optimistic Scenarios, Till 2035 (USD Billion)
- Table 12.56 Lab Automation Market: Distribution by Stage of Automation
- Table 12.57 Lab Automation Market for Pre-analytical Stage: Conservative, Base and Optimistic Scenarios, Till 2035 (USD Million)
- Table 12.58 Lab Automation Market for Analytical Stage: Conservative, Base and Optimistic Scenarios, Till 2035 (USD Million)
- Table 12.59 Lab Automation Market for Post-analytical Stage: Conservative, Base and Optimistic Scenarios, Till 2035 (USD Million)
- Table 12.60 Lab Automation Market for Total Lab Automation: Conservative, Base and Optimistic Scenarios, Till 2035 (USD Million)
- Table 12.61 Lab Automation Market: Distribution by Type of Instrument
- Table 12.62 Lab Automation Market for Automated Liquid Handling Systems: Conservative, Base and Optimistic Scenarios, Till 2035 (USD Million)
- Table 12.63 Lab Automation Market for Automated Microplate Readers: Conservative, Base and Optimistic Scenarios, Till 2035 (USD Million)
- Table 12.64 Lab Automation Market for Automated Sampling Systems: Conservative, Base and Optimistic Scenarios, Till 2035 (USD Million)
- Table 12.65 Lab Automation Market for Analyzers: Conservative, Base and Optimistic Scenarios, Till 2035 (USD Million)
- Table 12.66 Lab Automation Market for Automated Storage and Retrieval Systems (ASRS): Conservative, Base and Optimistic Scenarios, Till 2035 (USD Million)
- Table 12.67 Lab Automation Market for Other Instruments: Conservative, Base and Optimistic Scenarios, Till 2035 (USD Million)
- Table 12.68 Lab Automation Market: Distribution by Application
- Table 12.69 Lab Automation Market for Diagnostics: Conservative, Base and Optimistic Scenarios, Till 2035 (USD Million)
- Table 12.70 Lab Automation Market for Genomic Solutions: Conservative, Base and Optimistic Scenarios, Till 2035 (USD Million)
- Table 12.71 Lab Automation Market for Microbiology: Conservative, Base and Optimistic Scenarios, Till 2035 (USD Million)
- Table 12.72 Lab Automation Market for Drug Discovery: Conservative, Base and Optimistic Scenarios, Till 2035 (USD Million)
- Table 12.73 Lab Automation Market for Proteomic Solutions: Conservative, Base and Optimistic Scenarios, Till 2035 (USD Million)
- Table 12.74 Lab Automation Market for Other Applications: Conservative, Base and Optimistic Scenarios, Till 2035 (USD Million)
- Table 12.75 Lab Automation Market: Distribution by End-user
- Table 12.76 Lab Automation Market for Research and Diagnostic Laboratories: Conservative, Base and Optimistic Scenarios, Till 2035 (USD Million)
- Table 12.77 Lab Automation Market for Biotechnology and Pharmaceutical Industries: Conservative, Base and Optimistic Scenarios, Till 2035 (USD Million)
- Table 12.78 Lab Automation Market for Other End-users: Conservative, Base and Optimistic Scenarios, Till 2035 (USD Million)
- Table 12.79 Lab Automation Market: Distribution by Key Geographical Regions
- Table 12.80 Lab Automation Market in North America: Conservative, Base and Optimistic Scenarios, Till 2035 (USD Million)
- Table 12.81 Lab Automation Market in Europe: Conservative, Base and Optimistic Scenarios, Till 2035 (USD Million)
- Table 12.82 Lab Automation Market in Asia-Pacific: Conservative, Base and Optimistic Scenarios, Till 2035 (USD Million)
- Table 12.83 Lab Automation Market in Middle East and North Africa: Conservative, Base and Optimistic Scenarios, Till 2035 (USD Million)
- Table 12.84 Lab Automation Market in Latin America: Conservative, Base and Optimistic Scenarios, Till 2035 (USD Million)
List of Figures
- Figure 2.1 Executive Summary: Overall Market Landscape of Lab Automation System Manufacturers
- Figure 2.2 Executive Summary: Partnerships and Collaborations
- Figure 2.3 Executive Summary: Patent Analysis
- Figure 2.4 Executive Summary: Market Forecast and Opportunity Analysis
- Figure 3.1 Historical Evolution of Lab Automation
- Figure 3.2 Process Involved in Lab Automation
- Figure 3.3 Advantages of Lab Automation Over Manual Handling
- Figure 4.1 Lab Automation System Manufacturers: Distribution by Year of Establishment
- Figure 4.2 Lab Automation System Manufacturers: Distribution by Company Size
- Figure 4.3 Lab Automation System Manufacturers: Distribution by Location of Headquarters (Region-wise)
- Figure 4.4 Lab Automation System Manufacturers: Distribution by Location of Headquarters (Country-wise)
- Figure 4.5 Lab Automation System Manufacturers: Distribution by Company Size and Location of Headquarters (Region-wise)
- Figure 4.6 Lab Automation System Manufacturers: Distribution by Type of Lab Automation System(s)
- Figure 4.7 Lab Automation System Manufacturers: Distribution by Type of Automated Liquid Handling System(s)
- Figure 4.8 Lab Automation System Manufacturers: Distribution by Type of Automated Microplate(s)
- Figure 4.9 Lab Automation System Manufacturers: Distribution by Stage(s) of Automation
- Figure 4.10 Lab Automation System Manufacturers: Distribution by Application Area(s)
- Figure 4.11 Lab Automation System Manufacturers: Distribution by Type of Lab Automation system(s) and Application Area(s)
- Figure 4.12 Lab Automation System Manufacturers: Distribution by End-user(s)
- Figure 4.13 Lab Automation System Manufacturers: Distribution by Stage(s) of Automation and End-user(s)
- Figure 5.1 Company Competitiveness Analysis: Very Small Companies based in North America (Peer Group I)
- Figure 5.2 Company Competitiveness Analysis: Small Companies based in North America (Peer Group II)
- Figure 5.3 Company Competitiveness Analysis: Mid-sized Players based in North America (Peer Group III)
- Figure 5.4 Company Competitiveness Analysis: Large Companies based in North America (Peer Group IV)
- Figure 5.5 Company Competitiveness Analysis: Very Large Companies based in North America (Peer Group V)
- Figure 5.6 Company Competitiveness Analysis: Very Small Companies based in Europe (Peer Group VI)
- Figure 5.7 Company Competitiveness Analysis: Small Companies based in Europe (Peer Group VII)
- Figure 5.8 Company Competitiveness Analysis: Mid-sized Companies based in Europe (Peer Group VIII)
- Figure 5.9 Company Competitiveness Analysis: Large Companies based in Europe (Peer Group IX)
- Figure 5.10 Company Competitiveness Analysis: Very Large Companies based in Europe (Peer Group X)
- Figure 5.11 Company Competitiveness Analysis: Very Small Companies based in Asia-Pacific and Rest of the World (Peer Group XI)
- Figure 5.12 Company Competitiveness Analysis: Small Companies based in Asia-Pacific and Rest of the World (Peer Group XII)
- Figure 5.13 Company Competitiveness Analysis: Mid-sized Companies based in Asia-Pacific and Rest of the World (Peer Group XIII)
- Figure 5.14 Company Competitiveness Analysis: Large Companies based in Asia-Pacific and Rest of the World (Peer Group XIV)
- Figure 5.15 Company Competitiveness Analysis: Very Large Companies based in Asia-Pacific and Rest of the World (Peer Group XV)
- Figure 6.1 Abbott: Annual Revenues, Since 2018 (USD Billion)
- Figure 6.2 Abbott: Product Portfolio
- Figure 6.3 Anton Paar: Product Portfolio
- Figure 6.4 BD: Annual Revenues, Since FY 2018 (USD Billion)
- Figure 6.5 BD: Product Portfolio
- Figure 6.6 Danaher (Parent Company of Beckman Coulter): Annual Revenues, Since FY 2018 (USD Billion)
- Figure 6.7 Beckman Coulter: Product Portfolio
- Figure 6.8 ERWEKA: Product Portfolio
- Figure 6.9 Leuze: Product Portfolio
- Figure 6.10 Ortho Clinical Diagnostics: Annual Revenues, Since FY 2019 (USD Billion)
- Figure 6.11 Ortho Clinical Diagnostics: Product Portfolio
- Figure 6.12 Danaher (Parent Company of Pall Corporation): Annual Revenues, Since FY 2018 (USD Billion)
- Figure 6.13 Pall Corporation: Product Portfolio
- Figure 6.14 PerkinElmer: Annual Revenues, Since FY 2018 (USD Billion)
- Figure 6.15 PerkinElmer: Product Portfolio
- Figure 6.16 Roche Diagnostics: Annual Revenues, Since FY 2018 (CHF Billion)
- Figure 6.17 Roche Diagnostics: Product Portfolio
- Figure 6.18 Siemens Healthineers: Annual Revenues, Since FY 2018 (Euro Billion)
- Figure 6.19 Siemens Healthineers: Product Portfolio
- Figure 6.20 SYSTAG: Product Portfolio
- Figure 7.1 Lab Automation Software Providers: Distribution by Year of Establishment
- Figure 7.2 Lab Automation Software Providers: Distribution by Company Size
- Figure 7.3 Lab Automation Software Providers: Distribution by Location of Headquarters (Region-wise)
- Figure 7.4 Lab Automation Software Providers: Distribution by Location of Headquarters (Country-wise)
- Figure 7.5 Lab Automation Software Providers: Distribution by Company Size and Location of Headquarters (Region-wise)
- Figure 7.6 Lab Automation Software Providers: Distribution by Type of Software
- Figure 7.7 Lab Automation Software Providers: Distribution by Mode(s) of Deployment
- Figure 7.8 Lab Automation Software Providers: Distribution by Type of Software and Mode(s) of Deployment
- Figure 7.9 Lab Automation Software Providers: Distribution by End-user(s)
- Figure 7.10 Lab Automation Software Providers: Distribution by Type of Software and End-user(s)
- Figure 8.1 Partnerships and Collaborations: Distribution by Year of Partnership
- Figure 8.2 Partnerships and Collaborations: Distribution by Type of Partnership
- Figure 8.3 Partnerships and Collaborations: Distribution by Year and Type of Partnership
- Figure 8.4 Partnerships and Collaborations: Distribution by Type of Partner
- Figure 8.5 Partnerships and Collaborations: Distribution by Year of Partnership and Type of Partner
- Figure 8.6 Partnerships and Collaborations: Distribution by Type of Partnership and Type of Partner
- Figure 8.7 Partnerships and Collaborations: Distribution by Type of Automation Instrument(s) Used
- Figure 8.8 Most Active Players: Distribution by Number of Partnerships
- Figure 8.9 Partnerships and Collaborations: Local and International Agreements
- Figure 8.10 Partnerships and Collaborations: Intercontinental and Intracontinental Agreements
- Figure 9.1 Patent Analysis: Distribution by Patent Publication Year
- Figure 9.2 Patent Analysis: Distribution by Publication Year and Type of Patent
- Figure 9.3 Patent Analysis: Distribution by Application Year
- Figure 9.4 Patent Analysis: Distribution by Patent Jurisdiction
- Figure 9.5 Patent Analysis: Distribution by CPC Symbols
- Figure 9.6 Patent Analysis: Cumulative Distribution by Type of Applicant
- Figure 9.7 Word Cloud: Emerging Focus Areas
- Figure 9.8 Patent Analysis: Distribution by Patent Age
- Figure 9.9 Leading Industry Players: Distribution by Number of Patents
- Figure 9.10 Leading Non-Industry Players: Distribution by Number of Patents
- Figure 9.11 Leading Individual Assignees: Distribution by Number of Patents
- Figure 9.12 Patent Benchmarking: Distribution of Leading Industry Players by Patent Characterization (CPC Symbols)
- Figure 9.13 Patent Valuation: Distribution by Relative Patent Valuation
- Figure 10.1. Global Lab Automation Market, Till 2035 (USD Billion)
- Figure 10.2. Global Lab Automation Market: Distribution by Stage of Automation
- Figure 10.3. Lab Automation Market for Pre-analytical Stage, Till 2035 (USD Million)
- Figure 10.4. Lab Automation Market for Analytical Stage, Till 2035 (USD Million)
- Figure 10.5. Lab Automation Market for Post-analytical Stage, Till 2035 (USD Million)
- Figure 10.6. Lab Automation Market for Total Lab Automation, Till 2035 (USD Million)
- Figure 10.7. GlobalLab Automation Market: Distribution by Type of Instrument
- Figure 10.8. Lab Automation Market for Automated Liquid Handling Systems, Till 2035 (USD Million)
- Figure 10.9. Lab Automation Market for Automated Microplate Readers, Till 2035 (USD Million)
- Figure 10.10. Lab Automation Market for Automated Sampling Systems, Till 2035 (USD Million)
- Figure 10.11. Lab Automation Market for Analyzers, Till 2035 (USD Million)
- Figure 10.12. Lab Automation Market for Automated Storage and Retrieval Systems (ASRS), Till 2035 (USD Million)
- Figure 10.13. Lab Automation Market for Other Instruments, Till 2035 (USD Million)
- Figure 10.14. GlobalLab Automation Market: Distribution by Application
- Figure 10.15. Lab Automation Market for Diagnostics, Till 2035 (USD Million)
- Figure 10.16. Lab Automation Market for Genomic Solutions, Till 2035 (USD Million)
- Figure 10.17. Lab Automation Market for Microbiology, Till 2035 (USD Million)
- Figure 10.18. Lab Automation Market for Drug Discovery, Till 2035 (USD Million)
- Figure 10.19. Lab Automation Market for Proteomic Solutions, Till 2035 (USD Million)
- Figure 10.20. Lab Automation Market for Other Applications, Till 2035 (USD Million)
- Figure 10.21. Global Lab Automation Market: Distribution by End-user
- Figure 10.22. Lab Automation Market for Research and Diagnostic Laboratories, Till 2035 (USD Million)
- Figure 10.23. Lab Automation Market for Biotechnology and Pharmaceutical Industries, Till 2035 (USD Million)
- Figure 10.24. Lab Automation Market for Other End-users, Till 2035 (USD Million)
- Figure 10.25. Global Lab Automation Market: Distribution by Key Geographical Regions
- Figure 10.26. Lab Automation Market in North America, Till 2035 (USD Million)
- Figure 10.27. Lab Automation Market in Europe, Till 2035 (USD Million)
- Figure 10.28. Lab Automation Market in Asia-Pacific, Till 2035 (USD Million)
- Figure 10.29. Lab Automation Market in Middle East and North Africa, Till 2035 (USD Million)
- Figure 10.30. Lab Automation Market in Latin America, Till 2035 (USD Million)
 分析化学样品製备市场-全球产业规模、份额、趋势、机会和预测,按技术、产品、应用、最终用途、地区和竞争细分,2020-2030F
 基因组学实验室自动化市场(按产品类型、按流程、按技术、按最终用户、按国家和地区)-2025 年至 2032 年全球产业分析、市场规模、市场份额及预测蛋白质工程市场中的实验室自动化,按产品类型、按工作流程阶段、按应用、按技术、按最终用户、按国家和地区 - 2025 年至 2032 年的全球行业分析、市场规模、市场份额和预测
 实验室自动化市场(按产品、类型、阶段、部署模式、应用和最终用户划分)—2025-2030 年全球预测
 体外诊断实验室自动化的全球市场全球实验室自动化市场临床诊断市场中的实验室自动化,按自动化类型、按产品类型、按技术、按应用、按最终用户、按国家和地区划分 - 2025 年至 2032 年全球行业分析、市场规模、市场份额和预测美国小分子药物研发外包市场规模、份额和趋势分析报告:按工作流程、服务、治疗领域、最终用途和细分市场预测,2025 年至 2033 年小分子药物研发外包市场规模、份额和趋势分析报告:按工作流程、服务、治疗领域、最终用途、地区和细分市场预测,2025 年至 2033 年美国药物研发外包市场规模、份额和趋势分析报告:按工作流程、药物、服务、治疗领域、最终用途和细分市场预测,2025-2023 年