


 |
市场调查报告书
商品编码
1762532
医疗器材合约製造市场:产业趋势及全球预测 - 依应用、设备类别、治疗领域和重点地区Medical Device Contract Manufacturing Market: Industry Trends and Global Forecasts - Distribution by Application Area, Device Class, Target Therapeutic Area, Key Geographical Regions |
||||||
医疗器材合约製造市场:概览
今年全球医疗器材合约製造市场规模达 788亿美元。预计预测期内,该市场的年复合成长率将达到 8.2%。
市场区隔包括根据以下参数进行的市场规模和机会分析:
应用领域
- 治疗器械
- 诊断器械
- 药物输送器械
- 其他器械
器械类别
- I类
- II类
- III类
目标治疗领域
- 心血管疾病
- 中枢神经系统疾病
- 代谢性疾病
- 肿瘤疾病
- 眼科
- 骨科
- 疼痛障碍
- 呼吸系统疾病
- 其他
主要地区
- 北美洲(美国)
- 欧洲(义大利、德国、法国、西班牙、英国及世界其他地区)
- 亚太地区(中国、日本、印度)
- 其他地区
医疗器材合约製造市场:成长与趋势
在过去的50年中,医疗器械行业取得了多项显着进展,包括微创手术器械的引进以及起搏器等植入式器械的兴起。此外,假体等生物医学器械的使用也随着时间的推移显着增加,每年有数百万人接受手术和植入。此外,心臟去颤器、人工髋关节和膝关节、隐形眼镜、心臟节律器等是最常见的植入式医疗器械,而固定装置和人工关节约占所有医疗器械的44%。这显示医疗保健领域对医疗器材的需求成长。然而,大多数开发商缺乏足够的资源或必要的专业知识来製造医疗器材及相关零件。
随着医疗器材合约研究组织(CRO)的兴起,拥有医疗器材专业知识的合约製造组织(CMO)领域也在稳步扩张。值得注意的是,自2000年以来,已有超过65家CMO成立。此外,根据世界卫生组织(WHO)的报告,全球约有200万种医疗器械,分为7,000多个通用器械类别。值得注意的是,CMO以其显着的成本效益、先进的现代化基础设施、大规模的生产能力以及更快的上市时间而闻名。因此,医疗器材合约製造服务提供者的机会稳步成长。
医疗器材合约製造市场:关键洞察
本报告深入探讨了医疗器材合约製造市场的现状,并识别了行业内的潜在成长机会。主要调查结果包括:
- 新兴技术和平台已成为众多中小型医疗器材公司成立和成功的主要驱动力之一。
- 监管合规和审批的复杂性、不断上涨的製造成本以及多样化的技术,促使申办方寻求能够支持其器械整个生命週期的製造合作伙伴。
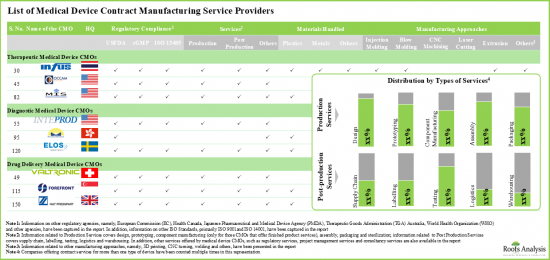
- 全球超过 275 家公司拥有为各种医疗器材(包括治疗和诊断产品)提供合约製造服务所需的专业知识和授权。
- 市场格局分散,既有老牌企业,也有新进者。目前,大多数医疗器材製造工厂都位于已开发地区。
- 医疗器材合约製造企业(CMO)积极调整运营,以符合各全球和区域监管机构制定的标准。
- 植入物已成为最突出的细分市场之一,其收购活动相对较多。此类收购背后的主要价值驱动因素包括产能扩张和地理整合。
- 在过去六年中,各类申办方已註册了超过 9,600 项评估各种医疗器材的临床试验,涵盖了广泛的治疗领域。
- 在该领域运营的公司稳步扩展其能力,以增强各自的服务组合,并遵守不断变化的行业基准。
- 在快速成长的需求推动下,预计医疗器材合约製造市场在各个治疗领域和地区的成品年成长率将超过 8.2%。
- 目前,现有的CMO 占据了很大的占有率,但从长远来看,预计不同类型的公司、不同的器械类别和不同的应用领域将带来多样化的机会。
医疗器材合约製造市场:关键细分市场
市场依应用细分为治疗医疗器材、诊断医疗器材、给药医疗器材和其他器材。目前,由于胰岛素帮浦和输液帮浦等治疗设备的需求不断成长,治疗医疗器材领域在全球医疗器材合约製造市场中占据最大占有率。此外,预计在预测期内,药物传输设备领域的医疗器材合约製造市场将呈现最高的市场成长。
依器械类别,市场分为I类、II类及III类。目前,II类器械在全球医疗器材合约製造市场中占据最大占有率。此外,由于II类器材具有易于客製化和产品种类丰富等诸多优势,因此预计在预测期内,II类器材的市场将以更高的年复合成长率成长。
根据涵盖的治疗领域,市场细分为心血管疾病、中枢神经系统疾病、代谢性疾病、肿瘤疾病、骨科疾病、眼科疾病、疼痛疾病、呼吸系统疾病等。目前,骨科疾病领域在全球医疗器材合约製造市场中占最大占有率。然而,由于肥胖、胰岛素阻抗、第1型糖尿病和高血压等代谢性疾病的盛行率不断上升,预计代谢性疾病领域在预测期内的年复合成长率将更高。
依主要地区划分,市场分为北美、欧洲、亚太地区及世界其他地区。目前,北美在全球医疗器材合约製造市场中占据主导地位,占据最大的收入占有率。此外,亚太地区市场未来很可能会以更高的年复合成长率成长。
医疗器材合约製造市场参与者
- Cirtec Medical
- Creganna Medical
- DynaFlex Technologies
- Europlaz Technologies
- I-Tek Medical Technologies
- Interplex
- Keystone Solutions Group
- Modern Medical
- Oscor
- Riverside Medical Packaging
- SMC
- Synecco
- Suzhou Jenitek
- Stellartech Research
- Trelleborg Sealing Solutions
目录
第1章 简介
第2章 执行摘要
第3章 简介
- 章节概述
- 医疗器材:概述
- 医疗器材製造
- 医疗器材CMO历史年表
- 医疗器材CMO提供的服务
- 医疗器材CMO提供的优势
- 外包给CMO的风险
- 关键考虑因素
- 结论
第4章 医疗器材监管格局
- 章节概述
- 医疗器材通用监管指南
- 北美监理格局
- 欧洲监管格局
- 亚太监管格局
- 区域监理环境比较
第5章 市场概述:治疗器材
- 章节概述
- 为治疗器材提供服务的医疗器材CMO设备
第6章 市场概览:诊断设备
- 章节概览
- 提供诊断设备服务的医疗器材合约生产企业(CMO)
第7章 市场概览:输送系统及其他
- 章节概览
- 导管
- 药物传输设备
- 其他设备
第8章 基准分析
- 章节概览
- 基准分析:研究方法
- 依地区划分的基准分析
- 结论
第9章 供应链分析
- 章节概览
- 医疗器材供应链概览
- 影响医疗器材供应的因素供应链
- 关键绩效指标
- 供应链改善策略
- 供应链最佳化的有效性
- 成本分析
第10章 公司简介
- 章节概述
- 总部位于北美的CMO
- Cirtec Medical
- DynaFlex Technologies
- I-Tek Medical Technologies
- Keystone Solutions Group
- Oscor
- SMC
- Stellartech Research
- 总部位于欧洲的CMO
- Creganna Medical
- Europlaz Technologies
- Riverside Medical Packaging
- Synecco
- Trelleborg Sealing Solutions
- 总部位于亚洲的CMO
- Interplex
- Modern Medical
- Providence Enterprise
- Suzhou JenitekJenitek
第11章 临床试验分析
- 章节概述
- 研究范围与研究方法
- 临床试验分析:研究标题词云
- 临床试验分析
- 入组受试者分析
- 重点治疗领域分析
第12章 併购
第13章 案例研究:离岸医疗器材合约製造
- 章节概述
- 新兴市场:定义与关键区域
- 新兴市场在工业製造中的作用
- 新兴市场的医疗器材製造
- 致力于新兴市场医疗器材製造的跨国公司市场
- 新兴市场医疗器材製造的商业模式
- 医疗器材产业创新面临的关键挑战
- 在新兴市场建立创新中心的优势
- 未来展望
第14章 市场预测
- 章节概述
- 预测研究方法与关键假设
- 2035年医疗器材合约製造市场整体状况
- 医疗器材合约製造市场:区域分布(~2035年)
第15章 SWOT分析
第16章 结论
第17章 调查/访谈纪录
第18章 附录1:表格资料
第19章 附录2:公司与组织清单
MEDICAL DEVICE CONTRACT MANUFACTURING MARKET: OVERVIEW
As per Roots Analysis, the global medical device contract manufacturing market valued at USD 78.8 billion in the current year is anticipated to grow at a CAGR of 8.2% during the forecast period.
The market sizing and opportunity analysis has been segmented across the following parameters:
Application Areas
- Therapeutic Medical Devices
- Diagnostic Medical Devices
- Drug Delivery Medical Devices
- Other Devices
Device Class
- Class I
- Class II
- Class III
Target Therapeutic Area
- Cardiovascular Disorders
- CNS Disorders
- Metabolic Disorders
- Oncological Disorders
- Ophthalmic Disorders
- Orthopedic Disorders
- Pain Disorders
- Respiratory Disorders
- Others
Key Geographical Regions
- North America (US)
- Europe (Italy, Germany, France, Spain, UK, Rest of the Europe)
- Asia-Pacific (China, Japan, India)
- Rest of the World
MEDICAL DEVICE CONTRACT MANUFACTURING MARKET: GROWTH AND TRENDS
Over the past 50 years, the medical device industry has seen several notable developments, such as the introduction of minimally invasive surgical instruments and the rise of implantable devices like pacemakers. Additionally, the use of biomedical devices like prostheses has increased substantially over time owing to the fact that each year, millions of individuals undergo surgeries and implantations. Further, cardioverter defibrillators, prosthetic hips and knees, contact lenses, and cardiac pacemakers are some of the most commonly implanted medical devices, while fixation devices and artificial joints account for about 44% of all medical devices. This is indicative of the growing demand for medical devices in the healthcare domain. However, most developers lack adequate resources and the necessary expertise to manufacture medical devices and related components.
Given the rise of medical device CROs, the opportunity for CMOs with expertise in medical devices is also steadily rising. It is worth highlighting that, since 2000, more than 65 CMOs have been established. Further, the World Health Organization reports approximately 2 million unique medical devices worldwide, classified into more than 7,000 generic device categories. Notably, CMOs are known to offer significant cost-benefits, access to sophisticated / up-to-date infrastructure, large production capacities and reduction in time-to-market. As a result, the opportunity for medical device contract manufacturing service providers is steadily increasing.
MEDICAL DEVICE CONTRACT MANUFACTURING MARKET: KEY INSIGHTS
The report delves into the current state of the medical device contract manufacturing market and identifies potential growth opportunities within industry. Some key findings from the report include:
- Novel technologies and platforms have emerged as one of the primary factors responsible for the establishment and success of a number of small and mid-sized medical device companies.
- Owing to complexities associated with regulatory compliance and approvals, increasing manufacturing costs and varying technologies, sponsors seek a manufacturing partner that can support the entire lifecycle of the device.
- Over 275 companies worldwide have the necessary expertise and authorization to offer contract manufacturing services for various types of medical devices, including therapeutic and diagnostic products
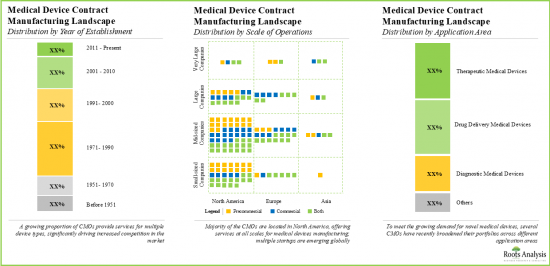
- The market landscape is fragmented, featuring the presence of both established players and new entrants; presently, most medical device manufacturing facilities are located in the developed geographies.
- Medical device CMOs are actively engaged in aligning their operations to comply with the standards established by various global and regional regulatory bodies.
- Implants have emerged as one of the most prominent segments for which the acquisition activity is relatively higher; key value drivers behind such acquisitions include capability addition and geographical consolidation.
- In the last six years, over 9,600 trials evaluating various medical devices have been registered by different types of sponsors covering a wide range of therapeutic areas.
- Companies involved in this domain are steadily expanding their capabilities in order to enhance their respective service portfolios and comply with evolving industry benchmarks.
- Driven by a rapidly growing demand, medical device contract services market is anticipated to grow at annualized rate of over 8.2% for a variety of therapeutic areas and geographies for finished products.
- Established CMOs currently occupy a major share; in the long term, the opportunity is anticipated to be better distributed across different types of companies, device classes and application areas.
MEDICAL DEVICE CONTRACT MANUFACTURING MARKET: KEY SEGMENTS
Therapeutic Medical Devices Segment holds the Largest Share of the Medical Device Contract Manufacturing Market
Based on the application areas, the market is segmented into therapeutic medical devices, diagnostic medical devices, drug delivery medical devices and other devices. At present, the therapeutic medical devices segment holds the maximum share of the global medical device contract manufacturing market owing to the increasing demand for therapeutic devices such as insulin pumps and infusion pumps. Further, the medical device contract manufacturing market for drug delivery devices segment is expected to show the highest market growth potential during the forecast period.
By Device Class, Class II is the Fastest Growing Segment of the Global Medical Device Contract Manufacturing Market
Based on the device class, the market is segmented into Class I, Class II and Class III. At present, the class II segment holds the maximum share of the global medical device contract manufacturing market. Further, owing to the various benefits offered by class II devices, such as ease of customization and diverse product range, the market for class II segment is expected to grow at a higher CAGR during the forecast period.
By Target Therapeutic Area, Orthopedic Disorders Segment Accounts for the Largest Share of the Global Medical Device Contract Manufacturing Market
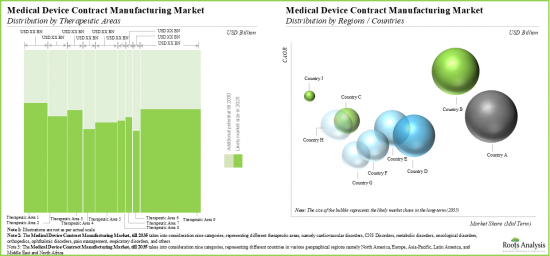
Based on the target therapeutic area, the market is segmented into cardiovascular disorders, CNS disorders, metabolic disorders, oncological disorders, orthopedic disorders, ophthalmic disorders, pain disorders, respiratory disorders, and others. Currently, the orthopedic disorders segment captures the highest proportion of the global medical device contract manufacturing market. However, the metabolic disorders segment is expected to grow at a higher CAGR during the forecast period owing to the growing prevalence of metabolic disorders such as obesity, insulin resistance, Type 1 diabetes and hypertension.
North America Accounts for the Largest Share of the Market
Based on key geographical regions, the market is segmented into North America, Europe, Asia-Pacific and Rest of the World. Currently, North America dominates the global medical device contract manufacturing market and accounts for the largest revenue share. Further, the market in Asia-Pacific is likely to grow at a higher CAGR in the coming future.
Example Players in the Medical Device Contract Manufacturing Market
- Cirtec Medical
- Creganna Medical
- DynaFlex Technologies
- Europlaz Technologies
- I-Tek Medical Technologies
- Interplex
- Keystone Solutions Group
- Modern Medical
- Oscor
- Riverside Medical Packaging
- SMC
- Synecco
- Suzhou Jenitek
- Stellartech Research
- Trelleborg Sealing Solutions
MEDICAL DEVICE CONTRACT MANUFACTURING MARKET: RESEARCH COVERAGE
- Market Sizing and Opportunity Analysis: The report features an in-depth analysis of the global medical device contract manufacturing market, focusing on key market segments, including [A] application areas, [B] device class, [C] target therapeutic area and [D] key geographical regions.
- Market Landscape: A comprehensive evaluation of the medical device contract manufacturers, based on several relevant parameters, such as [A] year of establishment, [B] company size, [C] manufacturing facilities, [D] geographical location, [E] type of device manufactured, [F] the scale of operation and [G] types of services offered.
- Regulatory Landscape for Medical Devices: A comprehensive discussion of the various guidelines established by major regulatory bodies for medical device approval across different countries. Additionally, the section includes a multi-dimensional bubble analysis, focusing on a comparison of the contemporary regulatory scenario in key geographies across the globe.
- Benchmark Analysis: A comprehensive benchmark analysis emphasizing the primary focus areas of small, mid-sized, and large companies, comparing their current capabilities within and across peer groups, and offering stakeholders insights to achieve a competitive advantage in the industry.
- Supply Chain Analysis: A detailed analysis of medical device supply chain, highlighting the role of CMOs engaged in the medical device contract manufacturing market and analysis based on services offered, such as [A] supply chain management services, [B] logistics services, [C] shipping services, and [D] warehousing services.
- Company Profiles: In-depth profiles of key players that specialize in providing services for both pre-commercial and commercial scale manufacturing of medical devices, focusing on [A] overview of the company, [B] service portfolio, [C] manufacturing facilities and [D] recent developments and an informed future outlook.
- Clinical Trial Analysis: An insightful analysis of clinical trials related to medical devices, based on several parameters, such as [A] number of registered trials, [B] current status of trials, [C] phase of development, [D] type of sponsor, [E] therapeutic area(s), [F] target disease indication(s), and [G] number of patients enrolled.
- Mergers and Acquisitions: An in-depth analysis of mergers and acquisitions undertaken in the medical device contract manufacturing market highlighting the number of companies acquired in recent years. Further, in depth-analysis of the key value drivers for these mergers and acquisitions was performed. In addition, the analysis features an ownership change matrix, providing a summary of the involvement of private and public sector entities in the market.
- SWOT Analysis: An analysis of industry affiliated trends, opportunities and challenges, which are likely to impact the evolution of antibody contract manufacturing market; it includes a Harvey ball analysis, assessing the relative impact of each SWOT parameter on industry dynamics.
KEY QUESTIONS ANSWERED IN THIS REPORT
- How many companies are currently engaged in this market?
- Which are the leading companies in this market?
- What factors are likely to influence the evolution of this market?
- What is the current and future market size?
- What is the CAGR of this market?
- How is the current and future market opportunity likely to be distributed across key market segments?
REASONS TO BUY THIS REPORT
- The report provides a comprehensive market analysis, offering detailed revenue projections of the overall market and its specific sub-segments. This information is valuable to both established market leaders and emerging entrants.
- Stakeholders can leverage the report to gain a deeper understanding of the competitive dynamics within the market. By analyzing the competitive landscape, businesses can make informed decisions to optimize their market positioning and develop effective go-to-market strategies.
- The report offers stakeholders a comprehensive overview of the market, including key drivers, barriers, opportunities, and challenges. This information empowers stakeholders to stay abreast of market trends and make data-driven decisions to capitalize on growth prospects.
ADDITIONAL BENEFITS
- Complimentary PPT Insights Packs
- Complimentary Excel Data Packs for all Analytical Modules in the Report
- 15% Free Content Customization
- Detailed Report Walkthrough Session with Research Team
- Free Updated report if the report is 6-12 months old or older
TABLE OF CONTENTS
1. PREFACE
- 1.1. Scope of the Report
- 1.2. Research Methodology
- 1.2.1. Research Assumptions
- 1.2.2. Project Methodology
- 1.2.3. Forecast Methodology
- 1.2.4. Robust Quality Control
- 1.2.5. Key Considerations
- 1.2.5.1. Demographics
- 1.2.5.2. Economic Factors
- 1.2.5.3. Government Regulations
- 1.2.5.4. Supply Chain
- 1.2.5.5. COVID Impact / Related Factors
- 1.2.5.6. Market Access
- 1.2.5.7. Healthcare Policies
- 1.2.5.8. Industry Consolidation
- 1.3 Key Questions Answered
- 1.4. Chapter Outlines
2. EXECUTIVE SUMMARY
3. INTRODUCTION
- 3.1. Chapter Overview
- 3.2. Medical Devices: An Overview
- 3.2.1. History of Medical Devices
- 3.2.2. Classification of Medical Devices
- 3.3. Medical Device Manufacturing
- 3.3.1. Challenges Associated with Medical Device Manufacturing
- 3.3.2. Role of CMOs in Medical Device Manufacturing
- 3.3.3. Role of Automation in Medical Device Manufacturing Process
- 3.4. Historical Timeline for Medical Device CMOs
- 3.5. Services Offered by Medical Device CMOs
- 3.6. Advantages Offered by Medical Device CMOs
- 3.7. Risks associated with Outsourcing to CMOs
- 3.8. Key Considerations
- 3.9. Concluding Remarks
4. REGULATORY LANDSCAPE FOR MEDICAL DEVICES
- 4.1. Chapter Overview
- 4.2. General Regulatory Guidelines for Medical Devices
- 4.3. Regulatory Landscape in North America
- 4.3.1. The US Scenario
- 4.3.1.1. Regulatory Authority
- 4.3.1.2. Review / Approval Process
- 4.3.2. The Canadian Scenario
- 4.3.2.1. Regulatory Authority
- 4.3.2.2. Review / Approval Process
- 4.3.1. The US Scenario
- 4.4. Regulatory Landscape in Europe
- 4.4.1. Overall Scenario
- 4.4.1.1. Regulatory Authority
- 4.4.1.2. Review / Approval Process
- 4.4.2. Case Study: Brexit -The UK Scenario
- 4.4.1. Overall Scenario
- 4.5. Regulatory Landscape in Asia-Pacific
- 4.5.1. The Chinese Scenario
- 4.5.1.1. Regulatory Authority
- 4.5.1.2. Review / Approval Process
- 4.5.2. The Japanese Scenario
- 4.5.2.1. Regulatory Authority
- 4.5.2.2. Review / Approval Process
- 4.5.3. The Australian Scenario
- 4.5.3.1. Regulatory Authority
- 4.5.3.2. Review / Approval Process
- 4.5.1. The Chinese Scenario
- 4.6. Comparison of Regional Regulatory Environment
5. MARKET OVERVIEW: THERAPEUTIC DEVICES
- 5.1. Chapter Overview
- 5.2. Medical Device CMOs Offering Services for Therapeutic Devices
- 5.2.1. Analysis by Year of Establishment
- 5.2.2. Analysis by Size of Employee Base
- 5.2.3. Analysis by Location of Headquarters
- 5.2.4. Analysis by Location of Manufacturing Facility
- 5.2.5. Analysis by Regulatory Certifications / Accreditations
- 5.2.6. Analysis by Production Services Offered
- 5.2.7. Analysis by Post-production Services Offered
- 5.2.8. Analysis by Other Services Offered
- 5.2.9. Analysis by Device Class
- 5.2.10. Analysis by Type of Material(s) Handled
- 5.2.11. Analysis by Scale of Operation
- 5.2.12. Leading Players
6. MARKET OVERVIEW: DIAGNOSTIC DEVICES
- 6.1. Chapter Overview
- 6.2. Medical Device CMOs Offering Services for Diagnostic Devices
- 6.2.1. Analysis by Year of Establishment
- 6.2.2. Analysis by Size of Employee Base
- 6.2.3. Analysis by Location of Headquarters
- 6.2.4. Analysis by Location of Manufacturing Facility
- 6.2.5. Analysis by Regulatory Certifications / Accreditations
- 6.2.6. Analysis by Production Services Offered
- 6.2.7. Analysis by Post-Production Services Offered
- 6.2.8. Analysis by Other Services Offered
- 6.2.9. Analysis by Device Class
- 6.2.10. Analysis by Type of Material(s) Handled
- 6.2.11. Analysis by Scale of Operation
- 6.2.12. Leading Players
7. MARKET OVERVIEW: DELIVERY SYSTEMS AND OTHERS
- 7.1. Chapter Overview
- 7.2. Catheters
- 7.2.1. Medical Device CMOs Offering Services for Catheters
- 7.2.2. Analysis by Year of Establishment
- 7.2.3. Analysis by Size of Employee Base
- 7.2.4. Analysis by Location of Headquarters
- 7.2.5. Analysis by Location of Manufacturing Facility
- 7.2.6. Analysis by Regulatory Certifications / Accreditations
- 7.2.7. Analysis by Production Services Offered
- 7.2.8. Analysis by Post-Production Services Offered
- 7.2.9. Analysis by Other Services Offered
- 7.2.10. Analysis by Device Class
- 7.2.11. Analysis by Type of Material(s) Handled
- 7.2.12. Analysis by Scale of Operation
- 7.2.13. Leading Players
- 7.3. Drug Delivery Devices
- 7.3.1. Medical Device CMOs Offering Services for Drug Delivery Devices
- 7.3.2. Analysis by Year of Establishment
- 7.3.3. Analysis by Size of Employee Base
- 7.3.4. Analysis by Location of Headquarters
- 7.3.5. Analysis by Location of Manufacturing Facility
- 7.3.6. Analysis by Regulatory Certifications / Accreditations
- 7.3.7. Analysis by Production Services Offered
- 7.3.8. Analysis by Post-Production Services Offered
- 7.3.9. Analysis by Other Services Offered
- 7.3.10. Analysis by Device Class
- 7.3.11. Analysis by Type of Material(s) Handled
- 7.3.12. Analysis by Scale of Operation
- 7.3.13. Leading Players
- 7.4. Other Devices
- 7.4.1. Medical Device CMOs Offering Services for Other Medical Devices
- 7.4.2. Analysis by Year of Establishment
- 7.4.3. Analysis by Size of Employee Base
- 7.4.4. Analysis by Location of Headquarters
- 7.4.5. Analysis by Location of Manufacturing Facility
- 7.4.6. Analysis by Regulatory Certifications / Accreditations
- 7.4.7. Analysis by Production Services Offered
- 7.4.8. Analysis by Post-Production Services Offered
- 7.4.9. Analysis by Other Services Offered
- 7.4.10. Analysis by Device Class
- 7.4.11. Analysis by Type of Material(s) Handled
- 7.4.12. Analysis by Scale of Operation
8. BENCHMARK ANALYSIS
- 8.1. Chapter Overview
- 8.2. Benchmark Analysis: Methodology
- 8.3. Region-wise Benchmark Analysis
- 8.3.1. North America, Peer Group I
- 8.3.2. North America, Peer Group II
- 8.3.3. North America, Peer Group III
- 8.3.4. North America, Peer Group IV
- 8.3.5. North America, Peer Group V
- 8.3.6. North America, Peer Group VI
- 8.3.7. North America, Peer Group VII
- 8.3.8. Europe, Peer Group VIII
- 8.3.9. Europe, Peer Group IX
- 8.3.10. Europe, Peer Group X
- 8.3.11. Asia, Peer Group XI
- 8.3.12. Asia, Peer Group XII
- 8.4. Concluding Remarks
9. SUPPLY CHAIN ANALYSIS
- 9.1. Chapter Overview
- 9.2. Overview of the Medical Device Supply Chain
- 9.3. Factors Affecting the Medical Device Supply Chain
- 9.4. Key Performance Indicators
- 9.5. Supply Chain Improvement Strategies
- 9.5.1. Optimization of Supply Chain Capabilities
- 9.5.2. Visible Supply Chain and Related Advantages
- 9.5.2.1. Augmenting Supply Chain Visibility Through Digitalization
- 9.5.2.2. Benefits of Digital Supply Chain
- 9.6. Effects of Supply Chain Optimization
- 9.7. Cost Analysis
- 9.7.1. Production-related Costs
- 9.7.1.1. Labor Costs
- 9.7.1.2. Raw Materials Related Costs
- 9.7.1.3. Regulatory Compliance
- 9.7.1.4. Technology-related Costs
- 9.7.2. Supply Chain-related Costs
- 9.7.2.1. Local Presence
- 9.7.2.2. Geopolitical Risk
- 9.7.2.3. Logistics
- 9.7.1. Production-related Costs
10. COMPANY PROFILES
- 10.1. Chapter Overview
- 10.2. CMOs Headquartered in North America
- 10.2.1. Cirtec Medical
- 10.2.1.1. Company Overview
- 10.2.1.2. Service Portfolio
- 10.2.1.3. Manufacturing Capabilities and Facilities
- 10.2.1.3.1. Facilities located in North America
- 10.2.1.3.2. Facilities Located in Europe
- 10.2.1.4. Future Outlook
- 10.2.2. DynaFlex Technologies
- 10.2.2.1. Company Overview
- 10.2.2.2. Service Portfolio
- 10.2.2.3. Manufacturing Capabilities and Facilities
- 10.2.2.4. Future Outlook
- 10.2.3. I-Tek Medical Technologies
- 10.2.3.1. Company Overview
- 10.2.3.2. Service Portfolio
- 10.2.3.3. Manufacturing Capabilities and Facilities
- 10.2.3.4. Future Outlook
- 10.2.4. Keystone Solutions Group
- 10.2.4.1. Company Overview
- 10.2.4.2. Service portfolio
- 10.2.4.3. Manufacturing Facilities
- 10.2.4.4. Future Outlook
- 10.2.5. Oscor
- 10.2.5.1. Company Overview
- 10.2.5.2. Service Portfolio
- 10.2.5.3. Manufacturing Capabilities and facilities
- 10.2.5.4. Future Outlook
- 10.2.6. SMC
- 10.2.6.1. Company Overview
- 10.2.6.2. Service Portfolio
- 10.2.6.3. Manufacturing Capabilities and facilities
- 10.2.6.3.1. Facilities Located in North America
- 10.2.6.3.2. Facility Located in Central America
- 10.2.6.3.3. Facility Located in Europe
- 10.2.6.3.4. Facility Located in Asia
- 10.2.6.4. Future Outlook
- 10.2.7. Stellartech Research
- 10.2.7.1. Company Overview
- 10.2.7.2. Service Portfolio
- 10.2.7.3. Manufacturing Capabilities and facilities
- 10.2.7.4. Future Outlook
- 10.2.1. Cirtec Medical
- 10.3. CMOs Headquartered in Europe
- 10.3.1. Creganna Medical
- 10.3.1.1. Company Overview
- 10.3.1.2. Service Portfolio
- 10.3.1.3. Manufacturing Facilities
- 10.3.1.3.1. Facilities Located in North America
- 10.3.1.3.2. Facilities Located in Central America
- 10.3.1.3.3. Facilities Located in Europe
- 10.3.1.3.4. Facilities Located in Asia
- 10.3.1.4. Future Outlook
- 10.3.2. Europlaz Technologies
- 10.3.2.1. Company Overview
- 10.3.2.2. Service Portfolio
- 10.3.2.3. Manufacturing facilities
- 10.3.2.4. Future Outlook
- 10.3.3. Riverside Medical Packaging
- 10.3.3.1. Company Overview
- 10.3.3.2. Service Portfolio
- 10.3.3.3. Manufacturing Facilities
- 10.3.3.4. Future Outlook
- 10.3.4. Synecco
- 10.3.4.1. Company Overview
- 10.3.4.2. Service Portfolio
- 10.3.4.3. Manufacturing Facilities
- 10.3.4.3.1. Facilities Located in Europe
- 10.3.4.3.2. Facilities Located in Asia
- 10.3.4.4. Future Outlook
- 10.3.5. Trelleborg Sealing Solutions
- 10.3.5.1. Company Overview
- 10.3.5.2. Service Portfolio
- 10.3.5.3. Manufacturing Facilities
- 10.3.5.3.1. Facilities Located in North America
- 10.3.5.3.2. Facilities Located in Europe
- 10.3.5.4. Future Outlook
- 10.3.1. Creganna Medical
- 10.4. CMOs Headquartered in Asia
- 10.4.1. Interplex
- 10.4.1.1. Company Overview
- 10.4.1.2. Service Portfolio
- 10.4.1.3. Manufacturing Facilities
- 10.4.1.3.1. Facilities Located in North America
- 10.4.1.3.2. Facilities Located in Europe
- 10.4.1.3.3. Facilities Located in Asia
- 10.4.1.4. Future Outlook
- 10.4.2. Modern Medical
- 10.4.2.1. Company Overview
- 10.4.2.2. Service Portfolio
- 10.4.2.3. Manufacturing facilities
- 10.4.2.4. Future Outlook
- 10.4.3. Providence Enterprise
- 10.4.3.1. Company Overview
- 10.4.3.2. Service Portfolio
- 10.4.3.3. Manufacturing Facilities
- 10.4.3.4. Future Outlook
- 10.4.4. Suzhou JenitekJenitek
- 10.4.4.1. Company overview
- 10.4.4.2. Service Portfolio
- 10.4.4.3. Manufacturing Facilities
- 10.4.4.4. Future Outlook
- 10.4.1. Interplex
11. CLINICAL TRIAL ANALYSIS
- 11.1. Chapter Overview
- 11.2. Scope and Methodology
- 11.3. Clinical Trial Analysis: Word Cloud of Trial Titles
- 11.4. Analysis of Clinical Trials
- 11.4.1. Analysis by Trial Start Year
- 11.4.2. Analysis by Trial Status
- 11.4.3. Analysis by Phase of Development
- 11.4.4. Analysis by Target Indication
- 11.4.5. Analysis by Type of Sponsor
- 11.4.6. Analysis by Geography
- 11.4.7. Analysis by Trial Start Year and Geography
- 11.5. Analysis of Enrolled Patient Population
- 11.5.1. Analysis by Trial Status
- 11.5.2. Analysis by Phase of Development
- 11.5.3. Analysis by Geography
- 11.6. Analysis of Focus Therapeutic Areas
- 11.6.1. Analysis by Type of Sponsor
- 11.6.2. Analysis by Geography
- 11.6.2.1. North American Scenario
- 11.6.2.2. European Scenario
- 11.6.2.3. Asia Pacific Scenario
- 11.6.2.4. Rest of the World Scenario
- 11.6.3. Cardiovascular Disorders
- 11.6.3.1. Analysis by Trial Start Year
- 11.6.3.2. Analysis by Type of Sponsor
- 11.6.3.3. Analysis by Geography
- 11.6.4. Oncological Disorders
- 11.6.4.1. Analysis by Trial Start Year
- 11.6.4.2. Analysis by Type of Sponsor
- 11.6.4.3. Analysis by Geography
- 11.6.5. Central Nervous System (CNS) Disorders
- 11.6.5.1. Analysis by Trial Start Year
- 11.6.5.2. Analysis by Type of Sponsor
- 11.6.5.3. Analysis by Geography
- 11.6.6. Orthopedic Disorders
- 11.6.6.1. Analysis by Trial Start Year
- 11.6.6.2. Analysis by Type of Sponsor
- 11.6.6.3. Analysis by Geography
- 11.6.7. Respiratory Disorders
- 11.6.7.1. Analysis by Trial Start Year
- 11.6.7.2. Analysis by Type of Sponsor
- 11.6.7.3. Analysis by Geography
12. MERGERS AND ACQUISITIONS
- 12.1. Chapter Overview
- 12.2. Merger and Acquisition Models
- 12.3. Medical Device Contract Manufacturing: Mergers and Acquisitions
- 12.3.1. Analysis by Year of Mergers and Acquisitions
- 12.3.2. Analysis by Type of Acquisition
- 12.3.3. Most Active Acquirers: Analysis by Number of Acquisitions
- 12.3.4. Analysis by Key Value Drivers
- 12.3.4.1. Continent-wise distribution
- 12.3.4.2. Intercontinental and Intracontinental Deals
- 12.3.4.3. Country-wise distribution
- 12.3.5. Ownership Change Matrix
- 12.3.6. Acquisitions Made by Medical Device Companies
- 12.3.6.1. Acquisition of Entire Company
- 12.3.6.1.1. Analysis by Key Value Drivers
- 12.3.6.1.2. Analysis by Key Value Drivers and Year of Acquisition
- 12.3.6.1.3. Analysis by Type of Services Offered
- 12.3.6.1.4. Analysis by Type of Device
- 12.3.6.1.5. Analysis by Therapeutic Area
- 12.3.6.2. Acquisition of Company Assets
- 12.3.6.2.1. Analysis by Key Value Drivers
- 12.3.6.2.2. Analysis by Key Value Drivers and Year of Acquisition
- 12.3.6.1. Acquisition of Entire Company
- 12.3.7. Acquisition by Private Equity Firms
- 12.3.7.1. Analysis by Year of Acquisition
- 12.3.7.2. Analysis by Type of Acquisition
- 12.3.7.3. Analysis by Type of Device
- 12.3.7.4. Analysis by Therapeutic Area
- 12.4. Key Acquisitions: Deal Multiples
- 12.4.1. Analysis by Revenues
13. CASE STUDY: OFFSHORING MEDICAL DEVICE CONTRACT MANUFACTURING
- 13.1. Chapter Overview
- 13.2. Emerging Markets: Definitions and Key Regions
- 13.3. Role of Emerging Markets in Industrial Manufacturing
- 13.3.1. Contributions to the Automobile Industry
- 13.3.2. Contributions to the Aerospace and Defense Industries
- 13.4. Medical Devices Manufacturing in Emerging Markets
- 13.4.1. The US-Chinese Scenario
- 13.4.2. Partnership with Companies in Emerging Markets
- 13.5. Multinational Companies Focused on Manufacturing Medical Devices in Emerging Markets
- 13.6. Business Models for Medical Device Manufacturing in Emerging Markets
- 13.6.1. Case Studies
- 13.6.1.1. Study A: Overview
- 13.6.1.1.1. Value Proposition
- 13.6.1.1.2. Value Creation
- 13.6.1.2. Study B: Overview
- 13.6.1.2.1. Value Proposition
- 13.6.1.2.2. Value Creation
- 13.6.1.1. Study A: Overview
- 13.6.1. Case Studies
- 13.7. Key Challenges related to Innovation in the Medical Device Industry
- 13.7.1. Limitations of In-House Innovation
- 13.8. Advantages of Establishing Innovation Hubs in Emerging Markets
- 13.8.1. Challenges and Market Restraints
- 13.8.2. Strategies to Address Existing Challenges
- 13.9. Future Perspectives
14. MARKET FORECAST
- 14.1. Chapter Overview
- 14.2. Forecast Methodology and Key Assumptions
- 14.3. Overall Medical Device Contract Manufacturing Market, till 2035
- 14.3.1. Medical Device Contract Manufacturing Market: Distribution by Application Areas, till 2035
- 14.3.1.1. Medical Device Contract Manufacturing Market for Therapeutic Devices, till 2035
- 14.3.1.2. Medical Device Contract Manufacturing Market for Diagnostic Devices, till 2035
- 14.3.1.3. Medical Device Contract Manufacturing Market for Drug Delivery Devices, till 2035
- 14.3.1.4. Medical Device Contract Manufacturing Market for Other Devices, till 2035
- 14.3.2. Medical Device Contract Manufacturing Market: Distribution by Device Class, till 2035
- 14.3.2.1. Medical Device Contract Manufacturing Market: Class I Devices, till 2035
- 14.3.2.2. Medical Device Contract Manufacturing Market: Class II Devices, till 2035
- 14.3.2.3. Medical Device Contract Manufacturing Market: Class III Devices, till 2035
- 14.3.3. Medical Device Contract Manufacturing Market: Leading Players, till 2035
- 14.3.4. Medical Device Contract Manufacturing Market: Distribution by Therapeutic Areas, till 2035
- 14.3.4.1. Medical Device Contract Manufacturing Market for Cardiovascular Disorders, till 2035
- 14.3.4.2. Medical Device Contract Manufacturing Market for CNS Disorders, till 2035
- 14.3.4.3. Medical Device Contract Manufacturing Market for Metabolic Disorders, till 2035
- 14.3.4.4. Medical Device Contract Manufacturing Market for Oncological Disorders, till 2035
- 14.3.4.5. Medical Device Contract Manufacturing Market for Orthopedic Disorders, till 2035
- 14.3.4.6. Medical Device Contract Manufacturing Market for Ophthalmic Disorders, till 2035
- 14.3.4.7. Medical Device Contract Manufacturing Market for Pain Disorders, till 2035
- 14.3.4.8. Medical Device Contract Manufacturing Market for Respiratory Disorders, till 2035
- 14.3.4.9. Medical Device Contract Manufacturing Market for Other Therapeutic Areas, till 2035
- 14.3.1. Medical Device Contract Manufacturing Market: Distribution by Application Areas, till 2035
- 14.4. Medical Device Contract Manufacturing Market: Distribution by Geography, till 2035
- 14.4.1. Medical Device Contract Manufacturing Market in North America, till 2035
- 14.4.1.1. Medical Device Contract Manufacturing Market in the US, till 2035
- 14.4.1.2. Medical Device Contract Manufacturing Market in Rest of North America, till 2035
- 14.4.1.3. Medical Device Contract Manufacturing Market in North America: Class I Devices, till 2035
- 14.4.1.4. Medical Device Contract Manufacturing Market in North America: Class II Devices, till 2035
- 14.4.1.5. Medical Device Contract Manufacturing Market in North America: Class III Devices, till 2035
- 14.4.1.6. Medical Device Contract Manufacturing Market in North America for Cardiovascular Disorders, till 2035
- 14.4.1.7. Medical Device Contract Manufacturing Market in North America for CNS Disorders, till 2035
- 14.4.1.8. Medical Device Contract Manufacturing Market in North America for Metabolic Disorders, till 2035
- 14.4.1.9. Medical Device Contract Manufacturing Market in North America for Oncological Disorders, till 2035
- 14.4.1.10. Medical Device Contract Manufacturing Market in North America for Orthopedic Disorders, till 2035
- 14.4.1.11. Medical Device Contract Manufacturing Market in North America for Ophthalmic Disorders, till 2035
- 14.4.1.12. Medical Device Contract Manufacturing Market in North America for Pain Disorders, till 2035
- 14.4.1.13. Medical Device Contract Manufacturing Market in North America for Respiratory Disorders, till 2035
- 14.4.1.14. Medical Device Contract Manufacturing Market for Other Therapeutic Areas in North America, till 2035
- 14.4.2. Medical Device Contract Manufacturing Market in Europe, till 2035
- 14.4.2.1. Medical Device Contract Manufacturing Market in Italy, till 2035
- 14.4.2.2. Medical Device Contract Manufacturing Market in Germany, till 2035
- 14.4.2.3. Medical Device Contract Manufacturing Market in France, till 2035
- 14.4.2.4. Medical Device Contract Manufacturing Market in Spain, till 2035
- 14.4.2.5. Medical Device Contract Manufacturing Market in the UK, till 2035
- 14.4.2.6. Medical Device Contract Manufacturing Market in Rest of Europe, till 2035
- 14.4.2.7. Medical Device Contract Manufacturing Market in Europe: Class I Devices, till 2035
- 14.4.2.8. Medical Device Contract Manufacturing Market in Europe: Class II Devices, till 2035
- 14.4.2.9. Medical Device Contract Manufacturing Market in Europe: Class III Devices, till 2035
- 14.4.2.10. Medical Device Contract Manufacturing Market in Europe for Cardiovascular Disorders, till 2035
- 14.4.2.11. Medical Device Contract Manufacturing Market in Europe for CNS Disorders, till 2035
- 14.4.2.12. Medical Device Contract Manufacturing Market in Europe for Metabolic Disorders, till 2035
- 14.4.2.13. Medical Device Contract Manufacturing Market in Europe for Oncological Disorders, till 2035
- 14.4.2.14. Medical Device Contract Manufacturing Market in Europe for Orthopedic Disorders, till 2035
- 14.4.2.15. Medical Device Contract Manufacturing Market in Europe for Ophthalmic Disorders, till 2035
- 14.4.2.16. Medical Device Contract Manufacturing Market in Europe for Pain Disorders, till 2035
- 14.4.2.17. Medical Device Contract Manufacturing Market in Europe for Respiratory Disorders, till 2035
- 14.4.2.18. Medical Device Contract Manufacturing Market in Europe for Other Therapeutic Areas, till 2035
- 14.4.3. Medical Device Contract Manufacturing Market in Asia Pacific, till 2035
- 14.4.3.1. Medical Device Contract Manufacturing Market in China, till 2035
- 14.4.3.2. Medical Device Contract Manufacturing Market in Japan, till 2035
- 14.4.3.3. Medical Device Contract Manufacturing Market in India, till 2035
- 14.4.3.4. Medical Device Contract Manufacturing Market in Rest of Asia Pacific, till 2035
- 14.4.3.5. Medical Device Contract Manufacturing Market in Asia Pacific: Class I Devices, till 2035
- 14.4.3.6. Medical Device Contract Manufacturing Market in Asia Pacific: Class II Devices, till 2035
- 14.4.3.7. Medical Device Contract Manufacturing Market in Asia Pacific: Class III Devices, till 2035
- 14.4.3.8. Medical Device Contract Manufacturing Market in Asia Pacific for Cardiovascular Disorders, till 2035
- 14.4.3.9. Medical Device Contract Manufacturing Market in Asia Pacific for CNS Disorders, till 2035
- 14.4.3.10. Medical Device Contract Manufacturing Market in Asia Pacific for Metabolic Disorders, till 2035
- 14.4.3.11. Medical Device Contract Manufacturing Market in Asia Pacific for Oncological Disorders, till 2035
- 14.4.3.12. Medical Device Contract Manufacturing Market in Asia Pacific for Orthopedic Disorders, till 2035
- 14.4.3.13. Medical Device Contract Manufacturing Market in Asia Pacific for Ophthalmic Disorders, till 2035
- 14.4.3.14. Medical Device Contract Manufacturing Market in Asia Pacific for Pain Disorders, till 2035
- 14.4.3.15. Medical Device Contract Manufacturing Market in Asia Pacific for Respiratory Disorders, till 2035
- 14.4.3.16. Medical Device Contract Manufacturing Market in Asia Pacific for Other Therapeutic Areas, till 2035
- 14.4.4. Medical Device Contract Manufacturing Market in Rest of the World, till 2035
- 14.4.4.1. Medical Device Contract Manufacturing Market in Rest of the World: Class I Devices, till 2035
- 14.4.4.2. Medical Device Contract Manufacturing Market in Rest of the World: Class II Devices, till 2035
- 14.4.4.3. Medical Device Contract Manufacturing Market in Rest of the World: Class III Devices, till 2035
- 14.4.4.4. Medical Device Contract Manufacturing Market in Rest of the World for Cardiovascular Disorders, till 2035
- 14.4.4.5. Medical Device Contract Manufacturing Market in Rest of the World for CNS Disorders, till 2035
- 14.4.4.6. Medical Device Contract Manufacturing Market in Rest of the World for Metabolic Disorders, till 2035
- 14.4.4.7. Medical Device Contract Manufacturing Market in Rest of the World for Oncological Disorders, till 2035
- 14.4.4.8. Medical Device Contract Manufacturing Market in Rest of the World for Orthopedic Disorders, till 2035
- 14.4.4.9. Medical Device Contract Manufacturing Market in Rest of the World for Ophthalmic Disorders, till 2035
- 14.4.4.10. Medical Device Contract Manufacturing Market in Rest of the World for Pain Disorders, till 2035
- 14.4.4.11. Medical Device Contract Manufacturing Market in Rest of the World for Respiratory Disorders, till 2035
- 14.4.4.12. Medical Device Contract Manufacturing Market in Rest of the World for Other Therapeutic Areas, till 2035
- 14.4.1. Medical Device Contract Manufacturing Market in North America, till 2035
15. SWOT ANALYSIS
- 15.1. Chapter Overview
- 15.2. Strengths
- 15.3. Weaknesses
- 15.4. Opportunities
- 15.5. Threats
- 15.6. Concluding Remarks
16. CONCLUSION
- 16.1. Chapter Overview
- 16.2. Key Takeaways
17. SURVEY / INTERVIEW TRANSCRIPTS
18. APPENDIX 1: TABULATED DATA
19. APPENDIX 2: LIST OF COMPANIES AND ORGANIZATIONS
List of Tables
- Table 4.1 Device Classification: US
- Table 4.2 Device Classification: Canada
- Table 4.3 HTA Processes in Canada: Provincial Requirements
- Table 4.4 Regulatory Bodies in EU5 Countries
- Table 4.5 Device Classification: Europe
- Table 4.6 List of CE Directives in Europe
- Table 4.7 Conformity Assessment Modules in Europe
- Table 4.8 Device Classification: Japan
- Table 4.9 Device Classification: China
- Table 4.10 Device Classification: Australia
- Table 4.11 Medical Devices: Regulatory Landscape Summary
- Table 5.1 List of Medical Device CMOs Offering Services for Therapeutic Devices
- Table 5.2 Medical Device CMOs Offering Services for Therapeutic Devices: Information on Regulatory Certifications / Accreditations
- Table 5.3 Medical Device CMOs Offering Services for Therapeutic Devices: Information on Manufacturing Services
- Table 5.4 Medical Device CMOs Offering Services for Therapeutic Devices: Information on Post-Production Services
- Table 5.5 Medical Device CMOs Offering Services for Therapeutic Devices: Information on Other Services
- Table 5.6 Medical Device CMOs Offering Services for Therapeutic Devices: Information on Device Class
- Table 5.7 Medical Device CMOs Offering Services for Therapeutic Devices: Information on Type of Material(s) Handled
- Table 5.8 Medical Device CMOs Offering Services for Therapeutic Devices: Information on Scale of Operation
- Table 6.1 List of Medical Device CMOs Offering Services for Diagnostic Devices
- Table 6.2 Medical Device CMOs Offering Services for Diagnostic Devices: Information on Regulatory Certifications / Accreditations
- Table 6.3 Medical Device CMOs Offering Services for Diagnostic Devices: Information on Manufacturing Services
- Table 6.4 Medical Device CMOs Offering Services for Diagnostic Devices: Information on Post-Production Services
- Table 6.5 Medical Device CMOs Offering Services for Diagnostic Devices: Information on Other Services
- Table 6.6 Medical Device CMOs Offering Services for Diagnostic Devices: Information on Device Class
- Table 6.7 Medical Device CMOs Offering Services for Diagnostic Devices: Information on Type of Material(s) Handled
- Table 6.8 Medical Device CMOs Offering Services for Diagnostic Devices: Information on Scale of Operations
- Table 7.1 List of Medical Device CMOs Offering Services for Drug Delivery Devices
- Table 7.2 Medical Device CMOs Offering Services for Drug Delivery Devices: Information on Regulatory Certifications / Accreditations
- Table 7.3 Medical Device CMOs Offering Services for Drug Delivery Devices: Information on Manufacturing Services
- Table 7.4 Medical Device CMOs Offering Services for Drug Delivery Devices: Information on Post-Production Services
- Table 7.5 Medical Device CMOs Offering Services for Drug Delivery Devices: Information on Other Services
- Table 7.6 Medical Device CMOs Offering Services for Drug Delivery Devices: Information on Device Class
- Table 7.7 Medical Device CMOs Offering Services for Drug Delivery Devices: Information on Type of Material(s) Handled
- Table 7.8 Medical Device CMOs Offering Services for Drug Delivery Devices: Information on Scale of Operations
- Table 7.9 List of Medical Device CMOs Offering Services for Other Devices
- Table 7.10 Medical Device CMOs Offering Services for Other Devices: Information on Regulatory Certifications / Accreditations
- Table 7.11 Medical Device CMOs Offering Services for Other Devices: Information on Manufacturing Services
- Table 7.12 Medical Device CMOs Offering Services for Other Devices: Information on Post-Production Services
- Table 7.13 Medical Device CMOs Offering Services for Other Devices: Information on Other Services
- Table 7.14 Medical Device CMOs Offering Services for Other Devices: Information on Device Class
- Table 7.15 Medical Device CMOs Offering Services for Other Devices: Information on Type of Material(s) Handled
- Table 7.16 Medical Device CMOs Offering Services for Other Devices: Information on Scale of Operations
- Table 8.1 Benchmark Analysis: Peer Groups
- Table 10.1 Cirtec Medical: Company Overview
- Table 10.2 DynaFlex Technologies: Company Overview
- Table 10.3 I-Tek Medical Technologies: Company Overview
- Table 10.4 Keystone Solutions Group: Company Overview
- Table 10.5 Oscor: Company Overview
- Table 10.6 SMC: Company Overview
- Table 10.7 Stellartech: Company Overview
- Table 10.8 Creganna Medical: Company Overview
- Table 10.9 Europlaz Technologies: Company Overview
- Table 10.10 Riverside Medical Packaging: Company Overview
- Table 10.11 Synecco: Post-production Company Overview
- Table 10.12 Trelleborg Sealing Solutions: Company Overview
- Table 10.13 Interplex: Company Overview
- Table 10.14 Modern Medical: Company Overview
- Table 10.15 Providence Enterprise: Company Overview
- Table 10.16 Suzhou Jenitek: Company Overview
- Table 12.1 Medical Device Contract Manufacturing: List of Mergers and Acquisitions, Since 2014
- Table 12.2 Mergers and Acquisitions: Key Value Drivers and Type of Devices, Since 2014
- Table 12.3 Mergers and Acquisitions: Deal Multiples, Since 2013
- Table 13.1 Comparative Analysis between Developed and Developing Nations
- Table 13.2 Medtech A: Company Overview
- Table 13.3 Medtech A: Operational Values
- Table 13.4 Medtech B: Company Overview
- Table 13.5 Medtech A: Operational Values
- Table 18.1 Medical Device CMOs Offering Services for Therapeutic Devices: Distribution by Year of Establishment
- Table 18.2 Medical Device CMOs Offering Services for Therapeutic Devices: Distribution by Size of Employee Base
- Table 18.3 Medical Device CMOs Offering Services for Therapeutic Devices: Distribution by Location of Headquarters
- Table 18.4 Medical Device CMOs Offering Services for Therapeutic Devices: Distribution by Location of Manufacturing Facility
- Table 18.5 Medical Device CMOs Offering Services for Therapeutic Devices: Distribution by Regulatory Certifications / Accreditations
- Table 18.6 Medical Device CMOs Offering Services for Therapeutic Devices: Distribution by Manufacturing Services Offered
- Table 18.7 Medical Device CMOs Offering Services for Therapeutic Devices: Distribution by Post-Production Services Offered
- Table 18.8 Medical Device CMOs Offering Services for Therapeutic Devices: Distribution by Other Services Offered
- Table 18.9 Medical Device CMOs Offering Services for Therapeutic Devices: Distribution by Device Class
- Table 18.10 Medical Device CMOs Offering Services for Therapeutic Devices: Distribution by Type of Material(s) Handled
- Table 18.11 Medical Device CMOs Offering Services for Therapeutic Devices: Distribution by Scale of Operation
- Table 18.12 Medical Device CMOs Offering Services for Diagnostic Devices: Distribution by Year of Establishment
- Table 18.13 Medical Device CMOs Offering Services for Diagnostic Devices: Distribution by Size of Employee Base
- Table 18.14 Medical Device CMOs Offering Services for Diagnostic Devices: Distribution by Location of Headquarters
- Table 18.15 Medical Device CMOs Offering Services for Diagnostic Devices: Distribution by Location of Manufacturing Facility
- Table 18.16 Medical Device CMOs Offering Services for Diagnostic Devices: Distribution by Regulatory Certifications / Accreditations
- Table 18.17 Medical Device CMOs Offering Services for Diagnostic Devices: Distribution by Manufacturing Services Offered
- Table 18.18 Medical Device CMOs Offering Services for Diagnostic Devices: Distribution by Post-Production Services Offered
- Table 18.19 Medical Device CMOs Offering Services for Diagnostic Devices: Distribution by Other Services Offered
- Table 18.20 Medical Device CMOs Offering Services for Diagnostic Devices: Distribution by Device Class
- Table 18.21 Medical Device CMOs Offering Services for Diagnostic Devices: Distribution by Type of Material(s) Handled
- Table 18.22 Medical Device CMOs Offering Services for Diagnostic Devices: Distribution by Scale of Operation
- Table 18.23 Medical Device CMOs Offering Services for Drug Delivery Devices: Distribution by Year of Establishment
- Table 18.24 Medical Device CMOs Offering Services for Drug Delivery Devices: Distribution by Size of Employee Base
- Table 18.25 Medical Device CMOs Offering Services for Drug Delivery Devices: Distribution by Location of Headquarters
- Table 18.26 Medical Device CMOs Offering Services for Drug Delivery Devices: Distribution by Location of Manufacturing Facility
- Table 18.27 Medical Device CMOs Offering Services for Drug Delivery Devices: Distribution by Regulatory Certifications / Accreditations
- Table 18.28 Medical Device CMOs Offering Services for Drug Delivery Devices: Distribution by Manufacturing Services Offered
- Table 18.29 Medical Device CMOs Offering Services for Drug Delivery Devices: Distribution by Post-Production Services Offered
- Table 18.30 Medical Device CMOs Offering Services for Drug Delivery Devices: Distribution by Other Services Offered
- Table 18.31 Medical Device CMOs Offering Services for Drug Delivery Devices: Distribution by Device Class
- Table 18.32 Medical Device CMOs Offering Services for Drug Delivery Devices: Distribution by Type of Material(s) Handled
- Table 18.33 Medical Device CMOs Offering Services for Drug Delivery Devices: Distribution by Scale of Operation
- Table 18.34 Medical Device CMOs Offering Services for Other Devices: Distribution by Year of Establishment
- Table 18.35 Medical Device CMOs Offering Services for Other Devices: Distribution by Size of Employee Base
- Table 18.36 Medical Device CMOs Offering Services for Other Devices: Distribution by Location of Headquarters
- Table 18.37 Medical Device CMOs Offering Services for Other Devices: Distribution by Location of Manufacturing Facility
- Table 18.38 Medical Device CMOs Offering Services for Other Devices: Distribution by Regulatory Certifications / Accreditations
- Table 18.39 Medical Device CMOs Offering Services for Other Devices: Distribution by Manufacturing Services Offered
- Table 18.40 Medical Device CMOs Offering Services for Other Devices: Distribution by Post-Production Services Offered
- Table 18.41 Medical Device CMOs Offering Services for Other Devices: Distribution by Other Services Offered
- Table 18.42 Medical Device CMOs Offering Services for Other Devices: Distribution by Device Class
- Table 18.43 Medical Device CMOs Offering Services for Other Devices: Distribution by Type of Material(s) Handled
- Table 18.44 Medical Device CMOs Offering Services for Other Devices: Distribution by Scale of Operation
- Table 18.45 Benchmark Analysis: Distribution by Region and Size of Employee Base
- Table 18.46 Clinical Trial Analysis: Distribution by Trial Start Year, Since 2018
- Table 18.47 Clinical Trial Analysis: Distribution by Trial Status
- Table 18.48 Clinical Trial Analysis: Distribution by Phase of Development
- Table 18.49 Clinical Trial Analysis: Top 10 Target Indication
- Table 18.50 Clinical Trial Analysis: Distribution by Sponsor Type
- Table 18.51 Clinical Trial Analysis: Distribution by Trial Start Year and Geography, Since 2018
- Table 18.52 Enrolled Patient Population: Distribution by Trial Status
- Table 18.53 Enrolled Patient Population: Distribution by Phase of Development
- Table 18.54 Clinical Trial Analysis: Distribution by Focus Therapeutic Areas
- Table 18.55 Heat Map Analysis: Emerging Therapeutic Areas
- Table 18.56 Clinical Trial Analysis: Distribution by Type of Sponsor and Top 10 Therapeutic Areas
- Table 18.57 Clinical Trial Analysis: Prominent Therapeutic Areas in North America
- Table 18.58 Clinical Trial Analysis: Prominent Therapeutic Areas in Europe
- Table 18.59 Clinical Trial Analysis: Prominent Therapeutic Areas in Asia Pacific
- Table 18.60 Clinical Trial Analysis: Prominent Therapeutic Areas in Rest of the World
- Table 18.61 Clinical Trials for Cardiovascular Disorders: Distribution by Trial Start Year, Since 2018
- Table 18.62 Clinical Trials for Cardiovascular Disorders: Distribution by Sponsor Type
- Table 18.63 Clinical Trials for Cardiovascular Disorders: Distribution by Geography
- Table 18.64 Clinical Trials for Oncological Disorders: Distribution of Trials by Start Year, Since 2018
- Table 18.65 Clinical Trials for Oncological Disorders: Distribution by Sponsor Type
- Table 18.66 Clinical Trials for Oncological Disorders: Distribution by Geography
- Table 18.67 Clinical Trials for CNS Disorders: Distribution of Trials by Start Year, Since 2018
- Table 18.68 Clinical Trials for CNS Disorders: Distribution by Sponsor Type
- Table 18.69 Clinical Trials for CNS Disorders: Distribution by Geography
- Table 18.70 Clinical Trials for Orthopedic Disorders: Distribution of Trials by Start Year, Since 2018
- Table 18.71 Clinical Trials for Orthopedic Disorders: Distribution by Sponsor Type
- Table 18.72 Clinical Trials for Orthopedic Disorders: Distribution by Geography
- Table 18.73 Clinical Trials for Respiratory Disorders: Distribution of Trials by Start Year, Since 2018
- Table 18.74 Clinical Trials for Respiratory Disorders: Distribution by Sponsor Type
- Table 18.75 Clinical Trials for Respiratory Disorders: Distribution by Geography
- Table 18.76 Mergers and Acquisitions: Year-Wise Cumulative Trend, Since 2018
- Table 18.77 Mergers and Acquisitions: Distribution by Type of Acquisitions
- Table 18.78 Acquisitions: Most Active Acquirers
- Table 18.79 Mergers and Acquisitions: Key Value Drivers
- Table 18.80 Mergers and Acquisitions: Distribution by Key Value Drivers and Year of Acquisition
- Table 18.81 Mergers and Acquisitions: Distribution by Type of Devices
- Table 18.82 Mergers and Acquisitions: Distribution by Therapeutic Area
- Table 18.83 Mergers and Acquisitions: Distribution by Services Offered
- Table 18.84 Acquisitions: Country-wise Distribution
- Table 18.85 Overall Medical Device CMOs Market, Base Scenario, till 2035 (USD Billion)
- Table 18.86 Medical Device CMOs Market for Therapeutic Devices, Base Scenario, till 2035 (USD Billion)
- Table 18.87 Medical Device CMOs Market for Diagnostic Devices, Base Scenario, till 2035 (USD Billion)
- Table 18.88 Medical Device CMOs Market for Drug Delivery Devices, Base Scenario, till 2035 (USD Billion)
- Table 18.89 Medical Device CMOs Market for Other Devices, Base Scenario, till 2035 (USD Billion)
- Table 18.90 Medical Device CMOs Market for Class I Devices, Base Scenario, till 2035 (USD Billion)
- Table 18.91 Medical Device CMOs Market for Class II Devices, Base Scenario, till 2035 (USD Billion)
- Table 18.92 Medical Device CMOs Market for Class III Devices, Base Scenario, till 2035 (USD Billion)
- Table 18.93 Medical Device CMOs Market: Leading Players, till 2035 (USD Billion)
- Table 18.94 Medical Device CMOs Market for Cardiovascular Disorders, Base Scenario, till 2035 (USD Billion)
- Table 18.95 Medical Device CMOs Market for CNS Disorders, Base Scenario, till 2035 (USD Billion)
- Table 18.96 Medical Device CMOs Market for Metabolic Disorders, Base Scenario, till 2035 (USD Billion)
- Table 18.97 Medical Device CMOs Market for Oncological Disorders, Base Scenario, till 2035 (USD Billion)
- Table 18.98 Medical Device CMOs Market for Orthopedic Disorders, Base Scenario, till 2035 (USD Billion)
- Table 18.99 Medical Device CMOs Market for Ophthalmic Disorders, Base Scenario, till 2035 (USD Billion)
- Table 18.100 Medical Device CMOs Market for Pain Disorders, Base Scenario, till 2035 (USD Billion)
- Table 18.101 Medical Device CMOs Market for Respiratory Disorders, Base Scenario, till 2035 (USD Billion)
- Table 18.102 Medical Device CMOs Market for Other Therapeutic Areas, Base Scenario, till 2035 (USD Billion)
- Table 18.103 Medical Device CMOs Market in North America, Base Scenario, till 2035 (USD Billion)
- Table 18.104 Medical Device CMOs Market in the US, till 2035 (USD Billion)
- Table 18.105 Medical Device CMOs Market in Rest of North America, till 2035 (USD Billion)
- Table 18.106 Medical Device CMOs Market for Class I Devices in North America, Base Scenario, till 2035 (USD Billion)
- Table 18.107 Medical Device CMOs Market for Class II Devices in North America, Base Scenario, till 2035 (USD Billion)
- Table 18.108 Medical Device CMOs Market for Class III Devices in North America, Base Scenario, till 2035 (USD Billion)
- Table 18.109 Medical Device CMOs Market for Cardiovascular Disorders in North America, Base Scenario, till 2035 (USD Billion)
- Table 18.110 Medical Device CMOs Market for CNS Disorders in North America, Base Scenario, till 2035 (USD Billion)
- Table 18.111 Medical Device CMOs Market for Metabolic Disorders in North America, Base Scenario, till 2035 (USD Billion)
- Table 18.112 Medical Device CMOs Market for Oncological Disorders in North America, Base Scenario, till 2035 (USD Billion)
- Table 18.113 Medical Device CMOs Market for Orthopedic Disorders in North America, Base Scenario, till 2035 (USD Billion)
- Table 18.114 Medical Device CMOs Market for Ophthalmic Disorders in North America, Base Scenario, till 2035 (USD Billion)
- Table 18.115 Medical Device CMOs Market for Pain Disorders in North America, Base Scenario, till 2035 (USD Billion)
- Table 18.116 Medical Device CMOs Market for Respiratory Disorders in North America, Base Scenario, till 2035 (USD Billion)
- Table 18.117 Medical Device CMOs Market for Other Therapeutic Areas in North America, Base Scenario, till 2035 (USD Billion)
- Table 18.118 Medical Device CMOs Market in Europe, Base Scenario, till 2035 (USD Billion)
- Table 18.119 Medical Device CMOs Market in Italy, Base Scenario, till 2035 (USD Billion)
- Table 18.120 Medical Device CMOs Market in Germany, Base Scenario, till 2035 (USD Billion)
- Table 18.121 Medical Device CMOs Market in France, Base Scenario, till 2035 (USD Billion)
- Table 18.122 Medical Device CMOs Market in Spain, Base Scenario, till 2035 (USD Billion)
- Table 18.123 Medical Device CMOs Market in the UK, Base Scenario, till 2035 (USD Billion)
- Table 18.124 Medical Device CMOs Market in Rest of Europe, Base Scenario, till 2035 (USD Billion)
- Table 18.125 Medical Device CMOs Market for Class I Devices in Europe, Base Scenario, till 2035 (USD Billion)
- Table 18.126 Medical Device CMOs Market for Class II Devices in Europe, Base Scenario, till 2035 (USD Billion)
- Table 18.127 Medical Device CMOs Market for Class III Devices in Europe, Base Scenario, till 2035 (USD Billion)
- Table 18.128 Medical Device CMOs Market for Cardiovascular Disorders in Europe, Base Scenario, till 2035 (USD Billion)
- Table 18.129 Medical Device CMOs Market for CNS Disorders in Europe, Base Scenario, till 2035 (USD Billion)
- Table 18.130 Medical Device CMOs Market for Metabolic Disorders in Europe, Base Scenario, till 2035 (USD Billion)
- Table 18.131 Medical Device CMOs Market of Oncological Disorders in Europe, Base Scenario, till 2035 (USD Billion)
- Table 18.132 Medical Device CMOs Market for Orthopedic Disorders in Europe, Base Scenario, till 2035 (USD Billion)
- Table 18.133 Medical Device CMOs Market for Ophthalmic Disorders in Europe, Base Scenario, till 2035 (USD Billion)
- Table 18.134 Medical Device CMOs Market for Pain Disorders in Europe, Base Scenario, till 2035 (USD Billion)
- Table 18.135 Medical Device CMOs Market for Respiratory Disorders in Europe, Base Scenario, till 2035 (USD Billion)
- Table 18.136 Medical Device CMOs Market for Other Therapeutic Areas in Europe, Base Scenario, till 2035 (USD Billion)
- Table 18.137 Medical Device CMOs Market in Asia and Rest of the World, Base Scenario, till 2035 (USD Billion)
- Table 18.138 Medical Device CMOs Market in China, Base Scenario, till 2035 (USD Billion)
- Table 18.139 Medical Device CMOs Market in Japan, Base Scenario, till 2035 (USD Billion)
- Table 18.140 Medical Device CMOs Market in India, Base Scenario, till 2035 (USD Billion)
- Table 18.141 Medical Device CMOs Market in Rest of Asia and Rest of the World, Base Scenario, till 2035 (USD Billion)
- Table 18.142 Medical Device CMOs Market for Class I Devices in Asia and Rest of the World, Base Scenario, till 2035 (USD Billion)
- Table 18.143 Medical Device CMOs Market for Class II Devices in Asia and Rest of the World, Base Scenario, till 2035 (USD Billion)
- Table 18.144 Medical Device CMOs Market for Class III Devices in Asia and Rest of the World, Base Scenario, till 2035 (USD Billion)
- Table 18.145 Medical Device CMOs Market for Cardiovascular Disorders in Asia and Rest of the World, Base Scenario, till 2035 (USD Billion)
- Table 18.146 Medical Device CMOs Market for CNS Disorders in Asia and Rest of the World, Base Scenario, till 2035 (USD Billion)
- Table 18.147 Medical Device CMOs Market for Metabolic Disorders in Asia and Rest of the World, Base Scenario, till 2035 (USD Billion)
- Table 18.148 Medical Device CMOs Market for Oncological Disorders in Asia and Rest of the World, Base Scenario, till 2035 (USD Billion)
- Table 18.149 Medical Device CMOs Market for Orthopedic Disorders in Asia and Rest of the World, Base Scenario, till 2035 (USD Billion)
- Table 18.150 Medical Device CMOs Market for Ophthalmic Disorders in Asia and Rest of the World, Base Scenario, till 2035 (USD Billion)
- Table 18.151 Medical Device CMOs Market for Pain Disorders in Asia and Rest of the World, Base Scenario, till 2035 (USD Billion)
- Table 18.152 Medical Device CMOs Market for Respiratory Disorders in Asia and Rest of the World, Base Scenario, till 2035 (USD Billion)
- Table 18.153 Medical Device CMOs Market for Other Therapeutic Areas in Asia and Rest of the World, Base Scenario, till 2035 (USD Billion)
List of Figures
- Figure 3.1 Historical Evolution of Medical Devices
- Figure 3.2 Medical Device Manufacturing Process
- Figure 3.3 Challenges Associated with Medical Device Manufacturing
- Figure 3.4 Advantages of Automation
- Figure 3.5 Services Offered by CMOs
- Figure 3.6 Advantages of Outsourcing to CMOs
- Figure 3.7 Risks Associated with Outsourcing to CMOs
- Figure 3.8 Key Considerations for Selecting a CMO Partner
- Figure 4.1 US FDA: Review / Approval Process
- Figure 4.2 Health Canada: Review / Approval Process
- Figure 4.3 Summary of CE Marking Process
- Figure 4.4 Pharmaceuticals and Medical Devices Agency: Review / Approval Process
- Figure 4.5 China Food and Drug Administration: Review / Approval Process
- Figure 4.6 Therapeutic Goods Administration: Review / Approval Process
- Figure 4.7 Bubble Analysis: Regional Regulatory Environment
- Figure 5.1 Medical Device CMOs Offering Services for Therapeutic Devices: Distribution by Year of Establishment
- Figure 5.2 Medical Device CMOs Offering Services for Therapeutic Devices: Distribution by Size of Employee Base
- Figure 5.3 Medical Device CMOs Offering Services for Therapeutic Devices: Distribution by Location of Headquarters
- Figure 5.4 Medical Device CMOs Offering Services for Therapeutic Devices: Distribution by Location of Manufacturing Facility
- Figure 5.5 Medical Device CMOs Offering Services for Therapeutic Devices: Distribution by Regulatory Certifications / Accreditations
- Figure 5.6 Medical Device CMOs Offering Services for Therapeutic Devices: Distribution by Manufacturing Services Offered
- Figure 5.7 Medical Device CMOs Offering Services for Therapeutic Devices: Distribution by Post-Production Services Offered
- Figure 5.8 Medical Device CMOs Offering Services for Therapeutic Devices: Distribution by Other Services Offered
- Figure 5.9 Medical Device CMOs Offering Services for Therapeutic Devices: Distribution by Device Class
- Figure 5.10 Medical Device CMOs Offering Services for Therapeutic Devices: Distribution by Type of Material(s) Handled
- Figure 5.11 Medical Device CMOs Offering Services for Therapeutic Devices: Distribution by Scale of Operation
- Figure 6.1 Medical Device CMOs Offering Services for Diagnostic Devices: Distribution by Year of Establishment
- Figure 6.2 Medical Device CMOs Offering Services for Diagnostic Devices: Distribution by Size of Employee Base
- Figure 6.3 Medical Device CMOs Offering Services for Diagnostic Devices: Distribution by Location of Headquarters
- Figure 6.4 Medical Device CMOs Offering Services for Diagnostic Devices: Distribution by Location of Manufacturing Facility
- Figure 6.5 Medical Device CMOs Offering Services for Diagnostic Devices: Distribution by Regulatory Certifications / Accreditations
- Figure 6.6 Medical Device CMOs Offering Services for Diagnostic Devices: Distribution by Manufacturing Services Offered
- Figure 6.7 Medical Device CMOs Offering Services for Diagnostic Devices: Distribution by Post-Production Services Offered
- Figure 6.8 Medical Device CMOs Offering Services for Diagnostic Devices: Distribution by Other Services Offered
- Figure 6.9 Medical Device CMOs Offering Services for Diagnostic Devices: Distribution by Device Class
- Figure 6.10 Medical Device CMOs Offering Services for Diagnostic Devices: Distribution by Type of Material(s) Handled
- Figure 6.11 Medical Device CMOs Offering Services for Diagnostic Devices: Distribution by Scale of Operation
- Figure 7.1 Medical Device CMOs Offering Services for Drug Delivery Devices: Distribution by Year of Establishment
- Figure 7.2 Medical Device CMOs Offering Services for Drug Delivery Devices: Distribution by Size of Employee Base
- Figure 7.3 Medical Device CMOs Offering Services for Drug Delivery Devices: Distribution by Location of Headquarters
- Figure 7.4 Medical Device CMOs Offering Services for Drug Delivery Devices: Distribution by Location of Manufacturing Facility
- Figure 7.5 Medical Device CMOs Offering Services for Drug Delivery Devices: Distribution by Regulatory Certifications / Accreditations
- Figure 7.6 Medical Device CMOs Offering Services for Drug Delivery Devices: Distribution by Manufacturing Services Offered
- Figure 7.7 Medical Device CMOs Offering Services for Drug Delivery Devices: Distribution by Post-Production Services Offered
- Figure 7.8 Medical Device CMOs Offering Services for Drug Delivery Devices: Distribution by Other Services Offered
- Figure 7.9 Medical Device CMOs Offering Services for Drug Delivery Devices: Distribution by Device Class
- Figure 7.10 Medical Device CMOs Offering Services for Drug Delivery Devices: Distribution by Type of Material(s) Handled
- Figure 7.11 Medical Device CMOs Offering Services for Drug Delivery Devices: Distribution by Scale of Operation
- Figure 7.12 Medical Device CMOs Offering Services for Other Devices: Distribution by Year of Establishment
- Figure 7.13 Medical Device CMOs Offering Services for Other Devices: Distribution by Size of Employee Base
- Figure 7.14 Medical Device CMOs Offering Services for Other Devices: Distribution by Location of Headquarters
- Figure 7.15 Medical Device CMOs Offering Services for Other Devices: Distribution by Location of Manufacturing Facility
- Figure 7.16 Medical Device CMOs Offering Services for Other Devices: Distribution by Regulatory Certifications / Accreditations
- Figure 7.17 Medical Device CMOs Offering Services for Other Devices: Distribution by Manufacturing Services Offered
- Figure 7.18 Medical Device CMOs Offering Services for Other Devices: Distribution by Post-Production Services Offered
- Figure 7.19 Medical Device CMOs Offering Services for Other Devices: Distribution by Other Services Offered
- Figure 7.20 Medical Device CMOs Offering Services for Other Devices: Distribution by Device Class
- Figure 7.21 Medical Device CMOs Offering Services for Other Devices: Distribution by Type of Material(s) Handled
- Figure 7.22 Medical Device CMOs Offering Services for Other Devices: Distribution by Scale of Operation
- Figure 8.1 Benchmark Analysis: Distribution by Region and Size of Employee Base
- Figure 8.2 Benchmark Analysis: North America, Peer Group I
- Figure 8.3 Benchmark Analysis: North America, Peer Group II
- Figure 8.4 Benchmark Analysis: North America, Peer Group III
- Figure 8.5 Benchmark Analysis: North America, Peer Group IV
- Figure 8.6 Benchmark Analysis: North America, Peer Group V
- Figure 8.7 Benchmark Analysis: North America, Peer Group VI
- Figure 8.8 Benchmark Analysis: North America, Peer Group VII
- Figure 8.9 Benchmark Analysis: Europe, Peer Group VIII
- Figure 8.10 Benchmark Analysis: Europe, Peer Group IX
- Figure 8.11 Benchmark Analysis: Europe, Peer Group X
- Figure 8.12 Benchmark Analysis: Asia, Peer Group XI
- Figure 11.10 Enrolled Patient Population: Distribution by Phase of Development
- Figure 11.11 Enrolled Patient Population: Distribution by Geography
- Figure 11.12 Clinical Trial Analysis: Distribution by Focus Therapeutic Areas
- Figure 11.13 Heat Map Analysis: Emerging Therapeutic Areas
- Figure 11.14 Clinical Trial Analysis: Distribution by Type of Sponsor and Top 10 Therapeutic Areas
- Figure 11.15 Clinical Trial Analysis: Prominent Therapeutic Areas in North America
- Figure 11.16 Clinical Trial Analysis: Prominent Therapeutic Areas in Europe
- Figure 11.17 Clinical Trial Analysis: Prominent Therapeutic Areas in Asia Pacific
- Figure 11.18 Clinical Trial Analysis: Prominent Therapeutic Areas in Rest of the World
- Figure 11.19 Clinical Trials for Cardiovascular Disorders: Distribution by Trial Start Year, Since 2018
- Figure 11.20 Clinical Trials for Cardiovascular Disorders: Distribution by Sponsor Type
- Figure 11.21 Clinical Trials for Cardiovascular Disorders: Distribution by Geography
- Figure 11.22 Clinical Trials for Oncological Disorders: Distribution of Trials by Start Year, Since 2018
- Figure 11.23 Clinical Trials for Oncological Disorders: Distribution by Sponsor Type
- Figure 11.24 Clinical Trials for Oncological Disorders: Distribution by Geography
- Figure 11.25 Clinical Trials for CNS Disorders: Distribution of Trials by Start Year, Since 2018
- Figure 11.26 Clinical Trials for CNS Disorders: Distribution by Sponsor Type
- Figure 11.27 Clinical Trials for CNS Disorders: Distribution by Geography
- Figure 11.28 Clinical Trials for Orthopedic Disorders: Distribution of Trials by Start Year, Since 2018
- Figure 11.29 Clinical Trials for Orthopedic Disorders: Distribution by Sponsor Type
- Figure 11.30 Clinical Trials for Orthopedic Disorders: Distribution by Geography
- Figure 11.31 Clinical Trials for Respiratory Disorders: Distribution of Trials by Start Year, Since 2018
- Figure 11.32 Clinical Trials for Respiratory Disorders: Distribution by Sponsor Type
- Figure 11.33 Clinical Trials for Respiratory Disorders: Distribution by Geography
- Figure 12.1 Mergers and Acquisitions: Year-Wise Cumulative Trend, Since 2018
- Figure 12.2 Mergers and Acquisitions: Distribution by Type of Acquisitions
- Figure 12.3 Most Active Acquirers: Distribution by Number of Acquisitions
- Figure 12.4 Mergers and Acquisitions: Key Value Drivers
- Figure 12.5 Mergers and Acquisitions: Distribution by Key Value Drivers and Year of Acquisition
- Figure 12.6 Mergers and Acquisitions: Distribution by Type of Device
- Figure 12.7 Heat Map Analysis: Type of Devices and Key Value Drivers
- Figure 12.8 Mergers and Acquisitions: Distribution by Therapeutic Area
- Figure 12.9 Mergers and Acquisitions: Distribution by Services Offered
- Figure 12.10 Acquisitions: Continental Distribution
- Figure 12.11 Acquisitions: Country-wise Distribution
- Figure 12.12 Acquisitions: Intercontinental and Intracontinental Acquisitions
- Figure 12.13 Mergers and Acquisitions: Relationship between Deal Multiples
- Figure 13.1 Prominent Emerging Markets
- Figure 13.2 Recommendations to Optimize Manufacturing Strategies
- Figure 14.1 Overall Medical Device CMOs Market, Base Scenario, till 2035 (USD Billion)
- Figure 14.2 Medical Device CMOs Market for Therapeutic Devices, Base Scenario, till 2035 (USD Billion)
- Figure 14.3 Medical Device CMOs Market for Diagnostic Devices, Base Scenario, till 2035 (USD Billion)
- Figure 14.4 Medical Device CMOs Market for Drug Delivery Devices, Base Scenario, till 2035 (USD Billion)
- Figure 14.5 Medical Device CMOs Market for Other Devices, Base Scenario, till 2035 (USD Billion)
- Figure 14.6 Medical Device CMOs Market for Class I Devices, Base Scenario, till 2035 (USD Billion)
- Figure 14.7 Medical Device CMOs Market for Class II Devices, Base Scenario, till 2035 (USD Billion)
- Figure 14.8 Medical Device CMOs Market for Class III Devices, Base Scenario, till 2035 (USD Billion)
- Figure 14.9 Medical Device CMOs Market: Leading Players, till 2035 (USD Billion)
- Figure 14.10 Medical Device CMOs Market for Cardiovascular Disorders, Base Scenario, till 2035 (USD Billion)
- Figure 14.11 Medical Device CMOs Market for CNS Disorders, Base Scenario, till 2035 (USD Billion)
- Figure 14.12 Medical Device CMOs Market for Metabolic Disorders, Base Scenario, till 2035 (USD Billion)
- Figure 14.13 Medical Device CMOs Market for Oncological Disorders, Base Scenario, till 2035 (USD Billion)
- Figure 14.14 Medical Device CMOs Market for Orthopedic Disorders, Base Scenario, till 2035 (USD Billion)
- Figure 14.15 Medical Device CMOs Market for Ophthalmic Disorders, Base Scenario, till 2035 (USD Billion)
- Figure 14.16 Medical Device CMOs Market for Pain Disorders, Base Scenario, till 2035 (USD Billion)
- Figure 14.17 Medical Device CMOs Market for Respiratory Disorders, Base Scenario, till 2035 (USD Billion)
- Figure 14.18 Medical Device CMOs Market for Other Therapeutic Areas, Base Scenario, till 2035 (USD Billion)
- Figure 14.19 Medical Device CMOs Market in North America, Base Scenario, till 2035 (USD Billion)
- Figure 14.20 Medical Device CMOs Market in the US, till 2035 (USD Billion)
- Figure 14.21 Medical Device CMOs Market in Rest of North America, till 2035 (USD Billion)
- Figure 14.22 Medical Device CMOs Market for Class I Devices in North America, Base Scenario, till 2035 (USD Billion)
- Figure 14.23 Medical Device CMOs Market for Class II Devices in North America, Base Scenario, till 2035 (USD Billion)
- Figure 14.24 Medical Device CMOs Market for Class III Devices in North America, Base Scenario, till 2035 (USD Billion)
- Figure 14.25 Medical Device CMOs Market for Cardiovascular Disorders in North America, Base Scenario, till 2035 (USD Billion)
- Figure 14.26 Medical Device CMOs Market for CNS Disorders in North America, Base Scenario, till 2035 (USD Billion)
- Figure 14.27 Medical Device CMOs Market for Metabolic Disorders in North America, Base Scenario, till 2035 (USD Billion)
- Figure 14.28 Medical Device CMOs Market for Oncological Disorders in North America, Base Scenario, till 2035 (USD Billion)
- Figure 14.29 Medical Device CMOs Market for Orthopedic Disorders in North America, Base Scenario, till 2035 (USD Billion)
- Figure 14.30 Medical Device CMOs Market for Ophthalmic Disorders in North America, Base Scenario, till 2035 (USD Billion)
- Figure 14.31 Medical Device CMOs Market for Pain Disorders in North America, Base Scenario, till 2035 (USD Billion)
- Figure 14.32 Medical Device CMOs Market for Respiratory Disorders in North America, Base Scenario, till 2035 (USD Billion)
- Figure 14.33 Medical Device CMOs Market for Other Therapeutic Areas in North America, Base Scenario, till 2035 (USD Billion)
- Figure 14.34 Medical Device CMOs Market in Europe, Base Scenario, till 2035 (USD Billion)
- Figure 14.35 Medical Device CMOs Market in Italy, Base Scenario, till 2035 (USD Billion)
- Figure 14.36 Medical Device CMOs Market in Germany, Base Scenario, till 2035 (USD Billion)
- Figure 14.37 Medical Device CMOs Market in France, Base Scenario, till 2035 (USD Billion)
- Figure 14.38 Medical Device CMOs Market in Spain, Base Scenario, till 2035 (USD Billion)
- Figure 14.39 Medical Device CMOs Market in the UK, Base Scenario, till 2035 (USD Billion)
- Figure 14.40 Medical Device CMOs Market in Rest of Europe, Base Scenario, till 2035 (USD Billion)
- Figure 14.41 Medical Device CMOs Market for Class I Devices in Europe, Base Scenario, till 2035 (USD Billion)
- Figure 14.42 Medical Device CMOs Market for Class II Devices in Europe, Base Scenario, till 2035 (USD Billion)
- Figure 14.43 Medical Device CMOs Market for Class III Devices in Europe, Base Scenario, till 2035 (USD Billion)
- Figure 14.44 Medical Device CMOs Market for Cardiovascular Disorders in Europe, Base Scenario, till 2035 (USD Billion)
- Figure 14.45 Medical Device CMOs Market for CNS Disorders in Europe, Base Scenario, till 2035 (USD Billion)
- Figure 14.46 Medical Device CMOs Market for Metabolic Disorders in Europe, Base Scenario, till 2035 (USD Billion)
- Figure 14.47 Medical Device CMOs Market of Oncological Disorders in Europe, Base Scenario, till 2035 (USD Billion)
- Figure 14.48 Medical Device CMOs Market for Orthopedic Disorders in Europe, Base Scenario, till 2035 (USD Billion)
- Figure 14.49 Medical Device CMOs Market for Ophthalmic Disorders in Europe, Base Scenario, till 2035 (USD Billion)
- Figure 14.50 Medical Device CMOs Market for Pain Disorders in Europe, Base Scenario, till 2035 (USD Billion)
- Figure 14.51 Medical Device CMOs Market for Respiratory Disorders in Europe, Base Scenario, till 2035 (USD Billion)
- Figure 14.52 Medical Device CMOs Market for Other Therapeutic Areas in Europe, Base Scenario, till 2035 (USD Billion)
- Figure 14.53 Medical Device CMOs Market in Asia and Rest of the World, Base Scenario, till 2035 (USD Billion)
- Figure 14.54 Medical Device CMOs Market in China, Base Scenario, till 2035 (USD Billion)
- Figure 14.55 Medical Device CMOs Market in Japan, Base Scenario, till 2035 (USD Billion)
- Figure 14.56 Medical Device CMOs Market in India, Base Scenario, till 2035 (USD Billion)
- Figure 14.57 Medical Device CMOs Market in Rest of Asia and Rest of the World, Base Scenario, till 2035 (USD Billion)
- Figure 14.58 Medical Device CMOs Market for Class I Devices in Asia and Rest of the World, Base Scenario, till 2035 (USD Billion)
- Figure 14.59 Medical Device CMOs Market for Class II Devices in Asia and Rest of the World, Base Scenario, till 2035 (USD Billion)
- Figure 14.60 Medical Device CMOs Market for Class III Devices in Asia and Rest of the World, Base Scenario, till 2035 (USD Billion)
- Figure 14.61 Medical Device CMOs Market for Cardiovascular Disorders in Asia and Rest of the World, Base Scenario, till 2035 (USD Billion)
- Figure 14.62 Medical Device CMOs Market for CNS Disorders in Asia and Rest of the World, Base Scenario, till 2035 (USD Billion)
- Figure 14.63 Medical Device CMOs Market for Metabolic Disorders in Asia and Rest of the World, Base Scenario, till 2035 (USD Billion)
- Figure 14.64 Medical Device CMOs Market for Oncological Disorders in Asia and Rest of the World, Base Scenario, till 2035 (USD Billion)
- Figure 14.65 Medical Device CMOs Market for Orthopedic Disorders in Asia and Rest of the World, Base Scenario, till 2035 (USD Billion)
- Figure 14.66 Medical Device CMOs Market for Ophthalmic Disorders in Asia and Rest of the World, Base Scenario, till 2035 (USD Billion)
- Figure 14.67 Medical Device CMOs Market for Pain Disorders in Asia and Rest of the World, Base Scenario, till 2035 (USD Billion)
- Figure 14.68 Medical Device CMOs Market for Respiratory Disorders in Asia and Rest of the World, Base Scenario, till 2035 (USD Billion)
- Figure 14.69 Medical Device CMOs Market for Other Therapeutic Areas in Asia and Rest of the World, Base Scenario, till 2035 (USD Billion)
- Figure 15.1 Medical Device Contract Manufacturing SWOT Analysis: Overview
- Figure 15.2 Comparison of SWOT Factors: Harvey Ball Analysis
 澳洲医疗设备契约製造市场-按应用、治疗领域和器材类别划分:产业趋势和全球预测(至2035年)
 2026年全球医疗设备契约製造市场报告
 体外诊断(IVD)契约製造市场分析及至2035年预测:按类型、产品、服务、技术、组件、应用、最终用户、流程和设备划分
 体外诊断契约製造市场-全球产业规模、份额、趋势、机会及预测(依设备类型、技术、服务类型、地区及竞争格局划分,2021-2031年)
 全球体外诊断(IVD)合约製造市场:市场规模、占有率、成长率、产业分析、依类型、应用和地区划分的考量因素以及未来预测(2026-2034)
 体外诊断设备契约製造市场规模、份额和成长分析(按产品类型、技术、服务类型和地区划分)-2026年至2033年产业预测
 医疗设备契约製造市场规模、份额和成长分析(按产品类别、服务类型、治疗领域、最终用户和地区划分)-2026-2033年产业预测
 体外诊断(IVD)契约製造市场预测至2032年:按服务类型、产品类型、技术、合约类型、产能、最终用户和地区分類的全球分析
 诊断设备CDMO市场规模、份额和趋势分析报告:按服务、类别、应用、最终用途、地区和细分市场预测(2025-2033年)
 医疗设备契约製造:全球市场