


 |
市场调查报告书
商品编码
1771296
牙科3D列印市场:行业趋势和全球预测 - 依列印技术类型、应用领域、列印材料类型和主要地区Dental 3D Printing Market: Industry Trends and Global Forecasts - Distribution by Type of Printing Technology, Application Area, Type of Printing Material and Key Geographical Regions |
||||||
全球牙科3D列印市场:概览
预计2035年,全球牙科3D列印市场规模将从目前的34亿美元成长至158亿美元,预测期内年复合成长率为14.9%。
市场区隔包括以下参数的市场规模和机会分析:
列印技术类型
- VAT聚合技术
- 粉床熔融技术
- Polyjet技术
- 金属挤压技术
- 其他
应用领域
- 牙科修復
- 正畸
- 牙科植体
- 其他
列印材料类型
- 树脂
- 塑胶
- 金属
- 陶瓷
- 其他
主要地区
- 北美
- 欧洲
- 亚太地区
- 拉丁美洲
- 中东和北非
- 其他地区
全球牙科3D列印市场:成长与趋势
工业4.0透过使用智慧型电脑和连网设备改变製造、生产和全球企业的营运方式。 3D列印是製造领域的进步,它激发了各种技术的创新。 3D列印(积层製造)使用电脑辅助设计逐层建造3D物件。事实上,3D生物列印能够使用多种材料建构复杂模型,其多功能性使其成为牙科、航空航太、医疗保健和其他製造业等各行业的宝贵工具。尤其值得一提的是,由于内部牙科列印技术的进步、数位化牙科的扩展以及对3D列印产品日益成长的需求,3D列印在牙科行业的应用迅速成长。
该技术具有多种优势,包括高品质、精密的牙科产品,例如牙冠、牙桥、假牙、手术导板和植体。此外,对于患者和牙医来说,它也是一个省时省钱的流程。因此,随着3D列印技术在牙科行业中的日益普及,日益加重的牙科疾病负担以及传统牙科产品製造方法带来的挑战可以轻鬆解决。
全球牙科3D列印市场:关键洞察
本报告深入探讨了全球牙科3D列印市场的现状,并识别了行业内的潜在成长机会。报告的主要调查结果包括:
- 目前,约有230台牙科3D列印机可用于各种牙科应用,其中大多数用于列印牙冠、牙桥、假牙和工作模型。
- 大多数牙科3D列印机用于列印牙冠、牙桥、假牙和工作模型。
- DLP是牙科3D列印机中最常用的列印技术类型。这些印表机的售价大多低于10,000美元。
- 超过 80%的牙科 3D 列印机采用大桶聚合和粉末床熔融製程进行列印,其中约 70%的印表机提供 405 nm 的波长。
- 提供树脂基 3D 列印机的领先公司包括(按字母顺序排列):3D Systems、Dentsply Sirona、Formlabs、Shining 3D 和 SprintRay。
- 目前的市场格局高度分散,主要地区既有新进者,也有老牌企业。
- 为了获得竞争优势,开发人员积极将先进技术融入其牙科 3D 列印机产品组合中,以满足不断变化的行业需求。
- 合作活动的增加也显示了利害关係人兴趣的日益成长。事实上,大多数洲际协议都是由北美公司签署的。
- 事实上,大多数洲际协议都是由北美公司签署的。
- 该领域签署的协议中,超过25%是产品整合协议,其中约55%是由欧洲公司签署的。
- 签署协议数量最多的公司包括Nexa3D、Carbon、BEGO、Dentsply Sirona、SprintRay、Henkel、Ackuretta和Keystone Industries。
- 各利害关係人对牙科3D列印及相关技术的兴趣日益浓厚,刺激了研究,并扩大了该领域的智力资本。
- 自2019年以来,已提交/授予了500多项与牙科3D列印相关的专利,其中约60%是专利申请。
- 该领域的大多数专利均由行业参与者提交,近期提交的专利超过 180 项。
- 多年来,该市场的智力资本以令人瞩目的速度成长,但只有少数专利的价值最高。
- 成本是决定 3D 列印在牙科行业中被接受和采用的关键因素。定价策略矩阵可能有助于进入者评估其所提供产品的市场竞争力。
- Bowman 的定价策略矩阵表明,牙科 3D 列印机的价格与其感知价值成正比。
- 预计到2035年,牙科3D列印市场的年复合成长率将达到14.9%,预计的市场机会很可能在各个细分市场中均衡分布。
- 尤其是北美,占据了牙科3D列印市场的最大占有率,这一趋势在未来很可能保持不变。
参与牙科 3D 列印市场的公司范例
- 3D Systems
- Asiga
- BEGO
- Carbon
- Digital Wax Systems(DWS)
- Formlabs
- Prodways
- Rapid Shape
- SprintRay
- Stratasys
本报告调查全球牙科 3D 列印市场,提供市场概述,以及依列印技术类型、应用领域、列印材料类型、区域趋势,和参与市场的公司简介。
目录
第1章 简介
第2章 执行摘要
第3章 简介
- 章节概述
- 牙科3D列印概述
- 牙科3D列印技术
- 3D列印在牙科行业的应用
- 牙科3D列印的优点与局限性
- 未来展望
第4章 市场格局
- 章节概述
- 牙科3D列印机:市场格局
- 牙科3D列印机製造商:发展前景
第5章 产品竞争力分析
- 章节概述
- 假设和关键参数
- 研究方法
- 产品竞争力分析:牙科 3D 列印机
第6章 公司简介
- 章节概述
- 3D Systems
- Asiga
- BEGO
- Carbon
- Digital Wax Systems(DWS)
- Formlabs
- Prodways
- Rapid Shape
- SprintRay
- Stratasys
第7章 合作伙伴与合作
第8章 专利分析
- 章节概述
- 研究范围与研究方法
- 牙科 3D 列印:专利分析
- 牙科 3D 列印:专利基准分析
- 牙科 3D 列印:专利估值
- 被引用次数最高的专利
第9章 BOWMAN CLOCK PRICING
第10章 市场预测与机会分析
- 章节概述
- 预测研究方法与关键假设
- 2035年全球牙科 3D 列印市场
- 牙科 3D 列印市场:依列印技术类型
- 牙科 3D 列印市场:依应用领域
- 牙科 3D 列印市场:依列印材料类型
- 依区域
第11章 结论
第12章 高层洞察
第13章 附录1:表格资料
第14章 附录2:公司与组织清单
GLOBAL DENTAL 3D PRINTING MARKET: OVERVIEW
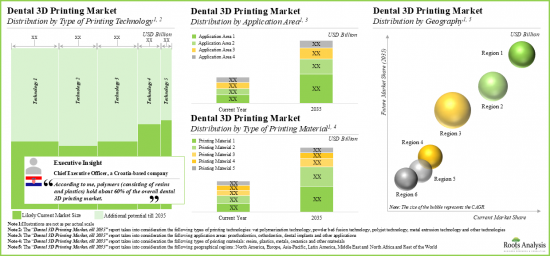
As per Roots Analysis, the global dental 3D printing market is estimated to grow from USD 3.4 billion in the current year to USD 15.8 billion by 2035, growing at a CAGR of 14.9% during the forecast period, till 2035.
The market sizing and opportunity analysis has been segmented across the following parameters:
Type of Printing Technology
- VAT Polymerization Technology
- Powder Bed Fusion Technology
- Polyjet Technology
- Metal Extrusion Technology
- Other Technologies
Application Area
- Prosthodontics
- Orthodontics
- Dental Implants
- Other Applications
Type of Printing Material
- Resins
- Plastics
- Metals
- Ceramics
- Other Materials
Key Geographical Regions
- North America
- Europe
- Asia-Pacific
- Latin America
- Middle East and North Africa
- Rest of the World
GLOBAL DENTAL 3D PRINTING MARKET: GROWTH AND TRENDS
Industry 4.0 is changing the way manufacturing, production, and global businesses operate through the use of smart computers and connected devices. 3D printing is amongst some of the advancements the field of manufacturing has witnessed, adding on to the novelty of different technologies used. 3D printing, or additive manufacturing, creates three-dimensional objects layer by layer using computer-aided design. In fact, its versatility in crafting complex models from diverse materials has made 3D bioprinting valuable across various industries, such as dental, aerospace, healthcare and other manufacturing sectors. The dental industry, in particular, has seen rapid adoption of 3D printing due to the advancements in in-house dental printing, the expansion of digital dentistry, and growing demand for 3D-printed products.
This technology offers various benefits, such as high-quality and precise dental products like crowns, bridges, dentures, surgical guides and implants. Further, it is also a time efficient and cost-effective process for both patients and dentists. Consequently, the growing burden of dental diseases and the challenges associated with the conventional dental product manufacturing methods can be easily met with the increased adoption of 3D printing in the dental industry.
GLOBAL DENTAL 3D PRINTING MARKET: KEY INSIGHTS
The report delves into the current state of the global dental 3D printing market and identifies potential growth opportunities within industry. Some key findings from the report include:
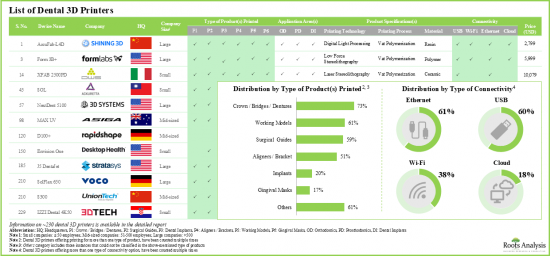
- Presently, around 230 dental 3D printers are available for use across a wide range of dental applications; majority of these devices print crowns, bridges, dentures and working models.
- A myriad of printing technologies are currently being used by dental 3D printer manufacturers; the majority of the dental 3D printers use resins as printing material.
- DLP has emerged as the most common type of printing technology being used by dental 3D printers; majority of these printers cost less than USD 10,000.
- More than 80% of the dental 3D printers use vat polymerization and powder bed fusion processes for printing; of these, around 70% offer wavelength of 405 nm.
- Prominent examples of companies that offer resin-based 3D printers, include (in alphabetical order) 3D Systems, Dentsply Sirona, Formlabs, Shining 3D and SprintRay.
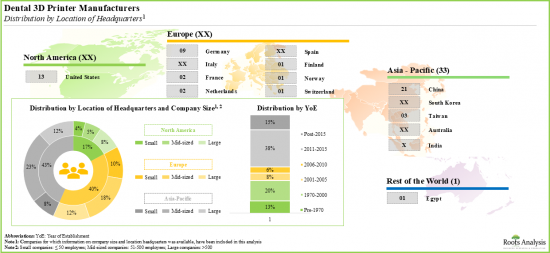
- The current market landscape is highly fragmented, featuring the presence of both new entrants and established players across key geographical regions; majority of these players are based in Europe and Asia-Pacific.
- In pursuit of gaining a competitive edge, developers are making an active effort to incorporate advanced technologies into their respective portfolios of dental 3D printers and comply with evolving industry needs.
- The growing interest of stakeholders is also evident from the rise in partnership activity; in fact, majority of the intracontinental agreements were signed by companies based in North America.
- A significant rise in partnership activity has recently been observed; in fact, over 60% of the deals took place recently.
- More than 25% of the deals inked in this domain were product integration agreements; around 55% of the overall agreements were inked by companies based in Europe.
- Examples of firms that have signed the maximum number of deals include Nexa3D, Carbon, BEGO, Dentsply Sirona, SprintRay, Henkel, Ackuretta and Keystone Industries.
- The rising interest of various stakeholders in dental 3D printing and associated technologies has led to an increase in research, and subsequently, the expansion of intellectual capital in this domain.
- Over 500 patents related to dental 3D printing have been filed / granted since 2019; ~60% of these are patent applications.
- Majority of the patents in this domain have been filed by industry players; more than 180 patents were filed in the recent past.
- Over the years, the intellectual capital in this market has grown at a commendable pace; however, only a small share of patents have the highest valuation.
- Cost is a key determinant of the acceptance and adoption of 3D printers in the dental industry; pricing strategy matrix is likely to assist players in evaluating the competitive market prices for their offerings.
- Bowman's pricing strategy matrix suggests that the price of dental 3D printers is directly proportional to its perceived value.
- The dental 3D printing market is expected to grow at a CAGR of 14.9% till 2035; the projected opportunity is likely to be well distributed across various market segments.
- Notably, North America holds the largest share of the dental 3D printing market, and this trend is likely to remain same in the coming future.
Example Players in the Dental 3D Printing Market
- 3D Systems
- Asiga
- BEGO
- Carbon
- Digital Wax Systems (DWS)
- Formlabs
- Prodways
- Rapid Shape
- SprintRay
- Stratasys
GLOBAL DENTAL 3D PRINTING MARKET: RESEARCH COVERAGE
- Market Sizing and Opportunity Analysis: The report features an in-depth analysis of the global dental 3D printing market, focusing on key market segments, including [A] type of printing technology, [B] application area, [C] type of printing material and [D] key geographical regions.
- Market Landscape: A comprehensive evaluation of around 230 dental 3D printers, considering various parameters, such as [A] type of product(s) printed, [B] application area(s), [C] type of printing process, [D] type of printing material(s), [E] printer wavelength, [F] type of connectivity, [G] printing speed, [H] layer thickness of printed products, [I] printer resolution and [J] printer price. Additionally, a comprehensive evaluation of dental 3D printer manufacturers, based on [A] year of establishment, [B] company size, [C] location of headquarters and [D] leading players (in terms of number of dental 3D printers offered).
- Product Competitiveness Analysis: A comprehensive competitive analysis of the dental 3D printers, examining factors, such as [A] supplier power and [B] product competitiveness.
- Company Profiles: In-depth profiles of companies engaged in dental 3D printing industry, focusing on [A] company overview, [B] details related to its dental 3D printer portfolio and [C] recent developments and an informed future outlook.
- Partnerships and Collaborations: An insightful analysis of the deals inked by stakeholders in the dental 3D printing market, based on several parameters, such as [A] year of partnership, [B] type of partnership, [C] most active players (in terms of the number of partnerships signed) and [D] geographical distribution of partnership activity.
- Patent Analysis: An in-depth analysis of patents filed / granted till date in the dental 3D printing domain, based on various relevant parameters, such as [A] type of patent, [B] publication year, [C] application year, [D] geographical location, [E] CPC symbols, [F] type of applicant, [G] patent age, [H] leading players (in terms of number of patents filed / granted) and [I] benchmarking analysis and [J] patent valuation analysis.
- Bowman Clock Pricing: An insightful analysis of Bowman's strategy clock framework to comprehend the pricing strategy of the dental 3D printer offered by a firm, along with its competitive position in the market.
KEY QUESTIONS ANSWERED IN THIS REPORT
- How many companies are currently engaged in this market?
- Which are the leading companies in this market?
- What factors are likely to influence the evolution of this market?
- What is the current and future market size?
- What is the CAGR of this market?
- How is the current and future market opportunity likely to be distributed across key market segments?
REASONS TO BUY THIS REPORT
- The report provides a comprehensive market analysis, offering detailed revenue projections of the overall market and its specific sub-segments. This information is valuable to both established market leaders and emerging entrants.
- Stakeholders can leverage the report to gain a deeper understanding of the competitive dynamics within the market. By analyzing the competitive landscape, businesses can make informed decisions to optimize their market positioning and develop effective go-to-market strategies.
- The report offers stakeholders a comprehensive overview of the market, including key drivers, barriers, opportunities, and challenges. This information empowers stakeholders to stay abreast of market trends and make data-driven decisions to capitalize on growth prospects.
ADDITIONAL BENEFITS
- Complimentary PPT Insights Packs
- Complimentary Excel Data Packs for all Analytical Modules in the Report
- 15% Free Content Customization
- Detailed Report Walkthrough Session with Research Team
- Free Updated report if the report is 6-12 months old or older
TABLE OF CONTENTS
1. PREFACE
- 1.1. Scope of the Report
- 1.2. Research Methodology
- 1.2.1. Research Assumptions
- 1.2.2. Project Methodology
- 1.2.3. Forecast Methodology
- 1.2.4. Robust Quality Control
- 1.2.5. Key Considerations
- 1.2.5.1. Demographics
- 1.2.5.2. Economic Factors
- 1.2.5.3. Government Regulations
- 1.2.5.4. Supply Chain
- 1.2.5.5. COVID Impact / Related Factors
- 1.2.5.6. Market Access
- 1.2.5.7. Healthcare Policies
- 1.2.5.8. Industry Consolidation
- 1.3 Key Questions Answered
- 1.4. Chapter Outlines
2. EXECUTIVE SUMMARY
3. INTRODUCTION
- 3.1. Chapter Overview
- 3.2. Overview of Dental 3D Printing
- 3.3. Dental 3D Printing Technologies
- 3.4. Applications of 3D Printing in Dental Industry
- 3.5. Advantages and Limitations Associated with Dental 3D Printing
- 3.6. Future Perspectives
4. MARKET LANDSCAPE
- 4.1. Chapter Overview
- 4.2. Dental 3D Printers: Overall Market Landscape
- 4.2.1. Analysis by Types of Products Printed
- 4.2.2. Analysis by Application Area
- 4.2.3. Analysis by Type of Printing Technology
- 4.2.4. Analysis by Type of Printing Process
- 4.2.5. Analysis by Type of Printing Material
- 4.2.6. Analysis by Printer Wavelength
- 4.2.7. Analysis by Type of Connectivity
- 4.2.8. Analysis by Printing Speed
- 4.2.9. Analysis by Layer Thickness of Printed Products
- 4.2.10. Analysis by Printer Resolution
- 4.2.11. Analysis by Printer Price
- 4.3. Dental 3D Printer Manufacturers: Developer Landscape
- 4.3.1. Analysis by Year of Establishment
- 4.3.2. Analysis by Company Size
- 4.3.3. Analysis by Location of Headquarters
- 4.3.4. Most Active Players: Analysis by Number of Dental 3D Printers
5. PRODUCT COMPETITIVE ANALYSIS
- 5.1. Chapter Overview
- 5.2. Assumptions and Key Parameters
- 5.3. Methodology
- 5.4. Product Competitiveness Analysis: Dental 3D Printers
6. COMPANY PROFILES
- 6.1. Chapter Overview
- 6.2. 3D Systems
- 6.2.1. Company Overview
- 6.2.2. Dental 3D Printer Portfolio
- 6.2.3. Recent Developments and Future Outlook
- 6.3. Asiga
- 6.3.1. Company Overview
- 6.3.2. Dental 3D Printer Portfolio
- 6.3.3. Recent Developments and Future Outlook
- 6.4. BEGO
- 6.4.1. Company Overview
- 6.4.2. Dental 3D Printer Portfolio
- 6.4.3. Recent Developments and Future Outlook
- 6.5. Carbon
- 6.5.1. Company Overview
- 6.5.2. Dental 3D Printer Portfolio
- 6.5.3. Recent Developments and Future Outlook
- 6.6. Digital Wax Systems (DWS)
- 6.6.1. Company Overview
- 6.6.2. Dental 3D Printer Portfolio
- 6.6.3. Recent Developments and Future Outlook
- 6.7. Formlabs
- 6.7.1. Company Overview
- 6.7.2. Dental 3D Printer Portfolio
- 6.7.3. Recent Developments and Future Outlook
- 6.8. Prodways
- 6.8.1. Company Overview
- 6.8.2. Dental 3D Printer Portfolio
- 6.8.3. Recent Developments and Future Outlook
- 6.9. Rapid Shape
- 6.9.1. Company Overview
- 6.9.2. Dental 3D Printer Portfolio
- 6.9.3. Recent Developments and Future Outlook
- 6.10. SprintRay
- 6.10.1. Company Overview
- 6.10.2. Dental 3D Printer Portfolio
- 6.10.3. Recent Developments and Future Outlook
- 6.11. Stratasys
- 6.11.1. Company Overview
- 6.11.2. Dental 3D Printer Portfolio
- 6.11.3. Recent Developments and Future Outlook
7. PARTNERSHIPS AND COLLABORATIONS
- 7.1. Chapter Overview
- 7.2. Partnership Models
- 7.3. Dental 3D Printing: List of Partnerships and Collaborations
- 7.3.1. Analysis by Year of Partnership
- 7.3.2. Analysis by Type of Partnership
- 7.3.3. Analysis by Year and Type of Partnership
- 7.3.4. Most Active Players: Analysis by Number of Partnerships
- 7.3.5. Geographical Analysis
- 7.3.5.1. International and Local Agreements
- 7.3.5.2. Intercontinental and Intracontinental Agreements
8. PATENT ANALYSIS
- 8.1. Chapter Overview
- 8.2. Scope and Methodology
- 8.3. Dental 3D Printing: Patent Analysis
- 8.3.1. Analysis by Type of Patent
- 8.3.2. Analysis by Patent Publication Year
- 8.3.3. Analysis by Patent Application Year
- 8.3.4. Analysis by Annual Number of Granted Patents and Patent Applications
- 8.3.5. Analysis by Geographical Location
- 8.3.6. Analysis by CPC Symbols
- 8.3.7. Analysis by Type of Applicant
- 8.3.8. Analysis by Patent Age
- 8.3.9. Leading Industry Players: Analysis by Number of Patents
- 8.3.10. Leading Non-Industry Players: Analysis by Number of Patents
- 8.3.11. Leading Individual Assignees: Analysis by Number of Patents
- 8.4. Dental 3D Printing: Patent Benchmarking Analysis
- 8.4.1. Analysis by Patent Characteristics
- 8.5. Dental 3D Printing: Patent Valuation
- 8.6. Leading Patents by Number of Citations
9. BOWMAN CLOCK PRICING
- 9.1. Chapter Overview
- 9.2. Bowman Strategy Clock
- 9.2.1. Two Dimensions of Bowman Strategy Clock
- 9.2.2. Eight Positions on Bowman Strategy Clock
- 9.3. Roots Analysis Framework
- 9.3.1. Scope and Methodology
- 9.3.2. Theoretical Framework and Price Evaluation Hypothesis
- 9.3.3. Results and Interpretation
- 9.3.3.1. Product Price Evaluation Matrix: Information on Types of Products Printed
- 9.3.3.2. Product Price Evaluation Matrix: Information on Application Area
- 9.3.3.3. Product Price Evaluation Matrix: Information on Type of Printing Technology
- 9.3.3.4. Product Price Evaluation Matrix: Information on Type of Printing Process
- 9.3.3.5. Product Price Evaluation Matrix: Information on Type of Printing Material
- 9.3.3.6. Product Price Evaluation Matrix: Information on Type of Connectivity
- 9.3.4. Concluding Remarks
10. MARKET FORECAST AND OPPORTUNITY ANALYSIS
- 10.1. Chapter Overview
- 10.2. Forecast Methodology and Key Assumptions
- 10.3. Global Dental 3D Printing Market, Till 2035
- 10.3.1. Dental 3D Printing Market: Distribution by Type of Printing Technology
- 10.3.1.1. Dental 3D Printing Market for VAT Polymerization Technology, Till 2035
- 10.3.1.2. Dental 3D Printing Market for Powder Bed Fusion Technology, Till 2035
- 10.3.1.3. Dental 3D Printing Market for Polyjet Technology, Till 2035
- 10.3.1.4. Dental 3D Printing Market for Metal Extrusion Technology, Till 2035
- 10.3.1.5. Dental 3D Printing Market for Other Technologies, Till 2035
- 10.3.2. Dental 3D Printing Market: Distribution by Application Area
- 10.3.2.1. Dental 3D Printing Market for Prosthodontics, Till 2035
- 10.3.2.2. Dental 3D Printing Market for Orthodontics, Till 2035
- 10.3.2.3. Dental 3D Printing Market for Dental Implants, Till 2035
- 10.3.2.4. Dental 3D Printing Market for Other Applications, Till 2035
- 10.3.3. Dental 3D Printing Market: Distribution by Type of Printing Material
- 10.3.3.1. Dental 3D Printing Market for Resins, Till 2035
- 10.3.3.2. Dental 3D Printing Market for Plastics, Till 2035
- 10.3.3.3. Dental 3D Printing Market for Metals, Till 2035
- 10.3.3.4. Dental 3D Printing Market for Ceramics, Till 2035
- 10.3.3.5. Dental 3D Printing Market for Other Material, Till 2035
- 10.3.4. Dental 3D Printing Market: Distribution by Geography
- 10.3.4.1. Dental 3D Printing Market in North America, Till 2035
- 10.3.4.2. Dental 3D Printing Market in Europe, Till 2035
- 10.3.4.3. Dental 3D Printing Market in Asia-Pacific, Till 2035
- 10.3.4.4. Dental 3D Printing Market in Latin America, Till 2035
- 10.3.4.5. Dental 3D Printing Market in Middle East and North Africa, Till 2035
- 10.3.4.6. Dental 3D Printing Market in Rest of the World, Till 2035
- 10.3.1. Dental 3D Printing Market: Distribution by Type of Printing Technology
11. CONCLUDING REMARKS
12. EXECUTIVE INSIGHTS
- 12.1. Chapter Overview
- 12.2. Company A
- 12.2.1. Company Snapshot
- 12.2.2. Interview Transcript
- 12.3. Company B
- 12.3.1. Company Snapshot
- 12.3.2. Interview Transcript
13. APPENDIX 1: TABULATED DATA
14. APPENDIX 2: LIST OF COMPANIES AND ORGANIZATIONS
List of Tables
- Table 4.1 Dental 3D Printers: Information on Type of Product Printed and Application Area
- Table 4.2 Dental 3D Printers: Information on Type of Printing Technology and Printing Process Used
- Table 4.3 Dental 3D Printers: Information on Type of Printing Material, Printer Wavelength and Connectivity
- Table 4.4 Dental 3D Printers: Information on Printing Speed, Layer Thickness of Printed Products, Printer Resolution and Printer Price
- Table 4.5 List of Dental 3D Printer Manufacturers
- Table 6.1 Leading Dental 3D Printer Manufacturers
- Table 6.2 3D Systems: Company Snapshot
- Table 6.3 3D Systems: Dental 3D Printer Portfolio
- Table 6.4 3D Systems: Recent Developments and Future Outlook
- Table 6.5 Asiga: Company Snapshot
- Table 6.6 Asiga: Dental 3D Printer Portfolio
- Table 6.7 Asiga: Recent Developments and Future Outlook
- Table 6.8 BEGO: Company Snapshot
- Table 6.9 BEGO: Dental 3D Printer Portfolio
- Table 6.10 BEGO: Recent Developments and Future Outlook
- Table 6.11 Carbon: Company Snapshot
- Table 6.12 Carbon: Dental 3D Printer Portfolio
- Table 6.13 Carbon: Recent Developments and Future Outlook
- Table 6.14 DWS: Company Snapshot
- Table 6.15 DWS: Dental 3D Printer Portfolio
- Table 6.16 DWS: Recent Developments and Future Outlook
- Table 6.17 Formlabs: Company Snapshot
- Table 6.18 Formlabs: Dental 3D Printer Portfolio
- Table 6.19 Formlabs: Recent Developments and Future Outlook
- Table 6.20 Prodways: Company Snapshot
- Table 6.21 Prodways: Dental 3D Printer Portfolio
- Table 6.22 Prodways: Recent Developments and Future Outlook
- Table 6.23 Rapid Shape: Company Snapshot
- Table 6.24 Rapid Shape: Dental 3D Printer Portfolio
- Table 6.25 Rapid Shape: Recent Developments and Future Outlook
- Table 6.26 SprintRay: Company Snapshot
- Table 6.27 SprintRay: Dental 3D Printer Portfolio
- Table 6.28 SprintRay: Recent Developments and Future Outlook
- Table 6.29 Stratasys: Company Snapshot
- Table 6.30 Stratasys: Dental 3D Printer Portfolio
- Table 6.31 Stratasys: Recent Developments and Future Outlook
- Table 7.1 Dental 3D Printer Manufacturers: List of Partnerships and Collaborations, Since 2018
- Table 8.1 Patent Analysis: Top CPC Section
- Table 8.2 Patent Analysis: Top CPC Symbol
- Table 8.3 Patent Analysis: Top CPC Code
- Table 8.4 Patent Analysis: Summary of Benchmarking Analysis
- Table 8.5 Patent Analysis: Categorization based on Weighted Valuation Scores
- Table 8.6 Patent Portfolio: List of Leading Patents (by Highest Relative Valuation)
- Table 8.7 Patent Portfolio: List of Leading Patents (by Number of Citations)
- Table 13.1 Dental 3D Printers: Distribution Types of Products Printed
- Table 13.2 Dental 3D Printers: Distribution by Application Area
- Table 13.3 Dental 3D Printers: Distribution by Type of Printing Technology
- Table 13.4 Dental 3D Printers: Distribution by Type of Printing Process
- Table 13.5 Dental 3D Printers: Distribution by Type of Printing Material
- Table 13.6 Dental 3D Printers: Distribution by Printer Wavelength (nm)
- Table 13.7 Dental 3D Printers: Distribution by Type of Connectivity
- Table 13.8 Dental 3D Printers: Distribution by Printing Speed (mm/hour)
- Table 13.9 Dental 3D Printers: Distribution by Layer Thickness of Printed Products (µm)
- Table 13.10 Dental 3D Printers: Distribution by Printer Resolution (µm)
- Table 13.11 Dental 3D Printers: Distribution by Printer Price (USD)
- Table 13.12 Dental 3D Printer Manufacturers: Distribution by Year of Establishment
- Table 13.13 Dental 3D Printer Manufacturers: Distribution by Company Size
- Table 13.14 Dental 3D Printer Manufacturers: Distribution by Location of Headquarters (Region-wise)
- Table 13.15 Dental 3D Printer Manufacturers: Distribution by Location of Headquarters (Country-wise)
- Table 13.16 Dental 3D Printer Manufacturer: Distribution by Company Size and Location of Headquarters
- Table 13.17 Most Active Players: Distribution by Number of Dental 3D Printers
- Table 13.18 Partnerships and Collaborations: Cumulative Year-Wise Trend, Since 2018
- Table 13.19 Partnerships and Collaborations: Distribution by Type of Partnership
- Table 13.20 Partnerships and Collaborations: Distribution by Year and Type of Partnership
- Table 13.21 Partnerships and Collaborations: Distribution by Type of Partnership, Since 2018
- Table 13.22 Most Active Players: Distribution by Number of Partnerships
- Table 13.23 Partnerships and Collaborations: International and Local Agreements
- Table 13.24 Partnerships and Collaborations: Intercontinental and Intracontinental Agreements
- Table 13.25 Patent Analysis: Distribution by Type of Patent
- Table 13.26 Patent Analysis: Cumulative Distribution by Patent Publication Year, Since 2019
- Table 13.27 Patent Analysis: Cumulative Distribution of Granted Patents by Publication Year, Since 2019
- Table 13.28 Patent Analysis: Cumulative Distribution of Patents Applications by Publication Year, Since 2019
- Table 13.29 Patent Analysis: Cumulative Distribution by Patent Application Year, Since 2019
- Table 13.30 Patent Analysis: Year-wise Distribution of Granted Patents and Patent Applications, Since 2019
- Table 13.31 Patent Analysis: Distribution by Geographical Location
- Table 13.32 Patent Analysis: Distribution by CPC Symbols
- Table 13.33 Patent Analysis: Distribution by Type of Applicant
- Table 13.34 Patent Analysis: Distribution by Patent Age
- Table 13.35 Leading Industry Players: Distribution by Number of Patents
- Table 13.36 Leading Non-Industry Players: Distribution by Number of Patents
- Table 13.37 Leading Individual Assignees: Distribution by Number of Patents
- Table 13.38 Patent Benchmarking: Distribution by Patent Characteristics (CPC Symbols)
- Table 13.39 Patent Valuation
- Table 13.40 Global Dental 3D Printing Market, Conservative, Base and Optimistic Scenarios, Till 2035 (USD Billion)
- Table 13.41 Dental 3D Printing Market: Distribution by Type of Printing Technology, (USD Billion)
- Table 13.42 Dental 3D Printing Market for VAT Polymerization Technology, Conservative, Base and Optimistic Scenarios, Till 2035 (USD Billion)
- Table 13.43 Dental 3D Printing Market for Powder Bed Fusion Technology, Conservative, Base and Optimistic Scenarios, Till 2035 (USD Billion)
- Table 13.44 Dental 3D Printing Market for Polyjet Technology, Conservative, Base and Optimistic Scenarios, Till 2035 (USD Billion)
- Table 13.45 Dental 3D Printing Market for Metal Extrusion Technology, Conservative, Base and Optimistic Scenarios, Till 2035 (USD Billion)
- Table 13.46 Dental 3D Printing Market for Other Technologies, Conservative, Base and Optimistic Scenarios, Till 2035 (USD Billion)
- Table 13.47 Dental 3D Printing Market: Distribution by Application Area, (USD Billion)
- Table 13.48 Dental 3D Printing Market for Prosthodontics, Conservative, Base and Optimistic Scenarios, Till 2035 (USD Billion)
- Table 13.49 Dental 3D Printing Market for Orthodontics, Conservative, Base and Optimistic Scenarios, Till 2035 (USD Billion)
- Table 13.50 Dental 3D Printing Market for Dental Implants, Conservative, Base and Optimistic Scenarios, Till 2035 (USD Billion)
- Table 13.51 Dental 3D Printing Market for Other Applications, Conservative, Base and Optimistic Scenarios, Till 2035 (USD Billion)
- Table 13.52 Dental 3D Printing Market: Distribution by Type of Printing Material, (USD Billion)
- Table 13.53 Dental 3D Printing Market for Resins, Conservative, Base and Optimistic Scenarios, Till 2035 (USD Billion)
- Table 13.54 Dental 3D Printing Market for Plastics, Conservative, Base and Optimistic Scenarios, Till 2035 (USD Billion)
- Table 13.55 Dental 3D Printing Market for Metals, Conservative, Base and Optimistic Scenarios, Till 2035 (USD Billion)
- Table 13.56 Dental 3D Printing Market for Ceramics, Conservative, Base and Optimistic Scenarios, Till 2035 (USD Billion)
- Table 13.57 Dental 3D Printing Market for Other Material, Conservative, Base and Optimistic Scenarios, Till 2035 (USD Billion)
- Table 13.58 Dental 3D Printing Market: Distribution by Geography, (USD Billion)
- Table 13.59 Dental 3D Printing Market in North America, Conservative, Base and Optimistic Scenarios, Till 2035 (USD Billion)
- Table 13.60 Dental 3D Printing Market in Europe, Conservative, Base and Optimistic Scenarios, Till 2035 (USD Billion)
- Table 13.61 Dental 3D Printing Market in Asia-Pacific, Conservative, Base and Optimistic Scenarios, Till 2035 (USD Billion)
- Table 13.62 Dental 3D Printing Market in Latin America, Conservative, Base and Optimistic Scenarios, Till 2035 (USD Billion)
- Table 13.63 Dental 3D Printing Market in Middle East and North Africa, Conservative, Base and Optimistic Scenarios, Till 2035 (USD Billion)
- Table 13.64 Dental 3D Printing Market in Rest of the World, Conservative, Base and Optimistic Scenarios, Till 2035 (USD Billion)
List of Figures
- Figure 2.1 Executive Summary: Overall Market Landscape
- Figure 2.2 Executive Summary: Partnerships and Collaborations
- Figure 2.3 Executive Summary: Patent Analysis
- Figure 2.4 Executive Summary: Market Forecast and Opportunity Analysis
- Figure 3.1 Process of Dental 3D Printing
- Figure 3.2 Dental 3D Printing Technologies
- Figure 3.3 Applications of 3D Printing in Dental Industry
- Figure 3.4 Advantages of Dental 3D Printing
- Figure 4.1 Dental 3D Printers: Distribution Types of Products Printed
- Figure 4.2 Dental 3D Printers: Distribution by Application Area
- Figure 4.3 Dental 3D Printers: Distribution by Type of Printing Technology
- Figure 4.4 Dental 3D Printers: Distribution by Type of Printing Process
- Figure 4.5 Dental 3D Printers: Distribution by Type of Printing Material
- Figure 4.6 Dental 3D Printers: Distribution by Printer Wavelength (nm)
- Figure 4.7 Dental 3D Printers: Distribution by Type of Connectivity
- Figure 4.8 Dental 3D Printers: Distribution by Printing Speed (mm/hour)
- Figure 4.9 Dental 3D Printers: Distribution by Layer Thickness of Printed Products (µm)
- Figure 4.10 Dental 3D Printers: Distribution by Printer Resolution (µm)
- Figure 4.11 Dental 3D Printers: Distribution by Printer Price (USD)
- Figure 4.12 Dental 3D Printer Manufacturers: Distribution by Year of Establishment
- Figure 4.13 Dental 3D Printer Manufacturers: Distribution by Company Size
- Figure 4.14 Dental 3D Printer Manufacturers: Distribution by Location of Headquarters (Region-wise)
- Figure 4.15 Dental 3D Printer Manufacturers: Distribution by Location of Headquarters (Country-wise)
- Figure 4.16 Dental 3D Printer Manufacturers: Distribution by Company Size and Location of Headquarters
- Figure 4.17 Most Active Players: Distribution by Number of Dental 3D Printers
- Figure 5.1 Product Competitiveness Analysis: Dot-Plot Representation of Dental 3D Printers
- Figure 5.2 Product Competitiveness Analysis: Dot-Plot Representation of Top Dental 3D Printers
- Figure 7.1 Partnerships and Collaborations: Cumulative Year-Wise Trend, Since 2018
- Figure 7.2 Partnerships and Collaborations: Distribution by Type of Partnership
- Figure 7.3 Partnerships and Collaborations: Distribution by Year and Type of Partnership
- Figure 7.4 Partnerships and Collaborations: Distribution by Type of Partnership, Since 2018
- Figure 7.5 Most Active Players: Distribution by Number of Partnerships
- Figure 7.6 Partnerships and Collaborations: International and Local Agreements
- Figure 7.7 Partnerships and Collaborations: Intercontinental and Intracontinental Agreements
- Figure 8.1 Patent Analysis: Distribution by Type of Patent
- Figure 8.2 Patent Analysis: Cumulative Distribution by Patent Publication Year, Since 2019
- Figure 8.3 Patent Analysis: Cumulative Distribution of Granted Patents by Publication Year, Since 2019
- Figure 8.4 Patent Analysis: Cumulative Distribution of Patents Applications by Publication Year, Since 2019
- Figure 8.5 Patent Analysis: Cumulative Distribution by Patent Application Year, Since 2019
- Figure 8.6 Patent Analysis: Year-wise Distribution of Granted Patents and Patent Applications, Since 2019
- Figure 8.7 Patent Analysis: Distribution by Geographical Location
- Figure 8.8 Patent Analysis: Distribution by CPC Symbols
- Figure 8.9 Patent Analysis: Distribution by Type of Applicant
- Figure 8.10 Patent Analysis: Distribution by Patent Age
- Figure 8.11 Leading Industry Players: Distribution by Number of Patents
- Figure 8.12 Leading Non-Industry Players: Distribution by Number of Patents
- Figure 8.13 Leading Individual Assignees: Distribution by Number of Patents
- Figure 8.14 Patent Benchmarking Analysis: Distribution by Patent Characteristics (CPC Symbols)
- Figure 8.15 Patent Valuation
- Figure 9.1 Dental 3D Printers: Bowman Clock Pricing Strategy Matrix
- Figure 9.2 Dental 3D Printers: Bowman Clock Pricing Strategy Graphical Interpretation
- Figure 10.1 Global Dental 3D Printing Market, Till 2035 (USD Billion)
- Figure 10.2 Dental 3D Printing Market: Distribution by Type of Printing Technology (USD Billion)
- Figure 10.3 Dental 3D Printing Market for VAT Polymerization Technology, Till 2035 (USD Billion)
- Figure 10.4 Dental 3D Printing Market for Powder Bed Fusion Technology, Till 2035 (USD Billion)
- Figure 10.5 Dental 3D Printing Market for Polyjet Technology, Till 2035 (USD Billion)
- Figure 10.6 Dental 3D Printing Market for Metal Extrusion Technology, Till 2035 (USD Billion)
- Figure 10.7 Dental 3D Printing Market for Other Technologies, Till 2035 (USD Billion)
- Figure 10.8 Dental 3D Printing Market: Distribution by Application Area (USD Billion)
- Figure 10.9 Dental 3D Printing Market for Prosthodontics, Till 2035 (USD Billion)
- Figure 10.10 Dental 3D Printing Market for Orthodontics, Till 2035 (USD Billion)
- Figure 10.11 Dental 3D Printing Market for Dental Implants, Till 2035 (USD Billion)
- Figure 10.12 Dental 3D Printing Market for Other Applications, Till 2035 (USD Billion)
- Figure 10.13 Dental 3D Printing Market: Distribution by Type of Printing Material (USD Billion)
- Figure 10.14 Dental 3D Printing Market for Resins, Till 2035 (USD Billion)
- Figure 10.15 Dental 3D Printing Market for Plastics, Till 2035 (USD Billion)
- Figure 10.16 Dental 3D Printing Market for Metals, Till 2035 (USD Billion)
- Figure 10.17 Dental 3D Printing Market for Ceramics, Till 2035 (USD Billion)
- Figure 10.18 Dental 3D Printing Market for Other Material, Till 2035 (USD Billion)
- Figure 10.19 Dental 3D Printing Market: Distribution by Geography (USD Billion)
- Figure 10.20 Dental 3D Printing Market in North America, Till 2035 (USD Billion)
- Figure 10.21 Dental 3D Printing Market in Europe, Till 2035 (USD Billion)
- Figure 10.22 Dental 3D Printing Market in Asia-Pacific, Till 2035 (USD Billion)
- Figure 10.23 Dental 3D Printing Market in Latin America, Till 2035 (USD Billion)
- Figure 10.24 Dental 3D Printing Market in Middle East and North Africa, Till 2035 (USD Billion)
- Figure 10.25 Dental 3D Printing Market in Rest of the World, Till 2035 (USD Billion)
- Figure 11.1 Concluding Remarks: Overall Market Landscape
- Figure 11.2 Concluding Remarks: Partnerships and Collaborations
- Figure 11.3 Concluding Remarks: Patent Analysis
- Figure 11.4 Concluding Remarks: Market Forecast and Opportunity Analysis
 2026年全球3D列印植入市场报告2026年全球牙科3D列印市场报告2026年全球牙科3D列印设备市场报告
 全球牙科3D列印市场规模、份额、趋势和成长分析报告(2026-2034年)
 牙科3D列印市场-全球产业规模、份额、趋势、机会及预测(按产品/服务、技术、应用、最终用户、地区和竞争格局划分,2021-2031年)
 牙科3D列印设备市场按产品类型、技术、应用、最终用户和地区划分
 牙科3D列印材料市场规模、份额及成长分析(按技术、应用、最终用户和地区划分)-2026-2033年产业预测
 生物3D列印植入市场预测至2032年:按植入类型、生医材料、技术、最终用户和地区分類的全球分析
 牙科 3D 列印市场 - 全球和区域分析:按产品/服务、技术、应用、最终用户和区域 - 分析和预测(2025-2035 年)
 牙科 3D 列印市场(按组件、材料类型、技术、应用和最终用户划分)—2025-2030 年全球预测