


 |
市场调查报告书
商品编码
1771300
家用采血设备市场:产业趋势及全球预测 - 依血液样本状况、样本采集方法、设备用途、应用领域及主要地区At Home Blood Collection Devices Market: Industry Trends and Global Forecasts - Distribution by Type of Blood Sample State, Method of Sample Collection, Device Usage, Area of Application, and Key Geographical Regions |
||||||
全球家用采血设备概况
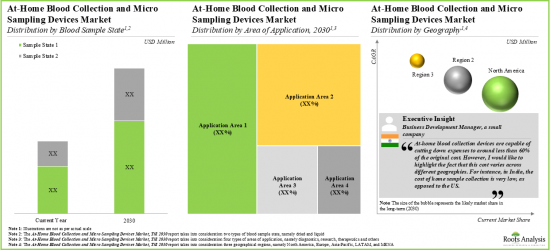
全球家用采血设备市场规模目前为 7.47亿美元。预计预测期内,市场年复合成长率将达到 10.7%。
市场区隔包括根据以下参数进行的市场规模和机会分析:
血液样本类型
- 干血样本
- 液体血液样本
采样方法
- 指尖采血法
- 按钮采血法
设备用途
- 一次性设备
- 可重复使用设备
应用领域
- 诊断
- 研究
- 治疗
- 其他
主要地区
- 北美
- 欧洲
- 亚洲太平洋地区
- 拉丁美洲
- 中东和北非
全球家用采血设备的成长与趋势
过去,采血具有侵入性,耗时长,并且需要专业医护人员的协助。但近年来,家用采血方法已迅速发展。事实上,一项调查显示,如果能够提供自己采集的样本(例如自体血),69%的参与者更有可能参与临床试验。因此,近年来家用检测试剂盒的数量增加。
此外,在新冠疫情期间,为了保持社交距离并避免感染风险,对即时诊疗的需求有所增加,导致前往实验室采集样本和进行检测的患者数量有所下降。这促使该领域的多个利益相关者开发新的设备和技术,使患者能够在家中远端采集血液样本。随着分子检测技术的进步以及检测所需样本量的显着减少,微型设备将诊断和监测平台转变为即时诊疗应用。这项技术以采集微量血液样本而闻名。此外,与侵入性极强且分析结果可能存在差异的传统采样技术相比,这些技术更加用户友善。
全球家用采血设备关键洞察
本报告深入探讨了全球家用采血设备的现状,并识别了该行业的潜在成长机会。报告的主要调查结果包括:
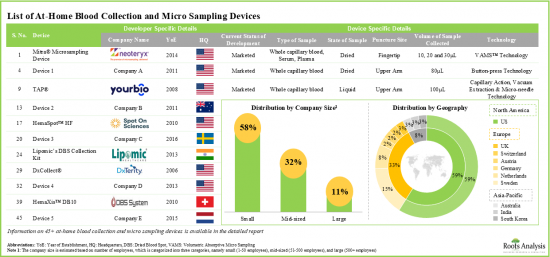
- 目前,市场上有近50种家用采血和微量采样设备可供使用/开发中,其中大多数公司是位于美国的新创公司或小型企业。
- 目前市面上大多数用于采集毛细血管全血的家用设备,其中用于製备干血斑卡的DBS技术正成为最受欢迎的平台。
- 最近,TAP® II和Tasso-M20自体血采集设备获得了欧盟委员会的CE标誌认证。
- 提供各种血液样本的公司范例包括(依字母顺序排列):DBS System、Neoteryx、Sandstone Diagnostics和Sedia Biosciences。
- 为了获得竞争优势,利害关係人积极扩展其产品组合,并透过融入先进功能来升级其设备。
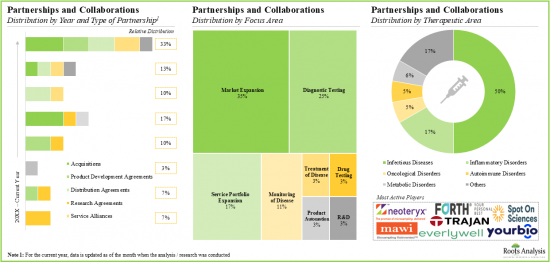
- 利害关係人日益成长的兴趣也体现在近期合作活动的增加,迄今为止达成的交易中,很大一部分集中在市场扩张上。
- 多年来,与采血设备相关的智慧财产权以惊人的速度成长,大多数专利是由产业参与者提交的。
- 该领域申请/授予的专利数量以 11%的年复合成长率成长,2019年申请/授予的专利数量最多。
- 高价值专利主要集中在血液样本管理方面,包括样本采集、稳定和储存的系统和方法。
- 大多数专利申请/授予地在北美,超过 90%的专利由该地区的行业参与者申请。
- 为了支持该领域的持续创新,私人和公共投资者向各行业利益相关者发起的倡议投入 6.5亿美元的巨额资本。
- 该领域的融资和投资活动以 12%的年复合成长率成长。其中很大一部分的投资是在过去两年内完成。
- 除大型公司外,一些中小企业也透过 IPO、创投和其他股权融资。
- 鑑于新冠疫情期间家用采血和微量采样设备的普及率大幅提升,预计未来市场将呈现显着成长。
家用采血设备市场的主要参与者
- EuroImmun
- Everlywell
- LabCorp
- LaBonovum
- LamediTech
- Quest Diagnostics
- Spot-On Science
- Tasso
- Weaver Health
- YourBioHealth
本报告调查全球家用采血设备市场,提供市场概述,以及依血液样本状况、样本采集方法、设备用途、应用领域和区域的趋势,和参与市场的公司简介。
目录
第1章 简介
第2章 执行摘要
第3章 简介
- 章节概述
- 家用采血和微量采样设备概述
- 血液样本采集与检测应用
- 血液样本类型
- 家用采血的优势
- 家用采血的方法
- 家用采血和微量采样设备的类型
- 未来展望
第4章 市场概述
- 章节概述
- 家用采血与微量采样设备:市场格局
- 家用采血和微量采样设备:开发商列表
- 最活跃的参与者:产品数量
第5章 产品竞争力分析
- 章节概述
- 假设与关键输入参数
- 研究方法
第6章 公司简介
- 章节概述
- EUROIMMUN
- Everlywell
- Labcorp
- Labonovum
- Lameditech
- Quest Diagnostics
- Spot On Sciences
- Tasso
- Weavr Health
- YourBio Health
第7章 专利分析
- 章节概述
- 家用采血和微量采样设备:专利分析
第8章 合作伙伴关係
- 章节概述
- 合作模式
- 家用血液和微量采样设备:合作伙伴列表
第9章 资金与投资分析
- 章节概述
- 资金类型
- 家用血液和微量采样设备:资金和投资分析
- 结论
第10章 成本节约分析
- 章节概述
- 关键假设
- 方法论
- 家用血液和微量采样设备的整体成本节约潜力
- 结论
第11章 市场预测
- 章节概述
- 预测研究方法论与假设
- 2035年全球家用采血及微量采血设备市场
- 2035年家用采血及微量采血设备市场:依血液样本状况
- 2035年家用采血及微量采血设备市场:依血液检体方式
- 2035年家用采血及微量采血设备市场:依设备用途
- 2035年家用采血及微量采血设备市场:依应用领域
- 2035年家用采血及微量采血设备市场:依地区
第12章 结论
第13章 高层洞察
第14章 附录1:表格资料
第15章 附录2:公司与组织清单
GLOBAL AT HOME BLOOD COLLECTION DEVICES: OVERVIEW
As per Roots Analysis, the global at home blood collection devices valued at USD 747 million in the current year is anticipated to grow at a CAGR of 10.7% during the forecast period.
The market sizing and opportunity analysis has been segmented across the following parameters:
Type of Blood Sample State
- Dried Blood Sample
- Liquid Blood Sample
Method of Sample Collection
- Fingerstick Method
- Push-Button Method
Device Usage
- Single-use Devices
- Reusable Devices
Area of Application
- Diagnostics
- Research
- Therapeutics
- Other Areas of Applications
Key Geographical Regions
- North America
- Europe
- Asia Pacific
- Latin America
- Middle East and North Africa
GLOBAL AT HOME BLOOD COLLECTION DEVICES: GROWTH AND TRENDS
Notably, in the past, approaches used for blood collection were invasive, time consuming and required a healthcare expert. However, in recent years, the methods for blood collection at home have evolved at a rapid pace. In fact, according to a research study, 69% of participants indicated that they would more likely participate in clinical trials if they had the option to provide self-collected samples like self-blood collection. Consequently, the number of at home testing kits have increased in the last few years.
Further, in the COVID-19 era, the demand for point of care treatment had increased to support physical distancing and avoid risk of infections, thus leading to a decline in number of patients visiting laboratories for sample collection and testing. Consequently, it encouraged several stakeholders in the domain to develop novel devices and technologies that can enable patients to collect blood samples remotely at home. With the advancements in molecular detection techniques and a significant reduction in the amount of sample required for testing, miniature devices are transforming diagnostic and monitoring platforms toward point-of-care applications. This technique is well known for capturing minute samples of blood. Moreover, these techniques are more user friendly, as compared to traditional sampling techniques which are highly invasive and may show variation in analysis.
GLOBAL AT HOME BLOOD COLLECTION DEVICES: KEY INSIGHTS
The report delves into the current state of global at home blood collection devices and identifies potential growth opportunities within the industry. Some key findings from the report include:
- Presently, close to 50 at-home blood collection and micro sampling devices are available / being developed; majority of the firms engaged in this domain are startups or small companies located in the US.
- Most of the at-home devices intended for collection of whole capillary blood are presently marketed; DBS technology, used for preparation of dried blood spot cards, has emerged as the most popular platform.
- Recently, TAP(R) II and Tasso-M20 self-blood collecting devices received CE mark approval from the European Commission.
- Examples of companies offering all types of blood samples include (in alphabetical order) DBS System, Neoteryx, Sandstone Diagnostics and Sedia Biosciences.
- In pursuit of gaining a competitive edge, stakeholders are actively expanding their product portfolios and upgrading their devices, via incorporation of advanced features.
- The growing interest of the stakeholders is also reflected from the recent rise in partnership activity; a significant proportion of the deals inked till date were focused on market expansion.
- Over the years, the intellectual property related to blood collection devices has grown at a commendable pace, with majority of the patents being filed by industry players.
- Number of patents filed / granted in this domain have increased at a CAGR of 11%, with maximum number of patents filed / granted in 2019.
- The high value patents focus on blood sample management, including systems and methods for sample collection, stabilization and preservation.
- Most of the patents were filed / granted in North America; in this region, more than 90% patents were filed by the industry players.
- To support the ongoing innovation in this domain, private and public investors have made substantial capital investments, worth ~USD 650 million, in initiatives undertaken by various industry stakeholders.
- Funding and investment activity in this domain has increased at a CAGR of 12%. A significant proportion of the total investment was made in the last two years.
- In addition to large players, several mid-sized and small companies have raised funds through IPO, venture capitals and other equity.
- Given the favourable increase in adoption of at-home blood collection and micro sampling devices during the COVID-19 pandemic, the market is anticipated to witness significant growth in the foreseen future.
Example Players in the At Home Blood Collection Devices
- EUROIMMUN
- Everlywell
- Labcorp
- Labonovum
- Lameditech
- Quest Diagnostics
- Spot On Sciences
- Tasso
- Weavr Health
- YourBio Health
GLOBAL AT HOME BLOOD COLLECTION DEVICES: RESEARCH COVERAGE
- Market Sizing and Opportunity Analysis: The report features an in-depth analysis of the global antiviral drugs market, focusing on key market segments, including [A] type of blood sample state, [B] method of sample collection, [C] device usage, [D] area of application and [E] key geographical regions.
- Market Landscape: A comprehensive evaluation of at-home self-blood collection and micro sampling devices, considering various parameters, such as [A] device class, [B] current status of development, [C] regulatory approvals / certifications received, [D] type of technology, [E] device usage, [F] type of sample, [G] blood sample state, [H] volume of sample collected, [I] puncture site, [J] method of sample collection, [K] storage temperature and [L] application area. Additionally, a comprehensive evaluation of the companies engaged in the development of at home blood collection and micro sampling devices, considering various parameters, such as [A] year of establishment, [B] company size, [C] location of headquarters and [D] most active players (in terms of number of devices).
- Company Profiles: In-depth profiles of companies engaged in at home blood collection devices market, focusing on [A] company overviews, [B] product portfolio and [C] recent developments and an informed future outlook.
- Product Competitiveness Analysis: A comprehensive competitive analysis of at home blood collection and micro sampling devices, examining factors, such as [A] supplier power and [B] key product-related specifications.
- Patent Analysis: An in-depth analysis of patents filed / granted till date in the at home blood collection devices domain, based on various relevant parameters, such as [A] type of patent, [B] publication year, [C] application year, [D] regional applicability, [E] CPC symbols, [F] emerging focus areas, [G] most active players (in terms of the number of patents filed / granted) and [H] patent valuation.
- Partnerships and Collaborations: An insightful analysis of the deals inked by stakeholders in the global at home blood collection devices market, based on several parameters, such as [A] year of partnership, [B] type of partnership model adopted, [C] focus area, [D] therapeutic area and [E] regional distribution.
- Funding and Investments: An in-depth analysis of the fundings received by players in at home blood collection devices market, based on relevant parameters, such as [A] year of investment, [B] number of funding instances, [C] amount invested, [D] type of funding, [E] most active players (in terms of number of funding instances and amount raised), [F] most active investors (in terms of number of funding instances), [G] geographical distribution, [H] purpose of investment and [I] application area.
- Cost Saving Analysis: A comprehensive analysis of cost saving potential associated with the use of at-home self-blood collection and micro sampling devices examining various factors.
KEY QUESTIONS ANSWERED IN THIS REPORT
- How many companies are currently engaged in this market?
- Which are the leading companies in this market?
- What factors are likely to influence the evolution of this market?
- What is the current and future market size?
- What is the CAGR of this market?
- How is the current and future market opportunity likely to be distributed across key market segments?
REASONS TO BUY THIS REPORT
- The report provides a comprehensive market analysis, offering detailed revenue projections of the overall market and its specific sub-segments. This information is valuable to both established market leaders and emerging entrants.
- Stakeholders can leverage the report to gain a deeper understanding of the competitive dynamics within the market. By analyzing the competitive landscape, businesses can make informed decisions to optimize their market positioning and develop effective go-to-market strategies.
- The report offers stakeholders a comprehensive overview of the market, including key drivers, barriers, opportunities, and challenges. This information empowers stakeholders to stay abreast of market trends and make data-driven decisions to capitalize on growth prospects.
ADDITIONAL BENEFITS
- Complimentary PPT Insights Packs
- Complimentary Excel Data Packs for all Analytical Modules in the Report
- 15% Free Content Customization
- Detailed Report Walkthrough Session with Research Team
- Free Updated report if the report is 6-12 months old or older
TABLE OF CONTENTS
1. PREFACE
- 1.1. Scope of the Report
- 1.2. Research Methodology
- 1.2.1. Research Assumptions
- 1.2.2. Project Methodology
- 1.2.3. Forecast Methodology
- 1.2.4. Robust Quality Control
- 1.2.5. Key Considerations
- 1.2.5.1. Demographics
- 1.2.5.2. Economic Factors
- 1.2.5.3. Government Regulations
- 1.2.5.4. Supply Chain
- 1.2.5.5. COVID Impact / Related Factors
- 1.2.5.6. Market Access
- 1.2.5.7. Healthcare Policies
- 1.2.5.8. Industry Consolidation
- 1.3 Key Questions Answered
- 1.4. Chapter Outlines
2. EXECUTIVE SUMMARY
3. INTRODUCTION
- 3.1. Chapter Overview
- 3.2. Overview of At-Home Blood Collection and Micro Sampling Devices
- 3.3. Applications of Blood Sampling and Testing
- 3.3.1. Complete Blood Count
- 3.3.2. Basic Metabolic Panel
- 3.3.3. Lipoprotein Panel
- 3.4. Types of Blood Sampling
- 3.4.1. Dried Blood Sampling
- 3.4.2. Wet Blood Sampling
- 3.5. Benefits of At-Home Blood Collection
- 3.6. Methods Used for At-Home Blood Collection
- 3.6.1. Fingerstick Method
- 3.6.2. Press Button Method
- 3.6.3. Heel-stick Method
- 3.7. Types of At-Home Blood Collection and Micro Sampling Devices
- 3.7.1. Dried Blood Spot Collection Kits
- 3.7.2. Microtainer Tubes
- 3.8. Future Perspectives
4. MARKET OVERVIEW
- 4.1. Chapter Overview
- 4.2. At-Home Blood Collection and Micro Sampling Devices: Overall Market Landscape
- 4.2.1. Analysis by Device Class
- 4.2.2. Analysis by Current Status of Development
- 4.2.3. Analysis by Regulatory Approvals / Certifications Received
- 4.2.4. Analysis by Type of Technology
- 4.2.5. Analysis by Device Usage
- 4.2.6. Analysis by Type of Sample
- 4.2.7. Analysis by Blood Sample State
- 4.2.8. Analysis by Volume of Sample Collected
- 4.2.9. Analysis by Puncture Site
- 4.2.10. Analysis by Method of Sample Collection
- 4.2.11. Analysis by Storage Temperature
- 4.2.12. Analysis by Application Area
- 4.3. At-Home Blood Collection and Micro Sampling Devices: List of Developers
- 4.3.1. Analysis by Year of Establishment
- 4.3.2. Analysis by Company Size
- 4.3.3. Analysis by Geography
- 4.3.4. Analysis by Year of Establishment, Company Size and Location of Headquarters
- 4.4. Most Active Players: Analysis by Number of Products
5. PRODUCT COMPETITIVENESS ANALYSIS
- 5.1. Chapter Overview
- 5.2. Assumptions and Key Input Parameters
- 5.3. Methodology
- 5.3.1. Product Competitiveness Analysis: North America
- 5.3.2. Product Competitiveness Analysis: Europe
- 5.3.3. Product Competitiveness Analysis: Asia-Pacific
6. COMPANY PROFILES
- 6.1. Chapter Overview
- 6.2. EUROIMMUN
- 6.2.1. Company Overview
- 6.2.2. Product Portfolio
- 6.2.3. Recent Developments and Future Outlook
- 6.3. Everlywell
- 6.3.1. Company Overview
- 6.3.2. Product Portfolio
- 6.3.3. Recent Developments and Future Outlook
- 6.4. Labcorp
- 6.4.1. Company Overview
- 6.4.2. Product Portfolio
- 6.4.3. Recent Developments and Future Outlook
- 6.5. Labonovum
- 6.5.1. Company Overview
- 6.5.2. Product Portfolio
- 6.5.3. Recent Developments and Future Outlook
- 6.6. Lameditech
- 6.6.1. Company Overview
- 6.6.2. Product Portfolio
- 6.6.3. Recent Developments and Future Outlook
- 6.7. Quest Diagnostics
- 6.7.1. Company Overview
- 6.7.2. Product Portfolio
- 6.7.3. Recent Developments and Future Outlook
- 6.8. Spot On Sciences
- 6.8.1. Company Overview
- 6.8.2. Product Portfolio
- 6.8.3. Recent Developments and Future Outlook
- 6.9. Tasso
- 6.9.1. Company Overview
- 6.9.2. Product Portfolio
- 6.9.3. Recent Developments and Future Outlook
- 6.10. Weavr Health
- 6.10.1. Company Overview
- 6.10.2. Product Portfolio
- 6.10.3. Recent Developments and Future Outlook
- 6.11. YourBio Health
- 6.11.1. Company Overview
- 6.11.2. Product Portfolio
- 6.11.3. Recent Developments and Future Outlook
7. PATENT ANALYSIS
- 7.1. Chapter Overview
- 7.2. At-Home Blood Collection and Micro Sampling Devices: Patent Analysis
- 7.2.1. Scope and Methodology
- 7.2.2. Analysis by Publication Year
- 7.2.3. Analysis by Publication Year and Type of Patent
- 7.2.4. Analysis by Geography
- 7.2.5. Analysis by CPC Symbols
- 7.2.6. Analysis by Emerging Focus Area
- 7.2.7. Most Active Players: Analysis by Number of Patents
- 7.2.8. Patent Benchmarking Analysis
- 7.2.9. Patent Valuation Analysis
- 7.2.10. Overall Intellectual Property Portfolio: Analysis by Type of Organization
8. PARTNERSHIPS
- 8.1. Chapter Overview
- 8.2. Partnership Models
- 8.3. At-Home Blood Collection and Micro Sampling Devices: List of Partnerships
- 8.3.1. Analysis by Year of Partnership
- 8.3.2. Analysis by Type of Partnership
- 8.3.3. Analysis by Year and Type of Partnership
- 8.3.4. Analysis by Focus Area
- 8.3.5. Analysis by Year of Partnership and Focus Area
- 8.3.6. Analysis by Type of Partnership and Focus Area
- 8.3.7. Analysis by Therapeutic Area
- 8.3.8. Analysis by Region
- 8.3.8.1. Continent-wise Distribution
- 8.3.8.2. Intercontinental and Intracontinental Distribution
- 8.3.8.3. Country-wise Distribution
- 8.3.9. Most Active Players: Analysis by Number of Partnerships
9. FUNDING AND INVESTMENT ANALYSIS
- 9.1. Chapter Overview
- 9.2. Types of Funding
- 9.3. At-Home Blood Collection and Micro Sampling Devices: Funding and Investment Analysis
- 9.3.1. Analysis of Number of Funding Instances by Year
- 9.3.2. Analysis by Amount Invested
- 9.3.3. Analysis by Type of Funding
- 9.3.4. Analysis by Year and Type of Funding
- 9.3.5. Analysis of Amount Invested by Geography
- 9.3.6. Most Active Players: Analysis by Number of Funding Instances and Amount Invested
- 9.3.7. Key Investors: Analysis by Number of Funding Instances
- 9.3.8. Analysis by Purpose of Investment
- 9.3.9. Analysis by Application Area
- 9.4. Concluding Remarks
10. COST SAVING ANALYSIS
- 10.1. Chapter Overview
- 10.2. Key Assumptions
- 10.3. Methodology
- 10.4. Overall Cost Saving Potential of At-Home Blood Collection and Micro Sampling Devices
- 10.5. Concluding Remarks
11. MARKET FORECAST
- 11.1. Chapter Overview
- 11.2. Forecast Methodology and Assumptions
- 11.3. Global At-Home Blood Collection and Micro Sampling Devices Market, Till 2035
- 11.3.1. At-Home Blood Collection and Micro Sampling Devices Market, Till 2035: Analysis by Blood Sample State
- 11.3.1.1. At-Home Blood Collection and Micro Sampling Devices Market for Dried Blood Samples, Till 2035
- 11.3.1.2. At-Home Blood Collection and Micro Sampling Devices Market for Liquid Blood Samples, Till 2035
- 11.3.2. At-Home Blood Collection and Micro Sampling Devices Market, Till 2035: Analysis by Method of Sample Collection
- 11.3.2.1. At-Home Blood Collection and Micro Sampling Devices Market for Fingerstick Method of Sample Collection, Till 2035
- 11.3.2.2. At-Home Blood Collection and Micro Sampling Devices Market for Push-Button Method of Sample Collection, Till 2035
- 11.3.3. At-Home Blood Collection and Micro Sampling Devices Market, Till 2035: Analysis by Device Usage
- 11.3.3.1. At-Home Blood Collection and Micro Sampling Devices Market for Single-use Devices, Till 2035
- 11.3.3.2. At-Home Blood Collection and Micro Sampling Devices Market for Reusable Devices, Till 2035
- 11.3.4. At-Home Blood Collection and Micro Sampling Devices Market, Till 2035: Analysis by Area of Application
- 11.3.4.1. At-Home Blood Collection and Micro Sampling Device Market for Diagnostics, Till 2035
- 11.3.4.2. At-Home Blood Collection and Micro Sampling Device Market for Research, Till 2035
- 11.3.4.3. At-Home Blood Collection and Micro Sampling Device Market for Therapeutics, Till 2035
- 11.3.4.4. At-Home Blood Collection and Micro Sampling Device Market for Other Areas of Application, Till 2035
- 11.3.5. At-Home Blood Collection and Micro Sampling Devices Market, Till 2035: Analysis by Region
- 11.3.5.1. At-Home Blood Collection and Micro Sampling Devices Market in North America, Till 2035
- 11.3.5.2. At-Home Blood Collection and Micro Sampling Devices Market in Europe, Till 2035
- 11.3.5.3. At-Home Blood Collection and Micro Sampling Devices Market in Asia-Pacific, Till 2035
- 11.3.5.4. At-Home Blood Collection and Micro Sampling Devices Market in Latin America, Till 2035
- 11.3.5.5. At-Home Blood Collection and Micro Sampling Devices Market in MENA, Till 2035
- 11.3.1. At-Home Blood Collection and Micro Sampling Devices Market, Till 2035: Analysis by Blood Sample State
12. CONCLUSION
13. EXECUTIVE INSIGHTS
- 13.1. Chapter Overview
- 13.2. Interview Transcript, Business Development Manager, Company A
14. APPENDIX I: TABULATED DATA
15. APPENDIX II: LIST OF COMPANIES AND ORGANIZATIONS
List of Tables
- Table 3.1 Various Applications of Complete Blood Count Test
- Table 3.2 Various Applications of Basic Metabolic Panel
- Table 3.3 Various Applications of Lipoprotein Panel
- Table 4.1 At-Home Blood Collection and Micro Sampling Devices: Current Market Landscape
- Table 4.2 At-Home Blood Collection and Micro Sampling Devices: Information on Devices
- Table 4.3 At-Home Blood Collection and Micro Sampling Devices: Information on Samples Collected
- Table 4.4 At-Home Blood Collection and Micro Sampling Devices: Information on Type of Technology and Application Area
- Table 4.5 At-Home Blood Collection and Micro Sampling Devices: List of Developers
- Table 6.1 EUROIMMUN: Company Overview
- Table 6.2 EUROIMMUN: Product Portfolio
- Table 6.3 Everlywell: Company Overview
- Table 6.4 Everlywell: Product Portfolio
- Table 6.5 Everlywell: Recent Developments and Future Outlook
- Table 6.6 Labcorp: Company Overview
- Table 6.7 Labcorp: Product Portfolio
- Table 6.8 Labonovum: Company Overview
- Table 6.9 Labonovum: Product Portfolio
- Table 6.10 Lameditech: Company Overview
- Table 6.11 Lameditech: Product Portfolio
- Table 6.12 Quest Diagnostics: Company Overview
- Table 6.13 Quest Diagnostics: Product Portfolio
- Table 6.14 Spot on Sciences: Company Overview
- Table 6.15 Spot on Sciences: Product Portfolio
- Table 6.16 Spot on Science: Recent Developments and Future Outlook
- Table 6.17 Tasso: Company Overview
- Table 6.18 Tasso: Product Portfolio
- Table 6.19 Tasso: Recent Developments and Future Outlook
- Table 6.20 Weavr Health: Company Overview
- Table 6.21 Weavr Health: Product Portfolio
- Table 6.22 Weavr Health: Recent Developments and Future Outlook
- Table 6.23 YourBio Health: Company Overview
- Table 6.24 YourBio Health: Product Portfolio
- Table 7.1 Patent Analysis: List of Top CPC Symbols
- Table 7.2 Patent Analysis: Summary of Benchmarking Analysis
- Table 7.3 Patent Analysis: Various Categorizations based on Weighted Valuation Scores
- Table 7.4 Patent Analysis: List of Leading Patents (In Terms of Highest Relative Valuation)
- Table 8.1 At-Home Blood Collection and Micro Sampling Devices: List of Partnerships
- Table 8.2 Partnerships: Information on Focus Area and Therapeutic Area
- Table 9.1 At-Home Blood Collection and Micro Sampling Device Market: Funding and Investments, Since 2013
- Table 9.2 Funding and Investment Analysis: Summary of Investments
- Table 9.3 Funding and Investment Analysis: Summary of Venture Capital Funding
- Table 9.4 At-Home Blood Collection and Micro Sampling Device Market: Information on Purpose of Funding and Area of Application, Since 2013
- Table 14.1 At-Home Blood Collection and Micro Sampling Devices: Distribution by Device Class
- Table 14.2 At-Home Blood Collection and Micro Sampling Devices: Distribution by Current Status of Development
- Table 14.3 At-Home Blood Collection and Micro Sampling Devices: Distribution by Regulatory Approvals / Certifications Received
- Table 14.4 At-Home Blood Collection and Micro Sampling Devices: Distribution by Type of Technology
- Table 14.5 At-Home Blood Collection and Micro Sampling Devices: Distribution by Device Usage
- Table 14.6 At-Home Blood Collection and Micro Sampling Devices: Distribution by Type of Sample
- Table 14.7 At-Home Blood Collection and Micro Sampling Devices: Distribution by Blood Sample State
- Table 14.8 At-Home Blood Collection and Micro Sampling Devices: Distribution by Volume of Sample Collected
- Table 14.9 At-Home Blood Collection and Micro Sampling Devices: Distribution by Puncture Site
- Table 14.10 At-Home Blood Collection and Micro Sampling Devices: Distribution by Method of Sample Collection
- Table 14.11 At-Home Blood Collection and Micro Sampling Devices: Distribution by Storage Temperature
- Table 14.12 At-Home Blood Collection and Micro Sampling Devices: Distribution by Application Area
- Table 14.13 At-Home Blood Collection and Micro Sampling Device Developers: Distribution by Year of Establishment
- Table 14.14 At-Home Blood Collection and Micro Sampling Device Developers: Distribution by Company Size
- Table 14.15 At-Home Blood Collection and Micro Sampling Device Developers: Distribution by Location of Headquarters (Continent-wise)
- Table 14.16 At-Home Blood Collection and Micro Sampling Device Developers: Distribution by Location of Headquarters (Country-wise)
- Table 14.17 At-Home Blood Collection and Micro Sampling Device Developers: Distribution by Year of Establishment, Company Size and Location of Headquarters
- Table 14.18 Most Active Players: Distribution by Number of Products
- Table 14.19 Most Active Players: Distribution by Current Status of Development
- Table 14.20 Patent Analysis: Distribution by Type of Patent
- Table 14.21 Patent Analysis: Cumulative Distribution by Publication Year, Since 2015
- Table 14.22 Patent Analysis: Distribution by Type of Patent and Publication Year
- Table 14.23 Patent Analysis: Distribution by Geography
- Table 14.24 Patent Analysis: North America Scenario
- Table 14.25 Patent Analysis: Asia-Pacific Scenario
- Table 14.26 Most Active Players: Distribution by Number of Patents
- Table 14.27 Patent Analysis: Distribution by Patent Age
- Table 14.28 Overall Intellectual Property Portfolio: Distribution by Type of Organization
- Table 14.29 Partnerships: Cumulative Year-wise Trend, Since 2016
- Table 14.30 Partnerships: Distribution by Type of Partnership
- Table 14.31 Partnerships: Distribution by Year and Type of Partnership
- Table 14.32 Partnerships: Distribution by Focus Area
- Table 14.33 Partnerships: Distribution by Type of Partnership and Focus Area
- Table 14.34 Partnerships: Distribution by Therapeutic Area
- Table 14.35 Partnerships: Continent-wise Distribution
- Table 14.36 Partnerships: Country-wise Distribution
- Table 14.37 Most Active Players: Distribution by Number of Partnerships
- Table 14.38 Funding and Investment Analysis: Cumulative Year-wise Distribution of Number of Instances, Since 2013
- Table 14.39 Funding and Investment Analysis: Cumulative Year-wise Distribution of Amount Invested, Since 2013 (USD Million)
- Table 14.40 Funding and Investment Analysis: Distribution by Type of Funding, Since 2013
- Table 14.41 Funding and Investment Analysis: Distribution of Amount Invested by Type of Funding, Since 2013 (USD Million)
- Table 14.42 Funding and Investment Analysis: Distribution by Year and Type of Funding, Since 2013
- Table 14.43 Funding and Investment Analysis: Summary of Investments, Since 2013 (USD Million)
- Table 14.44 Funding and Investment Analysis: Distribution by Geography
- Table 14.45 Funding and Investment Analysis: Regional Distribution of Funding Instances
- Table 14.46 Most Active Players: Distribution by Number of Funding Instances
- Table 14.47 Most Active Players: Distribution by Amount Invested
- Table 14.48 Funding and Investment Analysis: Distribution by Type of Investor
- Table 14.49 Key Investors: Distribution by Number of Funding Instances
- Table 14.50 Funding and Investment Analysis: Distribution by Purpose of Investment
- Table 14.51 Funding and Investment Analysis: Distribution by Application Area
- Table 14.52 Overall Cost Saving Potential of At-Home Blood Collection and Micro Sampling Devices, Till 2035 (USD Million)
- Table 14.53 Global At-Home Blood Collection and Micro Sampling Device Market, Conservative, Base and Optimistic Scenarios, Till 2031 (USD Million)
- Table 14.54 At-Home Blood Collection and Micro Sampling Device Market: Distribution by Blood Sample State, Till 2035 (USD Million)
- Table 14.55 At-Home Blood Collection and Micro Sampling Device Market for Dried Blood Samples, Conservative, Base and Optimistic Scenarios, Till 2031 (USD Million)
- Table 14.56 At-Home Blood Collection and Micro Sampling Device Market for Liquid Blood Samples, Conservative, Base and Optimistic Scenarios, Till 2031 (USD Million)
- Table 14.57 At-Home Blood Collection and Micro Sampling Device Market: Distribution by Method of Sample Collection, Till 2035 (USD Million)
- Table 14.58 At-Home Blood Collection and Micro Sampling Device Market for Fingerstick Method of Sample Collection, Conservative, Base and Optimistic Scenarios, Till 2031 (USD Million)
- Table 14.59 At-Home Blood Collection and Micro Sampling Device Market for Push-Button Method of Sample Collection, Conservative, Base and Optimistic Scenarios, Till 2031 (USD Million)
- Table 14.60 At-Home Blood Collection and Micro Sampling Device Market: Distribution by Device Usage, Till 2035 (USD Million)
- Table 14.61 At-Home Blood Collection and Micro Sampling Device Market for Single-use Devices, Conservative, Base and Optimistic Scenarios, Till 2031 (USD Million)
- Table 14.62 At-Home Blood Collection and Micro Sampling Device Market for Reusable Devices, Conservative, Base and Optimistic Scenarios, Till 2031 (USD Million)
- Table 14.63 At-Home Blood Collection and Micro Sampling Device Market: Distribution by Areas of Application, Till 2035 (USD Million)
- Table 14.64 At-Home Blood Collection and Micro Sampling Device Market for Diagnostics Purposes, Conservative, Base and Optimistic Scenarios, Till 2031 (USD Million)
- Table 14.65 At-Home Blood Collection and Micro Sampling Device Market for Research Purposes, Conservative, Base and Optimistic Scenarios, Till 2035 (USD Million)
- Table 14.66 At-Home Blood Collection and Micro Sampling Device Market for Therapeutics Purposes, Conservative, Base and Optimistic Scenarios, Till 2035 (USD Million)
- Table 14.67 At-Home Blood Collection and Micro Sampling Device Market for Other Areas of Application, Conservative, Base and Optimistic Scenarios, Till 2035 (USD Million)
- Table 14.68 At-Home Blood Collection and Micro Sampling Device Market: Distribution by Region, Till 2035 (USD Million)
- Table 14.69 At-Home Blood Collection and Micro Sampling Device Market in North America, Conservative, Base and Optimistic Scenarios, Till 2035 (USD Million)
- Table 14.70 At-Home Blood Collection and Micro Sampling Device Market in Europe, Conservative, Base and Optimistic Scenarios, Till 2035 (USD Million)
- Table 14.71 At-Home Blood Collection and Micro Sampling Device Market in Asia-Pacific, Conservative, Base and Optimistic Scenarios, Till 2035 (USD Million)
- Table 14.72 At-Home Blood Collection and Micro Sampling Device Market in Latin America, Conservative, Base and Optimistic Scenarios, Till 2035 (USD Million)
- Table 14.73 At-Home Blood Collection and Micro Sampling Device Market in MENA, Conservative, Base and Optimistic Scenarios, Till 2035 (USD Million)
List of Figures
- Figure 2.1 Executive Summary: Current Market Landscape
- Figure 2.2 Executive Summary: Product Competitiveness Analysis
- Figure 2.3 Executive Summary: Patent Analysis
- Figure 2.4 Executive Summary: Partnerships and Collaborations
- Figure 2.5 Executive Summary: Funding and Investment Analysis
- Figure 2.6 Executive Summary: Cost Saving Analysis
- Figure 2.7 Executive Summary: Market Sizing and Opportunity Analysis
- Figure 3.1 Process of Sampling Dried Blood
- Figure 4.1 At-Home Blood Collection and Micro Sampling Devices: Distribution by Device Class
- Figure 4.2 At-Home Blood Collection and Micro Sampling Devices: Distribution by Current Status of Development
- Figure 4.3 At-Home Blood Collection and Micro Sampling Devices: Distribution by Regulatory Approvals / Certifications Received
- Figure 4.4 At-Home Blood Collection and Micro Sampling Devices: Distribution by Type of Technology
- Figure 4.5 At-Home Blood Collection and Micro Sampling Devices: Distribution by Device Usage
- Figure 4.6 At-Home Blood Collection and Micro Sampling Devices: Distribution by Type of Sample
- Figure 4.7 At-Home Blood Collection and Micro Sampling Devices: Distribution by Blood Sample State
- Figure 4.8 At-Home Blood Collection and Micro Sampling Devices: Distribution by Volume of Sample Collected
- Figure 4.9 At-Home Blood Collection and Micro Sampling Devices: Distribution by Puncture Site
- Figure 4.10 At-Home Blood Collection and Micro Sampling Devices: Distribution by Method of Sample Collection
- Figure 4.11 At-Home Blood Collection and Micro Sampling Devices: Distribution by Storage Temperature
- Figure 4.12 At-Home Blood Collection and Micro Sampling Devices: Distribution by Application Area
- Figure 4.13 At-Home Blood Collection and Micro Sampling Device Developers: Distribution by Year of Establishment
- Figure 4.14 At-Home Blood Collection and Micro Sampling Device Developers: Distribution by Company Size
- Figure 4.15 At-Home Blood Collection and Micro Sampling Device Developers: Distribution by Location of Headquarters (Continent-wise)
- Figure 4.16 At-Home Blood Collection and Micro Sampling Device Developers: Distribution by Location of Headquarters (Country-wise)
- Figure 4.17 At-Home Blood Collection and Micro Sampling Device Developers: Distribution by Year of Establishment, Company Size and Location of Headquarters
- Figure 4.18 Most Active Players: Distribution by Number of Products
- Figure 4.19 Most Active Players: Distribution by Current Status of Development
- Figure 5.1 Product Competitiveness Analysis: North America Scenario
- Figure 5.2 Product Competitiveness Analysis: Europe Scenario
- Figure 5.3 Product Competitiveness Analysis: Asia-Pacific Scenario
- Figure 7.1 Patent Analysis: Distribution by Type of Patent
- Figure 7.2 Patent Analysis: Cumulative Distribution by Publication Year, Since 2015
- Figure 7.3 Patent Analysis: Distribution by Type of Patent and Publication Year
- Figure 7.4 Patent Analysis: Distribution by Geography
- Figure 7.5 Patent Analysis: North America Scenario
- Figure 7.6 Patent Analysis: Asia-Pacific Scenario
- Figure 7.7 Patent Analysis: Distribution by CPC Symbols
- Figure 7.8 Patent Analysis: Distribution by Emerging Focus Area
- Figure 7.9 Most Active Players: Distribution by Number of Patents
- Figure 7.10 Patent Benchmarking Analysis: Your Bio Health and Becton Dickinson
- Figure 7.11 Patent Benchmarking Analysis: Other Leading Players
- Figure 7.12 Patent Portfolio: Distribution by Patent Age
- Figure 7.13 Patent Valuation Analysis
- Figure 7.14 Overall Intellectual Property Portfolio: Distribution by Type of Organization
- Figure 8.1 Partnerships: Cumulative Year-wise Trend, Since 2016
- Figure 8.2 Partnerships: Distribution by Type of Partnership
- Figure 8.3 Partnerships: Distribution by Year and Type of Partnership
- Figure 8.4 Partnerships: Distribution by Focus Area
- Figure 8.5 Partnerships: Distribution by Year of Partnership and Focus Area
- Figure 8.6 Heat Map: Distribution by Type of Partnership and Focus Area
- Figure 8.7 Partnerships: Distribution by Therapeutic Area
- Figure 8.8 Partnerships: Continent-wise Distribution
- Figure 8.9 Partnerships: Intercontinental and Intracontinental Agreements
- Figure 8.10 Partnerships: Country-wise Distribution
- Figure 8.11 Most Active Players: Distribution by Number of Partnerships
- Figure 9.1 Funding and Investment Analysis: Cumulative Year-wise Distribution of Number of Instances, Since 2013
- Figure 9.2 Funding and Investment Analysis: Cumulative Year-wise Distribution of Amount Invested, Since 2013 (USD Million)
- Figure 9.3 Funding and Investment Analysis: Distribution by Type of Funding, Since 2013
- Figure 9.4 Funding and Investment Analysis: Distribution of Amount Invested by Type of Funding, Since 2013 (USD Million)
- Figure 9.5 Funding and Investment Analysis: Distribution by Year and Type of Funding, Since 2013
- Figure 9.6 Funding and Investment Analysis: Distribution by Year, Type of Funding and Amount Invested, Since 2013 (USD Million)
- Figure 9.7 Funding and Investment Analysis: Summary of Investments, Since 2013 (USD Million)
- Figure 9.8 Funding and Investment Analysis: Distribution by Geography
- Figure 9.9 Funding and Investment Analysis: Regional Distribution of Funding Instances
- Figure 9.10 Most Active Players: Distribution by Number of Funding Instances
- Figure 9.11 Most Active Players: Distribution by Amount Invested
- Figure 9.12 Funding and Investment Analysis: Distribution by Type of Investor
- Figure 9.13 Key Investors: Distribution by Number of Funding Instances
- Figure 9.14 Funding and Investment Analysis: Distribution by Purpose of Investment
- Figure 9.15 Funding and Investment Analysis: Distribution by Application Area
- Figure 10.1 Overall Cost Saving Potential of At-Home Blood Collection and Micro Sampling Devices, Till 2035 (USD Million)
- Figure 11.1 Global At-Home Blood Collection and Micro Sampling Device Market, Till 2035 (USD Million)
- Figure 11.2 At-Home Blood Collection and Micro Sampling Device Market: Distribution by Blood Sample State, Till 2035 (USD Million)
- Figure 11.3 At-Home Blood Collection and Micro Sampling Device Market for Dried Blood Samples, Till 2035 (USD Million)
- Figure 11.4 At-Home Blood Collection and Micro Sampling Device Market for Liquid Blood Samples, Till 2035 (USD Million)
- Figure 11.5 At-Home Blood Collection and Micro Sampling Device Market: Distribution by Method of Sample Collection, Till 2035 (USD Million)
- Figure 11.6 At-Home Blood Collection and Micro Sampling Device Market for Fingerstick Method of Sample Collection, Till 2035 (USD Million)
- Figure 11.7 At-Home Blood Collection and Micro Sampling Device Market for Push-Button Method of Sample Collection, Till 2035 (USD Million)
- Figure 11.8 At-Home Blood Collection and Micro Sampling Device Market: Distribution by Device Usage, Till 2035 (USD Million)
- Figure 11.9 At-Home Blood Collection and Micro Sampling Device Market for Single-use Devices, Till 2035 (USD Million)
- Figure 11.10 At-Home Blood Collection and Micro Sampling Device Market for Reusable Devices, Till 2035 (USD Million)
- Figure 11.11 At-Home Blood Collection and Micro Sampling Device Market: Distribution by Areas of Application, Till 2035 (USD Million)
- Figure 11.12 At-Home Blood Collection and Micro Sampling Device Market for Diagnostic Purposes, Till 2035 (USD Million)
- Figure 11.13 At-Home Blood Collection and Micro Sampling Device Market for Research Purposes, Till 2035 (USD Million)
- Figure 11.14 At-Home Blood Collection and Micro Sampling Device Market for Therapeutic Purposes, Till 2035 (USD Million)
- Figure 11.15 At-Home Blood Collection and Micro Sampling Device Market for Other Areas of Application, Till 2035 (USD Million)
- Figure 11.16 At-Home Blood Collection and Micro Sampling Device Market: Distribution by Region, Till 2035 (USD Million)
- Figure 11.17 At-Home Blood Collection and Micro Sampling Device Market in North America, Till 2035 (USD Million)
- Figure 11.18 At-Home Blood Collection and Micro Sampling Device Market in Europe, Till 2035 (USD Million)
- Figure 11.19 At-Home Blood Collection and Micro Sampling Device Market in Asia-Pacific, Till 2035 (USD Million)
- Figure 11.20 At-Home Blood Collection and Micro Sampling Device Market in Latin America, Till 2035 (USD Million)
- Figure 11.21 At-Home Blood Collection and Micro Sampling Device Market in MENA, Till 2035 (USD Million)
- Figure 12.1 Concluding Remarks: Current Market Landscape
- Figure 12.2 Concluding Remarks: Product Competitiveness Analysis
- Figure 12.3 Concluding Remarks: Patent Analysis
- Figure 12.4 Concluding Remarks: Partnerships and Collaborations
- Figure 12.5 Concluding Remarks: Funding and Investment Analysis
- Figure 12.6 Concluding Remarks: Market Sizing and Opportunity Analysis
 2025 年至 2033 年血液采集市场规模、份额、趋势及预测(依产品、应用、最终用途及地区)
 全球血液采集市场(按产品类型、技术、最终用户和应用)预测 2025-2032
 2025年全球毛细血管采血装置市场报告2025年全球血液采集、处理及管理设备市场报告2025年全球采血设备市场报告干血斑采集卡市场按产品类型、技术、样本类型、应用、最终用户和分销管道划分-2025-2030 年全球预测
 血液采集设备市场规模、份额、按产品、方法、最终用户和地区分類的成长分析 - 产业预测,2025 年至 2032 年
 全球干血斑采集卡市场血液采集市场机会、成长动力、产业趋势分析及 2025 - 2034 年预测2025年全球自采样血液采集及储存设备市场报告