


 |
市场调查报告书
商品编码
1771302
慢性疼痛治疗市场:产业趋势及全球预测 - 依适应症、分子类型、作用机制和主要地区Chronic Pain Treatment Market: Industry Trends and Global Forecasts - Distribution by Type of Indication, Type of Molecule, Mechanism of Action and Key Geographical Regions |
||||||
全球慢性疼痛治疗市场:概览
今年全球慢性疼痛治疗市场规模达 73亿美元。预计市场在预测期内将以良好的年复合成长率成长。
市场区隔及机会分析依下列参数细分:
适应症类型
- 慢性腰痛
- 腰椎神经根病
- 偏头痛
- 骨关节炎
- 神经性疼痛
分子类型
- 小分子
- 生物製剂
作用机转
- CGRP抑制剂
- COX/NGF抑制剂
- TRPV1 受体拮抗剂
- 通道阻断剂
- 其他
主要地区
- 北美
- 欧洲
- 亚洲太平洋地区
- 拉丁美洲
- 中东和北非
全球慢性疼痛治疗市场:成长与趋势
慢性疼痛是对潜在疾病的一种心理生理反应,持续时间超过六个月,通常对各种治疗方法均无反应。值得注意的是,据估计,全球有超过15亿人经历这种疼痛。值得注意的是,鸦片类药物是治疗中度至重度疼痛最常用的药物,这得益于其快速起效的特性。然而,阿片类药物可能会引起欣快感,这常导致滥用和成瘾。此外,娱乐性用药的增加也加剧了鸦片类药物依赖问题。事实上,根据美国疾病管制与预防中心国家卫生统计中心2024年的报告,美国有54,743人死于处方鸦片类药物滥用。阿片类药物危机的严重性促使製药公司致力于开髮用于慢性疼痛管理的非成瘾性、非麻醉性治疗和镇痛药。
与鸦片类药物不同,非鸦片类药物不会针对脑受体,因此不会成瘾。非鸦片类药物透过抑制损伤或感染部位的环氧合酶(COX)来抑制前列腺素的产生,直接作用于受损或患病组织。此机制抑制了周边神经系统内疼痛介质的形成。此外,各种疼痛管理设备已证明可以显着减少甚至消除对药物治疗的需求。
全球慢性疼痛治疗市场:关键洞察
本报告探讨了全球慢性疼痛治疗市场的现状,并识别了潜在的成长机会。主要调查结果包括:
- 非鸦片类疼痛管理解决方案市场正以惊人的速度成长,因为核准的药物很少,且有多种候选药物处于临床/临床前阶段。
- 大多数(超过 45%)具有多种作用机制的候选药物处于早期开发阶段,口服给药途径仍是首选途径。
- 凭藉强大的早期和临床前研发管线,该行业已做好准备,以满足目前对具有新型生物靶点的非阿片类药物替代品尚未满足的需求。
- 目前有几种针对TRPV1受体的临床阶段受体促效剂。大多数上市药物是抗发炎药和钙拮抗剂。
- 值得注意的是,大多数(约45%)用于慢性疼痛治疗的非鸦片类药物都是口服给药。
- 此研发管线提供许多处于晚期和临床前阶段的小分子,这些小分子能够轻鬆阻断离子通道并拮抗促痛受体。
- 随着时间的推移,基于设备的疼痛管理解决方案也已成为麻醉药和疗法的可行替代方案。
- 已确定一系列基于各种疼痛缓解技术的设备,这些设备可以植入或表面敷用以缓解疼痛。
- 许多设备透过致力于疼痛区域来提供竞争优势。此类装置的范例包括 Actipatch、Biobeam 940 和 Caretec IV。
- 具有熟悉使用者介面的穿戴式装置(25%)和手持装置(20%)更有可能被更广泛的客户群所采用。
- 虽然市场上有多种基于刺激的设备,但下一代设备致力于创新、微创的疼痛缓解机制。
- 为了获得竞争优势,製造商正致力于将高级功能整合到其产品组合中。
- 随着投资人意识到非鸦片类药物替代品在治疗慢性疼痛方面的许多益处和前景,各公司筹集大量资金。
- 这些公司包括 Centrexion Therapeutics、Hydra Bioscience、NeurogesX 和 Vapogenix。
- 大部分投资由利害关係人透过多轮创投筹集,主要是 B 轮创投。
- 一些投资者支持非阿片类药物开发商的计划,其中只有美国国立卫生研究院(NIH)在该领域提供了大量资金。
- 随着人们对慢性疼痛药物领域的兴趣日益浓厚,设备供应商和其他利害关係人之间已经建立了多项合作关係。值得注意的是,大多数合作(超过 25%)都是商业化交易。
- 随着未来多个处于后期研发阶段的分子获得上市批准,该市场可能会以显着的速度成长。
参与慢性疼痛治疗市场的公司范例
- Stimwave
- BlueWind Medical
- Omron Healthcare
- Cefaly Technologies
- Prizm Medical
- PainPod
- Neurometrix
- Chattem
- Silk'n Therapy
- ElectroMedical Technologies
本报告调查全球慢性疼痛治疗市场,提供市场概述,以及依适应症、分子类型、作用机制和地区的趋势,和参与市场的公司简介。
目录
第1章 前言
第2章 执行摘要
第3章 导论
- 疼痛的定义
- 疼痛的分类
- 急性疼痛
- 慢性疼痛
- 疼痛管理
- 未来展望
第4章 慢性疼痛管理:未满足需求分析
- 章节概述
- 未满足需求分析
第5章 产品线回顾:已上市及在研药物
- 章节概述
- 用于治疗慢性疼痛的非鸦片类药物管理:已上市及在研产品线
- 用于慢性疼痛管理的非鸦片类药物:产品线分析
第6章 已上市产品生命週期管理策略
- 简介
- 产品简介:Duexis®(Horizon Pharma)
- 产品简介:Gralise®(Depomed)
- 产品简介:Horizant®(Arbor Pharmaceuticals)
- 产品简介:Vimovo®(AstraZeneca与Pozen)
第7章 药物简介:后期分子药物
- 章节概述
- 药物简介:Aimovig™/Erenumab
- 药物简介:Analgecine
- 药物简介:Atogepant/AGN 241689/MK 8031
- 药物简介:Civamide/Sibanex/Zucapsaicin
- 药物简介:CNTX-4975
- 药物简介:Eptinezumab/ALD403
- 药物简介:Fasinumab
- 药物简介:Fremanezumab
- 药物简介:Galcanezumab/LY2951742
- 药物简介:Lasmiditan/COL-144
- 药物简介:Mirogabalin/DS-5565
- 药物简介:MPC-06-ID
- 药物简介:Neridronate
- 药物简介:NTM-001
- 药物简介:NTM-002
- 药物简介:Perampanel (E2007)
- 药物简介:Posimir(SABER-Bupivacaine)
- 药物简介:Ralfinamide
- 药物简介:SP-102
- 药物简介:T-121
- 药物简介:Tanezumab
- 药物简介:Tetrodotoxin/TTX
- 药物简介:Ubrogepant/MK-1602
- 药物简介:YHD1119/PREGABALIN
第8章 慢性疼痛管理设备:市场模式
- 章节概述
- 疼痛管理设备:资料库
- 疼痛管理设备:资料库分析
第9章 设备竞争分析及概况
- 章节概述
- 研究方法论
- 植入物
- 穿戴式装置
- 其他
第10章 合作伙伴关係与合作
- 章节概述
- 合作模式
- 用于慢性疼痛管理的非鸦片类药物和设备:近期的合作伙伴关係与合作
第11章 资金与投资分析
- 章节概述
- 资金类型
- 用于慢性疼痛管理的非鸦片类药物:资金与投资分析
- 结论
第12章 市场预测与机会分析
- 章节概述
- 关键假设
- 预测研究法
- 2018年以来慢性疼痛管理市场中非鸦片类药物的整体趋势
- 非鸦片类药物市场:依治疗领域
- 非鸦片类药物市场:依分子类型
- 非鸦片类药物市场:依作用机转
- 非鸦片类药物市场:依地区
- 非鸦片类药物市场:依产品划分的销售预测
- Qutenza®(Accorda Therapeutics)
- Vymovo®(Horizon Pharma)
- Duexis®(Horizon Pharma)
- Glaris®(Depomed)
- Horizant®(Arbor Pharmaceuticals)
- Zilletta®(Flexion Therapeutics)
- Ztlido™(Sorrento Therapeutics)
- Aimovig(TM)(Amgen)
- Fremanezumab(Teva Pharmaceuticals)
- Galcanezumab(Eli Lilly)
- Mirogabalin(DS-5565)(Daiichi Sankyo)
- YHD1119(Yuhan corporation)
- GLA5PR(GL PharmTech)
- Eptinezumab(Alder Biopharmaceuticals)
- ALLOD-2(Allodynic Therapeutics)
- Painbrake(R)(GT Biopharma)
- Neridronate(Grunenthal)
- Fasinumab(Regeneron Pharmaceuticals)
- SP-102(Semnur Pharmaceuticals)
- CNTX-4975(Centrexion Therapeutics)
- MPC-06-ID(Mesoblast)
- Tanezumab
- 2018年及以后疼痛管理设备市场概况
- 各地区疼痛管理设备市场
- 各设备类型疼痛管理设备市场
- 各作用机制疼痛管理设备市场
第13章 结论
- 鸦片类药物危机已导致大量患者因滥用管制药物而死亡,药物开发商积极开发替代性疼痛管理解决方案。
- 非鸦片类药物治疗市场拥有针对各种慢性疾病的强大候选药物研发管线。
- 各种创新设备也可用于治疗以慢性疼痛为特征的各种临床疾病。
- 来自各类投资者的合作活动和资金支持日益增多,显示未来潜力巨大。
- 鑑于尚未满足的需求,预计市场在不久的将来将稳定成长。
第14章 高层洞察
第15章 附录一
第16章 附录二
GLOBAL CHRONIC PAIN TREATMENT MARKET: OVERVIEW
As per Roots Analysis, the global chronic pain treatment market valued at USD 7.3 billion in the current year is anticipated to grow at a lucrative CAGR during the forecast period.
The market sizing and opportunity analysis has been segmented across the following parameters:
Type of Indication
- Chronic Back Pain
- Lumbar Radiculopathy
- Migraine
- Osteoarthritis
- Neuropathic Pain
Type of Molecule
- Small Molecule
- Biologic
Mechanism of Action
- CGRP Inhibitors
- COX/ NGF Inhibitors
- TRPV1 Receptor Antagonists
- Channel Blockers
- Others
Key Geographical Regions
- North America
- Europe
- Asia-Pacific
- Latin America
- Middle East and North Africa
GLOBAL CHRONIC PAIN TREATMENT MARKET: GROWTH AND TRENDS
Chronic pain is a psychophysiological response to an underlying medical condition that persists for more than six months and typically does not respond to various treatment approaches. It is worth mentioning that as per the estimates over 1.5 billion people worldwide experience this form of pain. Notably, opioids remain among the most commonly used pharmacological treatments for moderate to severe pain. This can be attributed to their rapid onset of action and high effectiveness in providing immediate relief. However, opioids can induce feelings of euphoria, which often leads to misuse and addiction. Further, increased recreational use has significantly contributed to the problem of opioid dependency. In fact, according to a 2024 report by CDC's National Center for Health Statistics, 54,743 people died in the United States as a result of misuse of prescribed opioids. The severity of the opioid crisis has driven pharmaceutical companies to focus on developing non-addictive, non-narcotic therapeutics and analgesics for the management of chronic pain.
In contrast to opioids, non-opioid medications do not target brain receptors and are therefore non-addictive. These drugs act directly on injured or diseased tissues, specifically by blocking the production of prostaglandins through inhibition of the cyclooxygenase (COX) enzyme at the site of injury or infection. This mechanism reduces the formation of pain mediators within the peripheral nervous system. Furthermore, a variety of pain management devices have been shown to significantly decrease or even eliminate the need for drug-based treatments.
GLOBAL CHRONIC PAIN TREATMENT MARKET: KEY INSIGHTS
The report delves into the current state of global chronic pain treatment market and identifies potential growth opportunities within industry. Some key findings from the report include:
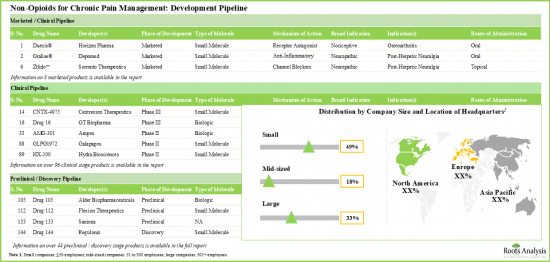
- With few approved drugs and several clinical / preclinical candidates, the market for non-opioid pain management solutions is growing at a commendable pace.
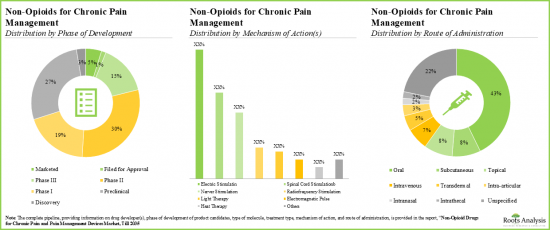
- Majority (>45%) of the pipeline candidates, having diverse mechanisms of action, are in the early stages of development; the oral route continues to be the preferred mode of drug delivery.
- Given a strong early-stage and preclinical pipeline, the industry is likely to address the current unmet need for non-opioid alternatives with novel biological targets.
- There are several clinical stage receptor agonists designed to target the TRPV1 receptor. Most of the marketed drugs are anti-inflammatory agents and calcium channel blockers.
- Notably, majority (~45%) of the non-opioids for chronic pain management are administered through oral route of administration.
- Benefited by easily blocking ion-channels and antagonizing pain proliferating receptors, the pipeline offers many small molecules in both advanced and preclinical stages.
- Over time, several device-based pain management solutions have also emerged as viable alternatives to narcotic drugs / therapies.
- We identified various devices, based on diverse pain relief technologies, which can be either implanted or superficially applied on the body to provide relief from pain.
- Numerous devices have a competitive advantage by focusing on the pain sensation area; examples of such devices include ActiPatch, BioBeam 940, CareTec IV.
- With friendly user interface, wearable (25%) and hand-held devices (20%) are likely to be adopted by a wide customer base; examples include ElectroCore and Interx Technologies.
- Although the market is characterized with multiple stimulation-based devices, next generation devices focus on innovative and less invasive mechanisms for pain relief.
- In pursuit of gaining a competitive edge, manufacturers are focusing on the integration of advanced features in their respective product portfolios.
- Companies have raised significant amounts in financing as investors have realized numerous benefits and future potential for non-opioid alternatives to chronic pain.
- Investments in various companies have fostered innovation in this domain; examples include Centrexion Therapeutics, Hydra Bioscience, NeurogesX and Vapogenix.
- The significant share of investments was raised by stakeholders through various rounds of venture capital funding, primarily in venture series B.
- Multiple investors have supported the initiatives of non-opioid drug developers; huge amount has been awarded only by NIH in the domain.
- With the growing interest in the field of chronic pain therapeutics, several partnerships have been established between device providers and other stakeholders. Notably, most (>25%) of the partnerships were commercialization agreements.
- Prevalent trends indicate that the market is likely to grow at a significant pace as multiple late-stage molecules receive marketing approval in the foreseen future.
Example Players in the Chronic Pain Treatment Market
- Stimwave
- BlueWind Medical
- Omron Healthcare
- Cefaly Technologies
- Prizm Medical
- PainPod
- Neurometrix
- Chattem
- Silk'n Therapy
- ElectroMedical Technologies
PRIMARY RESEARCH OVERVIEW
The opinions and insights presented in this study were influenced by discussions conducted with multiple stakeholders. The research report features detailed transcripts of interviews conducted with the following industry stakeholders:
- Chief Executive Officer, Company A
- Chief Advocacy Officer, Company B
- Chief Executive Officer, Company C
- Director of Clinical Affairs and New Markets, Company D
GLOBAL CHRONIC PAIN TREATMENT MARKET: RESEARCH COVERAGE
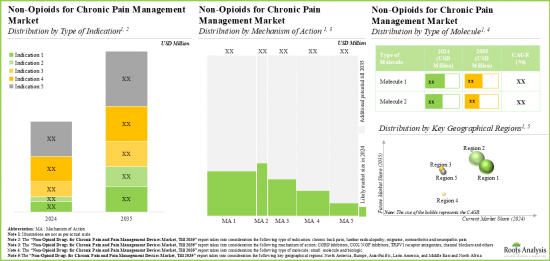
- Market Sizing and Opportunity Analysis: The report features an in-depth analysis of the global chronic pain treatment market, focusing on key market segments, including [A] type of indication, [B] type of molecule, [C] mechanism of action and [D] key geographical regions.
- Drugs Market Landscape: A comprehensive evaluation of drugs being developed for the treatment of chronic pain, considering various parameters, such as [A] information on their respective developer(s), [B] phase of development, [C] type of molecule, [D] indication, [E] mechanism of action and [F] route of administration.
- Pipeline Review of Marketed and Development Drugs: A detailed analysis of product pipeline and developer companies, highlighting [A] a mirror analysis depicting the relative popularity of different disease indications based on the number of molecules available / under development for each indication and the number of companies involved, [B] a comprehensive analysis of the various industry players involved in chronic pain treatment market, distributed on the basis of location of headquarters and company size, [C] a detailed analysis highlighting the distribution of marketed and pipeline molecules based on their respective mechanisms of action, and [D] an analysis highlighting the distribution of molecules on the basis of stage of development, route of administration and treatment type.
- Unmet Need Analysis: A comprehensive evaluation of the key unmet needs across chronic pain, highlighting insights generated from data sourced from [A] patient blogs, [B] recent scientific publications, [C] social media posts and [D] the views of key opinion leaders expressed on various online platforms.
- Lifecycle Management Strategies for Marketed Products: A detailed discussion on the lifecycle management strategies that describes how various companies are using different methods to prolong patent age and, thereby, expand marketing exclusivity in order to exploit the revenue generation potential of their proprietary products.
- Drug Profiles: In-depth profiles of drugs that are in phase III of clinical development, focusing on [A] information on developer companies, [B] type of molecule, [C] mechanism of action, [D] current status of development, [E] route of administration, [F] information on clinical trials and [G] key developments (if available).
- Chronic Pain Management Devices Market Landscape: A comprehensive evaluation of various devices that are being developed for chronic pain management, considering various parameters, such as [A] information on developer(s), [B] mechanism of action, [C] site of application on the body, [D] modality of the device, [E] treatment requirements and [F] type of device.
- Device Competitiveness Analysis and Profiles: A comprehensive device competitive analysis highlighting the most important products by examining factors, such as [A] modality of device, [B] treatment requirement, [C] type of device and [D] supplier power. Furthermore, in-depth profiles of devices that emerged as relatively superior, focusing on [A] details on the developer, [B] approval year, [C] mechanism of action, [D] key features and [E] key developments.
- Partnerships and Collaborations: An insightful analysis of the deals inked by stakeholders in the chronic pain treatment market, based on several parameters, such as [A] year of partnership, [B] type of partnership, [C] quarterly trends, [D] most active players (in terms of the number of partnerships signed) and [E] geography.
- Funding and Investments: An insightful analysis of investments made at various stages of product development, based on various relevant parameters, such as [A] types of funding, [B] amount invested, [C] most active players and [D] most active investors.
KEY QUESTIONS ANSWERED IN THIS REPORT
- How many companies are currently engaged in this market?
- Which are the leading companies in this market?
- What factors are likely to influence the evolution of this market?
- What is the current and future market size?
- What is the CAGR of this market?
- How is the current and future market opportunity likely to be distributed across key market segments?
REASONS TO BUY THIS REPORT
- The report provides a comprehensive market analysis, offering detailed revenue projections of the overall market and its specific sub-segments. This information is valuable to both established market leaders and emerging entrants.
- Stakeholders can leverage the report to gain a deeper understanding of the competitive dynamics within the market. By analyzing the competitive landscape, businesses can make informed decisions to optimize their market positioning and develop effective go-to-market strategies.
- The report offers stakeholders a comprehensive overview of the market, including key drivers, barriers, opportunities, and challenges. This information empowers stakeholders to stay abreast of market trends and make data-driven decisions to capitalize on growth prospects.
ADDITIONAL BENEFITS
- Complimentary PPT Insights Packs
- Complimentary Excel Data Packs for all Analytical Modules in the Report
- 15% Free Content Customization
- Detailed Report Walkthrough Session with Research Team
- Free Updated report if the report is 6-12 months old or older
TABLE OF CONTENTS
1. PREFACE
- 1.1. Scope of the Report
- 1.2. Research Methodology
- 1.2.1. Research Assumptions
- 1.2.2. Project Methodology
- 1.2.3. Forecast Methodology
- 1.2.4. Robust Quality Control
- 1.2.5. Key Considerations
- 1.2.5.1. Demographics
- 1.2.5.2. Economic Factors
- 1.2.5.3. Government Regulations
- 1.2.5.4. Supply Chain
- 1.2.5.5. COVID Impact / Related Factors
- 1.2.5.6. Market Access
- 1.2.5.7. Healthcare Policies
- 1.2.5.8. Industry Consolidation
- 1.3 Key Questions Answered
- 1.4. Chapter Outlines
2. EXECUTIVE SUMMARY
3. INTRODUCTION
- 3.1. Definition of Pain
- 3.2. Classification of Pain
- 3.2.1. Acute Pain
- 3.2.2. Chronic Pain
- 3.2.2.1. Classification of Chronic Pain
- 3.2.2.2. Chronic Pain and Mental Health
- 3.3. Pain Management
- 3.3.1. Therapeutics for Pain Management
- 3.3.2. Devices for Pain Management
- 3.3.3. Other Therapeutic Modalities and Interventions for Pain Management
- 3.4. Future Prospects
4. CHRONIC PAIN MANAGEMENT: UNMET NEED ANALYSIS
- 4.1. Chapter Overview
- 4.2. Unmet Need Analysis
- 4.2.1. Introduction
- 4.2.2. Patient Blogs
- 4.2.2.1. Methodology
- 4.2.2.2. Key Insights
- 4.2.3. Published Literature
- 4.2.3.1. Methodology
- 4.2.3.2. Key Insights
- 4.2.4. Social Media Platforms
- 4.2.4.1. Methodology
- 4.2.4.2. Key Insights
- 4.2.5. Expert Opinions
- 4.2.5.1. Jeffrey Curtis, MD, University of Alabama
- 4.2.5.2. Stephan Silberstein, MD, Jefferson University Hospital
- 4.2.5.3. Jeffrey Gudin, MD, Englewood Hospital and Medical Center
- 4.2.5.4. Kevin Zacharoff, MD, SUNY Stonybrook School of Medicine
- 4.2.5.5. Philip J Mease, MD, University of Washington School of Medicine
- 4.2.5.6. John D Reveille, MD, McGovern Medical School
- 4.2.5.7. Christopher R McCurdy, PhD, University of Florida
- 4.2.6. Concluding Remarks: Key Unmet Needs in Chronic Pain Management
5. PIPELINE REVIEW: MARKETED AND DEVELOPMENT DRUGS
- 5.1. Chapter Overview
- 5.2. Non-Opioid Drugs for Chronic Pain Management: Marketed and Development Pipeline
- 5.3. Non-Opioid Drugs for Chronic Pain Management: Pipeline Analysis
- 5.3.1. Analysis by Phase of Development
- 5.3.2. Analysis by Type of Molecule
- 5.3.3. Analysis by Mechanism of Action
- 5.3.4. Analysis by Route of Administration
- 5.3.5. Analysis by Target Therapeutic Indication(s)
- 5.3.6. Analysis by Size of Employee Base of Developer
- 5.3.7. Pipeline Analysis: Leading Players
- 5.3.8. Developer Logo Landscape: Distribution by Size and Location
- 5.3.9. Mirror Analysis: Distribution by Type of Indication, Number of Molecules and Manufacturer
- 5.3.10. Heptagon Representation: Distribution by Target Disease Indication and Phase of Development
- 5.3.11. Funnel Analysis: Distribution by Target Disease Indications, Route of Administration and Phase of Development
6. LIFECYCLE MANAGEMENT STRATEGIES FOR MARKETED PRODUCTS
- 6.1. Introduction
- 6.2. Product Profile: Duexis(R) (Horizon Pharma)
- 6.2.1. Overview
- 6.2.2. Mechanism of Action
- 6.2.3. Life Cycle Management Strategies
- 6.2.3.1. Strategic Pricing
- 6.2.3.2. Geographical Expansion
- 6.2.3.3. Indication Expansion
- 6.2.3.4. Extension of Patent Exclusivity
- 6.2.3.5. Authorized Generics
- 6.2.3.6. Awareness Campaigns
- 6.2.4. Partnerships and Collaborations
- 6.2.4.1. Mallinckrodt
- 6.2.4.2. Gru nenthal
- 6.3. Product Profile: Gralise(R) (Depomed)
- 6.3.1. Overview
- 6.3.2. Mechanism of Action
- 6.3.3. Life Cycle Management Strategies
- 6.3.3.1. New Dose Strength
- 6.3.4. Legal Defense
- 6.3.4.1. Authorized Generics
- 6.3.5. Partnerships and Collaborations
- 6.3.5.1. Actavis
- 6.3.5.2. Abbott
- 6.4. Product Profile: Horizant(R) (Arbor Pharmaceuticals)
- 6.4.1. Overview
- 6.4.2. Mechanism of Action
- 6.4.3. Life Cycle Management Strategies
- 6.4.3.1. Extension of Patent Exclusivity
- 6.4.3.2. Indication Expansion
- 6.4.4. New Dose Strength
- 6.4.5. Partnerships and Collaborations
- 6.4.5.1. GlaxoSmithKline
- 6.4.5.2. Arbor Pharmaceutical
- 6.5. Product Profile: Vimovo(R) (AstraZeneca and Pozen)
- 6.5.1. Overview
- 6.5.2. Mechanism of Action
- 6.5.3. Life Cycle Management Strategies
- 6.5.3.1. Pricing
- 6.5.3.2. Geographical Expansion
- 6.5.4. Legal Defense
- 6.5.5. Partnerships and Collaborations
- 6.5.5.1. AstraZeneca
- 6.5.5.2. Horizon Pharma
7. DRUG PROFILES: LATE-STAGE MOLECULES
- 7.1. Chapter Overview
- 7.2. Drug Profile: Aimovig(TM) / Erenumab
- 7.3. Drug Profile: Analgecine
- 7.4. Drug Profile: Atogepant / AGN 241689 / MK 8031
- 7.5. Drug Profile: Civamide / Civanex / Zucapsaicin
- 7.6. Drug Profile: CNTX-4975
- 7.7. Drug Profile: Eptinezumab / ALD403
- 7.8. Drug Profile: Fasinumab
- 7.9. Drug Profile: Fremanezumab
- 7.10. Drug Profile: Galcanezumab / LY2951742
- 7.11. Drug Profile: Lasmiditan / COL-144
- 7.12. Drug Profile: Mirogabalin / DS-5565
- 7.13. Drug Profile: MPC-06-ID
- 7.14. Drug Profile: Neridronate
- 7.15. Drug Profile: NTM-001
- 7.16. Drug Profile: NTM-002
- 7.17. Drug Profile: Perampanel (E2007)
- 7.18. Drug Profile: POSIMIR (SABER-Bupivacaine)
- 7.19. Drug Profile: Ralfinamide
- 7.20. Drug Profile: SP-102
- 7.21. Drug Profile: T-121
- 7.22. Drug Profile: Tanezumab
- 7.23. Drug Profile: Tetrodotoxin / TTX
- 7.24. Drug Profile: Ubrogepant / MK-1602
- 7.25. Drug Profile: YHD1119 / PREGABALIN
8. CHRONIC PAIN MANAGEMENT DEVICES: MARKET LANDSCAPE
- 8.1. Chapter Overview
- 8.2. Devices for Pain Management: Database
- 8.3. Devices for Pain Management: Database Analysis
- 8.3.1. Analysis by Type of Devices
- 8.3.2. Analysis by Mechanism of Action
- 8.3.3. Analysis by Modality of Device
- 8.3.4. Analysis by Site of Application on Body
- 8.3.5. Analysis by Convenience of Use
- 8.3.6. Analysis by Location of Developer(s)
- 8.3.7. Analysis by Company Size
9. DEVICE COMPETITIVENESS ANALYSIS AND PROFILES
- 9.1. Chapter Overview
- 9.2. Methodology
- 9.3. Implants
- 9.3.1. Assumptions, Limitations and Key Evaluable Parameters
- 9.3.2. Device Competitive Analysis for Implants: Results
- 9.3.3. Device Profiles
- 9.3.3.1. Freedom SCS System (Stimwave)
- 9.3.3.2. VIVENDI(TM) (BlueWind Medical)
- 9.4. Wearables
- 9.4.1. Assumptions, Limitations and Parameters Evaluated
- 9.4.2. Device Competitive Analysis for Wearables: Results
- 9.4.3. Device Profiles
- 9.4.3.1. Avail Wireless (Omron Healthcare)
- 9.4.3.2. Cefaly (Cefaly Technologies)
- 9.4.3.3. Electro-Mesh Garments (Prizm Medical)
- 9.4.3.4. Micro-Z (Prizm Medical)
- 9.4.3.5. PainPod MI (PainPod)
- 9.4.3.6. PainPod XPV (PainPod)
- 9.4.3.7. Quell Relief (Neurometrix)
- 9.4.3.8. SENSUS(R) Pain Management System (Neurometrix)
- 9.4.3.9. Smart Relief Back (Chattem)
- 9.5. Other Devices
- 9.5.1. Assumptions, Limitations and Parameters Evaluated
- 9.5.2. Devices Competitive Analysis for Other Devices: Results
- 9.5.3. Device Profiles
- 9.5.3.1. Silk'n Relief (Silk'n Therapy)
- 9.5.3.2. The Wellness Pro(TM) Plus (ElectroMedical Technologies)
10. PARTNERSHIPS AND COLLABORATIONS
- 10.1. Chapter Overview
- 10.2. Partnership Models
- 10.3. Non-Opioid Drugs and Devices for Chronic Pain Management: Recent Partnerships and Collaborations
- 10.3.1. Analysis by Year of Agreement
- 10.3.2. Analysis by Quarterly Trends
- 10.3.3. Analysis by Type of Partnership
- 10.3.4. Analysis by Most Active Players
- 10.3.5. Analysis by Geographical Activity
11. FUNDING AND INVESTMENT ANALYSIS
- 11.1. Chapter Overview
- 11.2. Types of Funding
- 11.3. Non-Opioid Drugs for Chronic Pain Management: Funding and Investment Analysis
- 11.3.1. Analysis by Cumulative Number of Funding Instances
- 11.3.2. Analysis by Cumulative Amount Invested
- 11.3.3. Analysis by Type of Funding
- 11.3.4. Analysis by Most Active Players
- 11.3.5. Analysis by Most Active Investors
- 11.4. Concluding Remarks
12. MARKET FORECAST AND OPPORTUNITY ANALYSIS
- 12.1. Chapter Overview
- 12.2. Key Assumptions
- 12.3. Forecast Methodology
- 12.4. Overall Non-Opioids Drugs for Chronic Pain Management Market, Since 2018
- 12.4.1. Non-Opioid Drugs Market: Distribution by Therapeutic Area
- 12.4.2. Non-Opioid Drugs Market: Distribution by Molecule Type
- 12.4.3. Non-Opioid Drugs Market: Distribution by Mechanism of Action
- 12.4.4. Non-Opioid Drugs Market: Distribution by Geography
- 12.5. Non-Opioid Drugs Market: Product-Wise Sales Forecasts
- 12.5.1. Qutenza(R) (Accorda Therapeutics)
- 12.5.1.1. Drug Overview and Target Patient Population
- 12.5.1.2. Sales Forecast
- 12.5.2. Vimovo(R) (Horizon Pharma)
- 12.5.2.1. Drug Overview and Target Patient Population
- 12.5.2.2. Sales Forecast
- 12.5.3. Duexis(R) (Horizon Pharma)
- 12.5.3.1. Drug Overview and Target Patient Population
- 12.5.3.2. Sales Forecast
- 12.5.4. Gralise(R) (Depomed)
- 12.5.4.1. Drug Overview and Target Patient Population
- 12.5.4.2. Sales Forecast
- 12.5.5. Horizant(R) (Arbor Pharmaceuticals)
- 12.5.5.1. Drug Overview and Target Patient Population
- 12.5.5.2. Sales Forecast
- 12.5.6. Zilretta(R) (Flexion Therapeutics)
- 12.5.6.1. Drug Overview and Target Patient Population
- 12.5.6.2. Sales Forecast
- 12.5.7. Ztlido(TM) (Sorrento Therapeutics)
- 12.5.7.1. Drug Overview and Target Patient Population
- 12.5.7.2. Sales Forecast
- 12.5.8. Aimovig(TM) (Amgen)
- 12.5.8.1. Drug Overview and Target Patient Population
- 12.5.8.2. Sales Forecast
- 12.5.9. Fremanezumab (Teva Pharmaceuticals)
- 12.5.9.1. Drug Overview and Target Patient Population
- 12.5.9.2. Sales Forecast
- 12.5.10. Galcanezumab (Eli Lilly)
- 12.5.10.1. Drug Overview and Target Patient Population
- 12.5.10.2. Sales Forecast
- 12.5.11. Mirogabalin (DS-5565) (Daiichi Sankyo)
- 12.5.11.1. Drug Overview and Target Patient Population
- 12.5.11.2. Sales Forecast
- 12.5.12. YHD1119 (Yuhan corporation)
- 12.5.12.1. Drug Overview and Target Patient Population
- 12.5.12.2. Sales Forecast
- 12.5.13. GLA5PR (GL PharmTech)
- 12.5.13.1. Drug Overview and Target Patient Population
- 12.5.13.2. Sales Forecast
- 12.5.14. Eptinezumab (Alder Biopharmaceuticals)
- 12.5.14.1. Drug Overview and Target Patient Population
- 12.5.14.2. Sales Forecast
- 12.5.15. ALLOD-2 (Allodynic Therapeutics)
- 12.5.15.1. Drug Overview and Target Patient Population
- 12.5.15.2. Sales Forecast
- 12.5.16. PainBrake(R) (GT Biopharma)
- 12.5.16.1. Drug Overview and Target Patient Population
- 12.5.16.2. Sales Forecast
- 12.5.17. Neridronate (Grunenthal)
- 12.5.17.1. Drug Overview and Target Patient Population
- 12.5.17.2. Sales Forecast
- 12.5.18. Fasinumab (Regeneron Pharmaceuticals)
- 12.5.18.1. Drug Overview and Target Patient Population
- 12.5.18.2. Sales Forecast
- 12.5.19. SP-102 (Semnur Pharmaceuticals)
- 12.5.19.1. Drug Overview and Target Patient Population
- 12.5.19.2. Sales Forecast
- 12.5.20. CNTX-4975 (Centrexion Therapeutics)
- 12.5.20.1. Drug Overview and Target Patient Population
- 12.5.20.2. Sales Forecast
- 12.5.21. MPC-06-ID (Mesoblast)
- 12.5.21.1. Drug Overview and Target Patient Population
- 12.5.21.2. Sales Forecast
- 12.5.22. Tanezumab
- 12.5.22.1. Drug Overview and Target Patient Population
- 12.5.22.2. Sales Forecast
- 12.5.1. Qutenza(R) (Accorda Therapeutics)
- 12.6. Overall Pain Management Devices Market, Since 2018
- 12.6.1. Pain Management Devices Market: Distribution by Geography
- 12.6.2. Pain Management Devices Market: Distribution by Type of Device
- 12.6.3. Pain Management Devices Market: Distribution by Mechanism of Action
13. CONCLUSION
- 13.1. The Opioid Crisis is Responsible for a Number of Fatalities Due to the Abuse of Controlled Substances; Drug Developers are Actively Attempting to Develop Alternative Pain Management Solutions
- 13.2. The Non-Opioid Therapeutics Market is Characterized by a Robust Pipeline of Candidate Drugs Being Developed for a Variety of Chronic Clinical Conditions
- 13.3. A Variety of Innovative Devices are also Available for the Management of Various Clinical Conditions Characterized by Chronic Pain
- 13.4. Increasing Partnership Activity and Financial Support from Various Investors are Indicative of Lucrative Future Potential
- 13.5. Given the Existing Unmet Needs, the Market is Anticipated to Grow at a Steady Pace in the Foreseen Future
14. EXECUTIVE INSIGHTS
- 14.1. Chapter Overview
- 14.2. Chief Executive Officer, Company A
- 14.3. Chief Advocacy Officer, Company B
- 14.4. Chief Executive Officer, Company C
- 14.5. Director of Clinical Affairs and New Markets, Company D
15. APPENDIX I
16. APPENDIX II
List of Tables
- Table 3.1 A Comparison of Chronic and Acute Pain
- Table 3.2 Pain Management: WHO Pain Ladder
- Table 3.3 A Comparison of Opioid and Non-Opioid Drugs
- Table 3.4 Interventional Strategies for Pain Management
- Table 5.1 Non-Opioid Drugs for Chronic Pain Management: Marketed and Development Pipeline
- Table 7.1 Non-Opioid Drugs for Chronic Pain Management: Late-Stage Molecules
- Table 7.2 Drug Profile: Aimovig(TM) / Erenumab
- Table 7.3 Drug Profile: Analgecine
- Table 7.4 Drug Profile: Atogepant / AGN 241689 / MK 8031
- Table 7.5 Drug Profile: Civanex / Civamide / Zucapsaicin
- Table 7.6 Drug Profile: CNTX-4975
- Table 7.7 Drug Profile: Eptinezumab / ALD403
- Table 7.8 Drug Profile: Fasinumab
- Table 7.9 Drug Profile: Fremanezumab
- Table 7.10 Drug Profile: Galcanezumab / LY2951742
- Table 7.11 Drug Profile: Lasmiditan / COL-144
- Table 7.12 Drug Profile: Mirogabalin / DS-5565
- Table 7.13 Drug Profile: MPC-06-ID
- Table 7.14 Drug Profile: Neridronate
- Table 7.15 Drug Profile: NTM-001
- Table 7.16 Drug Profile: NTM-002
- Table 7.17 Drug Profile: Perampanel (E2007)
- Table 7.18 Drug Profile: POSIMIR (SABER-Bupivacaine)
- Table 7.19 Drug Profile: Ralfinamide
- Table 7.20 Drug Profile: SP-102
- Table 7.21 Drug Profile: T-121
- Table 7.22 Drug Profile: Tanezumab
- Table 7.23 Drug Profile: Tetrodotoxin / TTX
- Table 7.24 Drug Profile: Ubrogepant / MK-1602
- Table 7.25 Drug Profile: YHD1119 / Pregabalin
- Table 8.1 List of Pain Management Devices
- Table 9.1 Device Profiles: Implants
- Table 9.2 Device Profile: BurstDR Stimulator
- Table 9.3 Device Profile: VIVENDI(TM)
- Table 9.4 Device Profiles: Wearables
- Table 9.5 Device Profile: Avail Wireless
- Table 9.6 Device Profile: Cefaly
- Table 9.7 Device Profile: Electro-Mesh Garments
- Table 9.8 Device Profile: Micro-Z
- Table 9.9 Device Profile: PainPod MI
- Table 9.10 Device Profile: PainPod XPV
- Table 9.11 Device Profile: Quell Relief
- Table 9.12 Device Profile: SENSUS(R) Pain Management System
- Table 9.13 Device Profile: Smart Relief Back
- Table 9.14 Device Profiles: Other Devices
- Table 9.15 Device Profile: Silk'n Therapy
- Table 9.16 Device Profile: The Wellness Pro(TM) Plus
- Table 10.1 Non-Opioid Drugs and Devices for Chronic Pain Management: Recent Partnerships and Collaborations
- Table 11.1 Non-Opioid Drugs and Devices for Chronic Pain Management: Funding and Investments
- Table 11.2 Non-Opioid Drugs and Devices for Chronic Pain Management: Summary of Investments
- Table 12.1 Non-Opioid Drugs for Chronic Pain Management Market: Forecasted Candidates
- Table 15.1 Patient Assessment for Pain Intensity Pre- and Post-Operation
- Table 15.2 Medication used for Chronic Pain Management in US, Since 2018
- Table 15.3 Unmet Needs in Chronic Pain Management: Number of Publications, Year-wise Trend
- Table 15.4 Unmet Needs in Chronic Pain Management: Information Available in Published Literature
- Table 15.5 Social media Analysis: Overview of the Keywords
- Table 15.6 Unmet Needs in Chronic Pain Management: Social Media Sentiment Analysis
- Table 15.7 Unmet Needs in Chronic Pain Management: Most Prolific Authors on Social Media
- Table 15.8 A Summary of Key Unmet Needs in Chronic Pain
- Table 15.9 Pipeline Analysis: Distribution by Phase of Development
- Table 15.10 Pipeline Analysis: Distribution by Type of Molecule
- Table 15.11 Pipeline Analysis: Distribution by Mechanism of Action
- Table 15.12 Pipeline Analysis: Distribution by Route of Administration
- Table 15.13 Pipeline Analysis: Distribution by Target Therapeutic Indication(s)
- Table 15.14 Pipeline Analysis: Distribution by Size of Employee Base of Developer
- Table 15.15 Pipeline Analysis: Distribution by Leading Players
- Table 15.16 Mirror Analysis: Distribution by Type of Indications, Number of Molecules and Manufacturer
- Table 15.17 Heptagon Representation: Distribution by Target Disease Indication and Phase of Development
- Table 15.18 Devices for Pain Management: Distribution by Type
- Table 15.19 Devices for Pain Management: Distribution by Mechanism of Action
- Table 15.20 Devices for Pain Management: Distribution by Administration Modality
- Table 15.21 Devices for Pain Management: Distribution by Site of Application on Body
- Table 15.22 Devices for Pain Management: Distribution by Convenience of Use
- Table 15.23 Devices for Pain Management: Distribution by Location of Developer(s)
- Table 15.24 Devices for Pain Management: Distribution by Company Size
- Table 15.25 Device Competitive Analysis for Implants: Dot-Plot Representation
- Table 15.26 Device Competitive Analysis for Wearables: Dot-Plot Representation
- Table 15.27 Device Competitive Analysis for Other Devices: Dot-Plot Representation
- Table 15.28 Non-Opioid Drugs and Devices for Chronic Pain Management: Distribution by Year of Agreement
- Table 15.29 Non-Opioid Drugs and Devices for Chronic Pain Management: Distribution by Quarterly Trends
- Table 15.30 Non-Opioid Drugs and Devices for Chronic Pain Management: Distribution by Type of Partnership
- Table 15.31 Non-Opioid Drugs for Chronic Pain Management: Cumulative Number of Funding Instances, Till 2035
- Table 15.32 Non-Opioid Drugs for Chronic Pain Management: Cumulative Distribution of Amount Invested by Year, Till 2035 (USD Million)
- Table 15.33 Non-Opioid Drugs for Chronic Pain Management: Distribution by Type of Funding, Since 2018
- Table 15.34 Non-Opioid Drugs for Chronic Pain Management: Distribution of Total Amount Invested by Type of Funding, Since 2018 (USD Million)
- Table 15.35 Non-Opioid Drugs for Chronic Pain Management: Most Active Players by Number of Funding Instances
- Table 15.36 Non-Opioid Drugs for Chronic Pain Management: Most Active Investors by Number of Funding Instances
- Table 15.37 Non-Opioid Drugs for Chronic Pain Management: Funding and Investment Summary (USD Million)
- Table 15.38 Non-Opioid Drugs for Chronic Pain Market: Base Scenario, Till 2035 (USD Billion)
- Table 15.39 Non-Opioid Drugs for Chronic Pain Market: Conservative Scenario, Till 2035 (USD Billion)
- Table 15.40 Non-Opioid Drugs for Chronic Pain Management Market: Optimistic Scenario, Till 2035 (USD Billion)
- Table 15.41 Non-Opioid Drugs for Chronic Pain Management Market: Distribution by Therapeutic Area, Till 2035 (USD Billion)
- Table 15.42 Non-Opioid Drugs for Chronic Pain Management Market: Distribution by Mechanism of Action, Till 2035 (USD Billion)
- Table 15.43 Non-Opioid Drugs for Chronic Pain Management Market: Distribution by Geography, Till 2035 (USD Billion)
- Table 15.44 Qutenza(R) Sales Forecast (Till 2035): Base Scenario (USD Million)
- Table 15.45 Qutenza(R) Sales Forecast (Till 2035): Conservative Scenario (USD Million)
- Table 15.46 Qutenza(R) Sales Forecast (Till 2035): Optimistic Scenario (USD Million)
- Table 15.47 Vimovo(R) Sales Forecast (Till 2035): Base Scenario (USD Million)
- Table 15.48 Vimovo(R) Sales Forecast (Till 2035): Conservative Scenario (USD Million)
- Table 15.49 Vimovo(R) Sales Forecast (Till 2035): Optimistic Scenario (USD Million)
- Table 15.50 Duexis(R) Sales Forecast (Till 2035): Base Scenario (USD Million)
- Table 15.51 Duexis(R) Sales Forecast (Till 2035): Conservative Scenario (USD Million)
- Table 15.52 Duexis(R) Sales Forecast (Till 2035): Optimistic Scenario (USD Million)
- Table 15.53 Gralise(R) Sales Forecast (Till 2035): Base Scenario (USD Million)
- Table 15.54 Gralise(R) Sales Forecast (Till 2035): Conservative Scenario (USD Million)
- Table 15.55 Gralise(R) Sales Forecast (Till 2035): Optimistic Scenario (USD Million)
- Table 15.56 Horizant(R) Sales Forecast (Till 2035): Base Scenario (USD Million)
- Table 15.57 Horizant(R) Sales Forecast (Till 2035): Conservative Scenario (USD Million)
- Table 15.58 Horizant(R) Sales Forecast (Till 2035): Optimistic Scenario (USD Million)
- Table 15.59 Zilretta(R) Sales Forecast (Till 2035): Base Scenario (USD Million)
- Table 15.60 Zilretta(R) Sales Forecast (Till 2035): Conservative Scenario (USD Million)
- Table 15.61 Zilretta(R) Sales Forecast (Till 2035): Optimistic Scenario (USD Million)
- Table 15.62 Ztlido(TM) Sales Forecast (Till 2035): Base Scenario (USD Million)
- Table 15.63 Ztlido(TM) Sales Forecast (Till 2035): Conservative Scenario (USD Million)
- Table 15.64 Ztlido(TM) Sales Forecast (Till 2035): Optimistic Scenario (USD Million)
- Table 15.65 Aimovig(TM) Sales Forecast (Till 2035): Base Scenario (USD Million)
- Table 15.66 Aimovig(TM) Sales Forecast (Till 2035): Conservative Scenario (USD Million)
- Table 15.67 Aimovig(TM) Sales Forecast (Till 2035): Optimistic Scenario (USD Million)
- Table 15.68 Fremanezumab Sales Forecast (Till 2035): Base Scenario (USD Million)
- Table 15.69 Fremanezumab Sales Forecast (Till 2035): Conservative Scenario (USD Million)
- Table 15.70 Fremanezumab Sales Forecast (Till 2035): Optimistic Scenario (USD Million)
- Table 15.71 Galcanezumab Sales Forecast (Till 2035): Base Scenario (USD Million)
- Table 15.72 Galcanezumab Sales Forecast (Till 2035): Conservative Scenario (USD Million)
- Table 15.73 Galcanezumab Sales Forecast (Till 2035): Optimistic Scenario (USD Million)
- Table 15.74 Mirogabalin (DS-5565) Sales Forecast (Till 2035): Base Scenario (USD Million)
- Table 15.75 Mirogabalin (DS-5565) Sales Forecast (Till 2035): Conservative Scenario (USD Million)
- Table 15.76 Mirogabalin (DS-5565) Sales Forecast (Till 2035): Optimistic Scenario (USD Million)
- Table 15.77 YHD1119 Sales Forecast (Till 2035): Base Scenario (USD Million)
- Table 15.78 YHD1119 Sales Forecast (Till 2035): Conservative Scenario (USD Million)
- Table 15.70 YHD1119 Sales Forecast (Till 2035): Optimistic Scenario (USD Million)
- Table 15.80 GLA5PR Sales Forecast (Till 2035): Base Scenario (USD Million)
- Table 15.81 GLA5PR Sales Forecast (Till 2035): Conservative Scenario (USD Million)
- Table 15.82 GLA5PR Sales Forecast (Till 2035): Optimistic Scenario (USD Million)
- Table 15.83 Eptinezumab Sales Forecast (Till 2035): Base Scenario (USD Million)
- Table 15.84 Eptinezumab Sales Forecast (Till 2035): Conservative Scenario (USD Million)
- Table 15.85 Eptinezumab Sales Forecast (Till 2035): Optimistic Scenario (USD Million)
- Table 15.86 ALLOD-2 Sales Forecast (Till 2035): Base Scenario (USD Million)
- Table 15.87 ALLOD-2 Sales Forecast (Till 2035): Conservative Scenario (USD Million)
- Table 15.88 ALLOD-2 Sales Forecast (Till 2035): Optimistic Scenario (USD Million)
- Table 15.89 PainBrake(R) Sales Forecast (Till 2035): Base Scenario (USD Million)
- Table 15.90 PainBrake(R) Sales Forecast (Till 2035): Conservative Scenario (USD Million)
- Table 15.91 PainBrake(R) Sales Forecast (Till 2035): Optimistic Scenario (USD Million)
- Table 15.92 Neridronate Sales Forecast (Till 2035): Base Scenario (USD Million)
- Table 15.93 Neridronate Sales Forecast (Till 2035): Conservative Scenario (USD Million)
- Table 15.94 Neridronate Sales Forecast (Till 2035): Optimistic Scenario (USD Million)
- Table 15.95 Fasinumab Sales Forecast (Till 2035): Base Scenario (USD Million)
- Table 15.96 Fasinumab Sales Forecast (Till 2035): Conservative Scenario (USD Million)
- Table 15.97 Fasinumab Sales Forecast (Till 2035): Optimistic Scenario (USD Million)
- Table 15.98 SP-102 Sales Forecast (Till 2035): Base Scenario (USD Million)
- Table 15.99 SP-102 Sales Forecast (Till 2035): Conservative Scenario (USD Million)
- Table 15.100 SP-102 Sales Forecast (Till 2035): Optimistic Scenario (USD Million)
- Table 15.101 CNTX-4975 Sales Forecast (Till 2035): Base Scenario (USD Million)
- Table 15.102 CNTX-4975 Sales Forecast (Till 2035): Conservative Scenario (USD Million)
- Table 15.103 CNTX-4975 Sales Forecast (Till 2035): Optimistic Scenario (USD Million)
- Table 15.104 MPC-06-ID Sales Forecast (Till 2035): Base Scenario (USD Million)
- Table 15.105 MPC-06-ID Sales Forecast (Till 2035): Conservative Scenario (USD Million)
- Table 15.106 MPC-06-ID Sales Forecast (Till 2035): Optimistic Scenario (USD Million)
- Table 15.107 Tanezumab Sales Forecast (Till 2035): Base Scenario (USD Million)
- Table 15.108 Tanezumab Sales Forecast (Till 2035): Conservative Scenario (USD Million)
- Table 15.109 Tanezumab Sales Forecast (Till 2035): Optimistic Scenario (USD Million)
- Table 15.110 Chronic Pain Management Devices Market: Base Scenario, Till 2035 (USD Billion)
- Table 15.111 Chronic Pain Management Devices Market: Conservative Scenario, Till 2035 (USD Billion)
- Table 15.112 Chronic Pain Management Device Market: Optimistic Scenario, Till 2035 (USD Billion)
- Table 15.113 Chronic Pain Management Device Market: Distribution by Geography, Till 2035 (USD Billion)
- Table 15.114 Chronic Pain Management Device Market: Distribution by Type of Device, Till 2035 (USD Billion)
- Table 15.115 Chronic Pain Management Device Market: Distribution by Mechanism of Action, Till 2035 (USD Billion)
- Table 15.116 Non-Opioid Drugs for Chronic Pain Management Market: Summary of Base, Conservative and Optimistic Scenarios (USD Million)
List of Figures
- Figure 3.1 Classification of Pain: Acute and Chronic Pain
- Figure 3.2 Acute and Chronic Pain: Key Biological Pathways
- Figure 3.3 Patient Assessment for Pain Intensity Pre- and Post-Operation
- Figure 3.4 Chronic Pain: Primary Symptoms and Causes
- Figure 3.5 Types of Chronic Pain: ICD Classification
- Figure 3.6 Medications used for Chronic Pain Management in US, Since 2018
- Figure 3.7 Pain Management Therapeutics: Mode of Action
- Figure 3.8 Primary Routes of Administration for Opioid Intake
- Figure 3.9 Types of Pain Management Devices
- Figure 4.1 Unmet Need Analysis: Overview of the Methodology
- Figure 4.2 Unmet Needs in Chronic Pain Management: Word Cloud Analysis of Patient Blogs
- Figure 4.3 Unmet Needs in Chronic Pain Management: Number of Publications, Year-wise Trend
- Figure 4.4 Unmet Needs in Chronic Pain Management: Unmet Needs Highlighted in Published Literature
- Figure 4.5 Social Media Analysis: Overview of the Keywords
- Figure 4.6 Unmet Needs in Chronic Pain Management: Social Media Sentiment Analysis
- Figure 4.7 Unmet Needs in Chronic Pain Management: Social Media Word Cloud on Total Tweets
- Figure 4.8 Unmet Needs in Chronic Pain Management: Trends on Social Media
- Figure 4.9 Unmet Needs in Chronic Pain Management: Most Prolific Authors on Social Media
- Figure 4.10 Unmet Needs in Chronic Pain Management: Social Media Word Clouds on Most Popular Keywords
- Figure 4.11 Summary of Key Unmet Needs in Chronic Pain
- Figure 5.1 Pipeline Analysis: Distribution by Phase of Development
- Figure 5.2 Pipeline Analysis: Distribution by Type of Molecule
- Figure 5.3 Pipeline Analysis: Distribution by Mechanism of Action
- Figure 5.4 Pipeline Analysis: Distribution by Route of Administration
- Figure 5.5 Pipeline Analysis: Distribution by Target Therapeutic Indications(s)
- Figure 5.6 Pipeline Analysis: Distribution by Size of Employee Base of Developer
- Figure 5.7 Pipeline Analysis: Distribution by Leading Players
- Figure 5.8 Developer Logo Landscape: Distribution by Size and Location
- Figure 5.9 Mirror Analysis: Distribution by Target Therapeutics Indication(s), Number of Molecules and Number of Developers
- Figure 5.10 Heptagon Representation: Distribution by Target Disease Indications Indication(s) and Development Stage
- Figure 5.11 Funnel Analysis: Distribution by Target Disease Indication, Route of Administration and Phase of Development
- Figure 6.1 Types of Life Cycle Management Strategies
- Figure 6.2 Duexis(R): Mechanism of Action
- Figure 6.3 Duexis(R): Life Cycle Management Strategies
- Figure 6.4 Gralise(R): Mechanism of Action
- Figure 6.5 Gralise(R): Life Cycle Management Strategies
- Figure 6.6 Horizant(R): Mechanism of Action
- Figure 6.7 Horizant(R): Life Cycle Management Strategies
- Figure 6.8 Vimovo(R): Mechanism of Action
- Figure 6.9 Vimovo(R): Life Cycle Management Strategies
- Figure 8.1 Devices for Pain Management: Distribution by Type
- Figure 8.2 Devices for Pain Management: Distribution by Mechanism of Action
- Figure 8.3 Devices for Pain Management: Distribution by Administration Modality
- Figure 8.4 Devices for Pain Management: Distribution by Site of Application on Body
- Figure 8.5 Devices for Pain Management: Distribution by Convenience of Use
- Figure 8.6 Devices for Pain Management: Distribution by Location of Developer(s)
- Figure 8.7 Devices for Pain Management: Distribution by Company Size
- Figure 9.1 Pain Management Device Competitiveness Analysis: Methodology
- Figure 9.2 Device Competitiveness Analysis for Implants: Dot-Plot Representation
- Figure 9.3 Device Competitiveness Analysis for Wearables: Dot-Plot Representation
- Figure 9.4 Device Competitiveness Analysis for Other Devices: Dot-Plot Representation
- Figure 10.1 Recent Collaborations: Distribution by Year of Agreement
- Figure 10.2 Recent Collaborations: Distribution by Quarterly Trends
- Figure 10.3 Recent Collaborations: Distribution by Type of Partnership
- Figure 10.4 Recent Collaborations: Distribution by Most Active Players
- Figure 10.5 Recent Collaborations: Distribution by Geographical Activity
- Figure 11.1 Non-Opioid Drugs for Chronic Pain Management: Cumulative Number of Funding Instances, Till 2035
- Figure 11.2 Non-Opioid Drugs for Chronic Pain Management: Cumulative Distribution of Amount Invested by Year, Till 2035 (USD Million)
- Figure 11.3 Non-Opioid Drugs for Chronic Pain Management: Distribution by Type of Funding, Till 2035
- Figure 11.4 Non-Opioid for Chronic Pain Management: Distribution of Total Amount Invested by Type of Funding, Till 2035 (USD Million)
- Figure 11.5 Non-Opioid Drugs for Chronic Pain Management: Most Active Players by Number of Funding Instances
- Figure 11.6 Non-Opioid Drugs for Chronic Pain Management: Most Active Investors by Number of Funding Instances
- Figure 11.7 Non-Opioid Drugs for Chronic Pain Management: Funding and Investment Summary
- Figure 12.1 Non-Opioid Drugs for Chronic Pain Management Market: Base Scenario, Till 2035 (USD Billion)
- Figure 12.2 Non-Opioid Drugs for Chronic Pain Management Market: Distribution by Therapeutic Area, Till 2035 (USD Billion)
- Figure 12.3 Non-Opioid Drugs for Chronic Pain Management Market: Distribution by Molecule Type, Till 2035 (USD Billion)
- Figure 12.4 Non-Opioid Drugs for Chronic Pain Management Market: Distribution by Geography, Till 2035 (USD Billion)
- Figure 12.5 Qutenza(R) Sales Forecast, Till 2035: Base Scenario (USD Million)
- Figure 12.6 Vimovo(R) Sales Forecast, Till 2035: Base Scenario (USD Million)
- Figure 12.7 Duexis(R) Sales Forecast, Till 2035: Base Scenario (USD Million)
- Figure 12.8 Gralise(R) Sales Forecast, Till 2035: Base Scenario (USD Million)
- Figure 12.9 Horizant(R) Sales Forecast, Till 2035: Base Scenario (USD Million)
- Figure 12.10 Zilretta(R) Sales Forecast, Till 2035: Base Scenario (USD Million)
- Figure 12.11 Ztlido(TM) Sales Forecast, Till 2035: Base Scenario (USD Million)
- Figure 12.12 Aimovig(TM) Sales Forecast, Till 2035: Base Scenario (USD Million)
- Figure 12.13 Fremanezumab Sales Forecast, Till 2035: Base Scenario (USD Million)
- Figure 12.14 Galcanezumab Sales Forecast, Till 2035: Base Scenario (USD Million)
- Figure 12.15 Mirogabalin Sales Forecast, Till 2035: Base Scenario (USD Million)
- Figure 12.16 YHD1119 Sales Forecast, Till 2035: Base Scenario (USD Million)
- Figure 12.17 GLA5PR Sales Forecast, Till 2035: Base Scenario (USD Million)
- Figure 12.18 Eptinezumab Sales Forecast, Till 2035: Base Scenario (USD Million)
- Figure 12.19 ALLOD-2 Sales Forecast, Till 2035: Base Scenario (USD Million)
- Figure 12.20 PainBrake(R) Sales Forecast, Till 2035: Base Scenario (USD Million)
- Figure 12.21 Neridronate Sales Forecast, Till 2035: Base Scenario (USD Million)
- Figure 12.22 Fasinumab Sales Forecast, Till 2035: Base Scenario (USD Million)
- Figure 12.23 SP-102 Sales Forecast, Till 2035: Base Scenario (USD Million)
- Figure 12.24 CNTX-4975 Sales Forecast, Till 2035: Base Scenario (USD Million)
- Figure 12.25 MPC-06-ID Sales Forecast, Till 2035: Base Scenario (USD Million)
- Figure 12.26 Tanezumab Sales Forecast, Till 2035: Base Scenario (USD Million)
- Figure 12.27 Chronic Pain Management Devices Market: Base Scenario, Till 2035 (USD Billion)
- Figure 12.28 Chronic Pain Management Devices Market: Distribution by Geography, Till 2035 (USD Billion)
- Figure 12.29 Chronic Pain Management Devices Market: Distribution by Type of Device, Till 2035 (USD Billion)
- Figure 12.30 Chronic Pain Management Devices Market: Distribution by Mechanism of Action, Till 2035 (USD Billion)
- Figure 13.1 Non-Opioid Drugs for Chronic Pain Management Market: Summary of Base, Conservative and Optimistic Scenarios, Till 2035
