


 |
市场调查报告书
商品编码
1771312
药物发现平台市场:产业趋势及全球预测 - 依显示库技术类型、分子类型和主要地区Drug Discovery Platforms Market: Industry Trends and Global Forecasts - Distribution by Type of Display Library Technology, Type of Molecule and Key Geographical Regions |
||||||
全球药物发现平台市场:概览
今年全球药物发现平台市场规模为 1.39亿美元。在预计预测期内,该市场的年复合成长率将达到 13.4%。
市场区隔与机会分析依下列参数细分:
显示库技术类型
- 噬菌体显示
- 酵母显示
- 其他
依分子类型
- 抗体
- 胜肽
- 其他
主要地区
- 北美
- 欧洲
- 亚太地区
全球药物研发平台市场:成长与趋势
药物研发一直是个漫长的过程。事实上,一种药物的商业化上市平均需要10-15年的时间和40-100亿美元的投资。药物研发过程包括标靶选择和验证、标靶化合物生成、先导化合物最佳化、方案表征等多个步骤。在这些步骤中,药物标靶产生(针对已验证的生物标靶的潜在候选药物)是一个极其耗费资源的过程。值得一提的是,针对已验证的标靶产生一个药物标靶平均需要约18个月的时间。此外,药物研发中从药物标靶生成到先导化合物辨识阶段的失败率约为25%。为了解决这些问题,开发人员正将重点从传统方法转向使用新型药物研发平台。
多年来,人们已经建立了许多方法和途径来产生可行的治疗先导化合物。这些方法包括融合瘤技术、B细胞克隆、基因改造动物技术、体外显示方法以及包括哺乳动物、酵母和细菌细胞在内的细胞表面显示技术。在现代医学研究中,显示库已被有效用于开发各种新型疗法,并与传统的药物筛选方法相比具有许多优点。这些优点包括:能够进行大规模高通量筛选,提供鑑定可行先导化合物的多样性,以及降低透过此方法发现的候选药理化合物引发免疫反应的风险。显示技术已逐步推动药物发现过程的重大进步。因此,预计药物发现平台市场在预测期内将实现强劲成长。
全球药物发现平台市场:关键洞察
本报告分析了全球药物发现平台市场的现状,并揭示了潜在的成长机会。报告的主要调查结果包括:
- 全球不同地区的多家公司声称拥有专有的显示库技术,并提供合作服务,用于发现各种类型的药理分子。
- 噬菌体显示(约70%)被认为是最成功的显示技术之一。利害关係人也在探索其他几种类似的方法,例如基于酵母和哺乳动物细胞的方法。
- 显示技术具有多种优势,包括大规模生产、直接获取序列以及易于筛选不同的克隆。
- 显示库可用于体外筛选针对固定化抗原的抗体,或分离针对低免疫原性标靶的抗体。
- 为了产生候选药物,一些参与者使用多种动物模型进行筛选,这些模型可以在动物免疫系统的控制下进行操控。
- 从合作活动的增加可以看出,人们对该领域的兴趣日益浓厚。事实上,在过去两年内,包括不同类型显示库技术的合作数量达到了最高水准。
- 现有企业和新创公司都已建立了多种合作伙伴关係,其中大多数是许可协议(约占45%),许可协议包括可用于研究和治疗目的的技术。
- 与各种类型的体外显示库及其实现技术相关的科学文献出版数量显着增加,描述其在药物发现和治疗中的应用的方法也显着增加。
- 在过去两年中,关注显示库技术及其在药物发现中的应用的出版物数量(包括研究论文)呈指数级成长。
- 各种论文都致力于体外显示技术以及使用大型库分离大量分子。此外,这些技术主要用于识别有希望用于治疗和诊断应用的先导候选药物。
- 除噬菌体显示外,酵母显示和细胞表面显示等其他显示技术也已被研究用于产生各种治疗分子。
- 与显示库相关的智慧财产权数量也激增,全球多个组织已提交并获得授权的大量与这些技术相关的专利(约30,000项专利申请)。
- 儘管近期提交的专利数量众多(因此剩余专利寿命较长),但只有0.21%的专利具有最高的相对估值。
- 尤其是噬菌体显示方法已广泛应用于许多已核准药物的研发。事实上,市面上最畅销的生物製剂之一Humira®就是使用相同技术研发的。
- 预计该市场的年复合成长率将达到13.4%。预计机会将涵盖各种显示技术、分子类型和主要地理区域。
参与药物发现平台市场的公司范例
- Abzena
- Creative Biolabs
- Distributed Bio(Charles River 子公司)
- ImmunoPrecise Antibodies
- IONTAS
- LakePharma
- Leading Biology
- Sino Biological
- XOMA
本报告调查药物发现平台市场,提供市场概述,以及依显示库技术类型、分子类型和地区的趋势,和参与市场的公司简介。
目录
第1章 前言
第2章 执行摘要
第3章 简介
- 章节概述
- 显示库技术概述
- 显示库的类型
- 显示库的应用
- 未来展望
第4章 市场格局:基于库的显示技术与服务(噬菌体显示)
- 章节概述
- 显示库技术及相关服务(噬菌体显示):市场格局
- 显示库技术及相关服务(噬菌体显示):主要产业参与者
第5章 市场格局:显示库技术及相关服务(其他显示技术)
- 章节概述
- 显示库技术及相关服务(其他显示技术):市场格局
- 显示库技术及相关服务(其他显示技术):主要产业参与者
第6章 公司简介
- 章节概述
- Abzena
- Creative Biolabs
- Distributed Bio(Charles River 子公司)
- ImmunoPrecise Antibodies
- IONTAS
- LakePharma
- Leading Biology
- Sino Biological
- XOMA
第7章 案例研究:利用噬菌体发现生物製剂显示
- 章节概述
- 利用噬菌体显示技术发现的生物製剂
- 利用噬菌体显示技术发现的生物製剂:概述
- HUMIRA®(Adalimumab)
- TREMFYA®(Guselkumab)
- TAXYLO®(Lanadelumab)
- SYNTHA®
- PORTRAZA™(Necitumumab)
- 结论
第8章 合作伙伴关係与合作
- 章节概述
- 合作模式
- 显示库技术及相关服务:近期合作伙伴关係与合作
第9章 出版品分析
第10章 专利分析
- 章节概述
- 研究范围与研究方法
- 显示库技术:专利分析
第11章 市场规模评估与机会分析
- 章节概述
- 关键假设与预测研究方法
- 2035年全球显示库技术市场(热门产品生成服务)
- 2035年显示库技术及相关服务市场:依显示库技术类型
- 2035年显示库技术及相关服务市场:依分子类型
- 2035年显示库技术及相关服务市场:依地区
第12章 结论
第13章 高层洞察
第14章 附录1:表格资料
第15章 附录2:公司与组织名单
GLOBAL DRUG DISCOVERY PLATFORMS MARKET: OVERVIEW
As per Roots Analysis, the global drug discovery platforms market valued at USD 139 million in the current year is anticipated to grow at a CAGR of 13.4% during the forecast period.
The market sizing and opportunity analysis has been segmented across the following parameters:
Type of Display Library Technology
- Phage Display
- Yeast Display
- Others
Type of Molecule
- Antibodies
- Peptides
- Others
Key Geographical Regions
- North America
- Europe
- Asia-Pacific
GLOBAL DRUG DISCOVERY PLATFORMS MARKET: GROWTH AND TRENDS
Drug discovery has always been a time-consuming process. In fact, on average, it takes 10-15 years and investments worth USD 4-10 billion to commercially launch a drug. The process of drug discovery involves various steps including, target selection and validation, hit generation, lead optimization and characterization of protocols. Of these steps, hit (potential drug candidates against validated biological targets) generation is an extremely resource-intensive process. It is worth mentioning that on average approximately 18 months is spent generating hits against a validated target. In addition to this, there is an around 25% chance of failure in the hit generation to lead identification phase of drug discovery. In order to address these concerns, developers are shifting their focus from traditional techniques to the use of novel discovery platforms.
Over the years, numerous methods and approaches have been established for generating viable therapeutic leads. These include hybridoma technology, B-cell cloning, transgenic animal-based techniques, in vitro display methods and cell surface display techniques involving mammalian, yeast, and bacterial cells. In modern medical research, display libraries have been effectively utilized to generate a range of novel therapeutics and present several advantages over traditional drug screening methods. These benefits include enabling large-scale, high-throughput screening, introducing greater diversity in identifying viable leads, and reducing the risk of immune responses to pharmacological candidates discovered through this approach. Gradually, display technologies have driven significant advancements in the drug discovery process. As a result, we anticipate that the market for drug discovery platforms will experience robust growth over the forecast period.
GLOBAL DRUG DISCOVERY PLATFORMS MARKET: KEY INSIGHTS
The report delves into the current state of global drug discovery platforms market and identifies potential growth opportunities within industry. Some key findings from the report include:
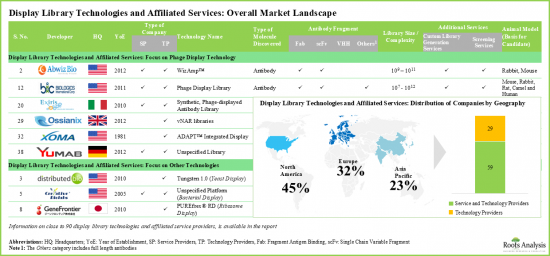
- Several companies, based in different regions of the world, claim to have proprietary display library technologies and offer affiliated services for the discovery of various types of pharmacological molecules.
- Phage display (~70%) is considered as one of the most successful display technologies; stakeholders are also investigating several other similar approaches, such as those based on yeast and mammalian cells.
- Display technologies offer several advantages, including large scale production, direct access to sequence and the ease of screening a large diversity of clones.
- Display libraries can be used for in vitro selection of antibodies on immobilized antigens and isolation of antibodies against poorly immunogenic targets.
- Some players use multiple animal models for selection that can be manipulated under the control of the animal's immune system to generate drug candidates.
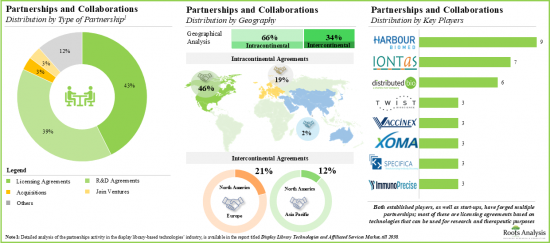
- The growing interest in this field is evident from the rise in partnership activity; in fact, the maximum number of collaborations involving various types of display library technologies were inked in the past two years.
- Both established players, as well as start-ups, have forged multiple partnerships; most of these are licensing agreements (~45%) for the technologies that can be used in research and therapeutic purposes.
- There has been a notable increase in published scientific literature related to the different types of in vitro display libraries and enabling technologies, and approaches describing their use in the discovery of drugs / therapies.
- In the past two years, there has been an exponential increase in the number of publications, including research articles focused on display library technologies and their applications in drug discovery.
- Various articles focus on in-vitro-display technologies and the use of large libraries for the isolation of vast range of molecules. Further, these technologies are primarily aimed at identifying promising lead candidates for use in therapeutic or diagnostic applications.
- Apart from phage display, other display technologies, such as yeast display and cell surface display are also being investigated for the generation of various therapeutic molecules.
- The intellectual property associated with display libraries has also witnessed a surge, as numerous patents (~30,000 patent applications) related to these technologies have been filed / granted to several organizations across the globe.
- Despite the large number of patents that have been filed recently (and hence having a long remaining patent life), only 0.21% of the total patents have the highest relative valuation.
- Specifically, the phage display approach has been widely used for the discovery of a number of approved drugs; in fact, HUMIRA(R), one of the best-selling biologics in the market, was discovered using the same technology.
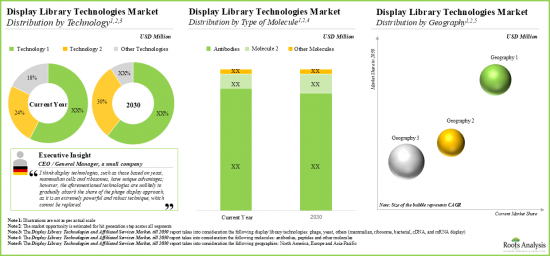
- The market is projected to grow at an annualized rate of ~13.4%; the forecasted opportunity is likely to be distributed across various display technologies, types of molecules, and key geographical regions.
Example Players in the Drug Discovery Platforms Market
- Abzena
- Creative Biolabs
- Distributed Bio (Subsidiary of Charles River)
- ImmunoPrecise Antibodies
- IONTAS
- LakePharma
- Leading Biology
- Sino Biological
- XOMA
PRIMARY RESEARCH OVERVIEW
The opinions and insights presented in this study were influenced by discussions conducted with multiple stakeholders. The research report features detailed transcripts of interviews conducted with the following industry stakeholders:
- Chief Scientific Officer / Founder and Chief Executive Officer / Founder, Company A
- Chief Executive Officer / General Manager, Company B
- President and Chief Executive Officer, Company C
- General Manager, Company D
GLOBAL DRUG DISCOVERY PLATFORMS MARKET
- Market Sizing and Opportunity Analysis: The report features an in-depth analysis of the global drug discovery platforms market, focusing on key market segments, including [A] type of display library technology, [B] type of molecule and [C] key geographical regions.
- Market Landscape: A comprehensive evaluation of the display library technologies and affiliated services market, considering various parameters, such as [A] year of establishment, [B] company size, [C] location of headquarters, [D] type of company, [E] display library expertise, [F] type of molecules, [G] type and format of antibodies generated, [H] library size / complexity and [I] other services offered.
- Company Profiles: In-depth profiles of companies offering display library technologies, focusing on [A] company overview, [B] proprietary technology and [C] recent developments and an informed future outlook.
- Case Study: A detailed discussion of biologics discovered using phage display method along with analysis, based on various parameters, such as [A] first launch year, [B] target gene / antigen, [C] disease indication, [D] target therapeutic area and [E] revenues generated.
- Partnerships and Collaborations: An insightful analysis of the deals inked by stakeholders in this domain, based on several parameters, such as [A] year of partnership, [B] type of partnership, [C] focus area, [D] type of partner, [E] most active players (in terms of the number of partnerships signed) and [F] geographical distribution of partnership activity.
- Publication Analysis: A comprehensive analysis of close to 2,000 peer-reviewed scientific articles related to research on display libraries, based on [A] year of publication, [B] focus area, [C] type of molecule, [D] popular keywords and [E] key journals.
- Patent Analysis: An in-depth analysis of patents filed / granted for display library technologies, based on various relevant parameters, such as [A] publication year, [B] geography, [C] CPC symbols, [D] emerging focus areas, [E] type of applicant, [F] leading industry players and [G] patent valuation analysis.
KEY QUESTIONS ANSWERED IN THIS REPORT
- How many companies are currently engaged in this market?
- Which are the leading companies in this market?
- What factors are likely to influence the evolution of this market?
- What is the current and future market size?
- What is the CAGR of this market?
- How is the current and future market opportunity likely to be distributed across key market segments?
REASONS TO BUY THIS REPORT
- The report provides a comprehensive market analysis, offering detailed revenue projections of the overall market and its specific sub-segments. This information is valuable to both established market leaders and emerging entrants.
- Stakeholders can leverage the report to gain a deeper understanding of the competitive dynamics within the market. By analyzing the competitive landscape, businesses can make informed decisions to optimize their market positioning and develop effective go-to-market strategies.
- The report offers stakeholders a comprehensive overview of the market, including key drivers, barriers, opportunities, and challenges. This information empowers stakeholders to stay abreast of market trends and make data-driven decisions to capitalize on growth prospects.
ADDITIONAL BENEFITS
- Complimentary PPT Insights Packs
- Complimentary Excel Data Packs for all Analytical Modules in the Report
- 15% Free Content Customization
- Detailed Report Walkthrough Session with Research Team
- Free Updated report if the report is 6-12 months old or older
TABLE OF CONTENTS
1. PREFACE
- 1.1. Scope of the Report
- 1.2. Research Methodology
- 1.2.1. Research Assumptions
- 1.2.2. Project Methodology
- 1.2.3. Forecast Methodology
- 1.2.4. Robust Quality Control
- 1.2.5. Key Considerations
- 1.2.5.1. Demographics
- 1.2.5.2. Economic Factors
- 1.2.5.3. Government Regulations
- 1.2.5.4. Supply Chain
- 1.2.5.5. COVID Impact / Related Factors
- 1.2.5.6. Market Access
- 1.2.5.7. Healthcare Policies
- 1.2.5.8. Industry Consolidation
- 1.3 Key Questions Answered
- 1.4. Chapter Outlines
2. EXECUTIVE SUMMARY
3. INTRODUCTION
- 3.1. Chapter Overview
- 3.2. Overview of Display Library Technologies
- 3.3. Types of Display Libraries
- 3.3.1. In Vitro Display Technologies
- 3.3.1.1. Phage Display
- 3.3.1.1.1. Classification of Phage Display Libraries
- 3.3.1.1.2. Applications of Phage Display Libraries
- 3.3.1.2. Ribosomal Display Library
- 3.3.1.3. mRNA Display Library
- 3.3.1.4. cDNA Display Library
- 3.3.1.1. Phage Display
- 3.3.2. Cell Surface Display Technologies
- 3.3.2.1. Bacterial Display Library
- 3.3.2.2. Yeast Display Library
- 3.3.2.3. Mammalian Cell-based Display Libraries
- 3.3.1. In Vitro Display Technologies
- 3.4. Applications of Display Libraries
- 3.5. Future Perspectives
4. MARKET LANDSCAPE: LIBRARY-BASED DISPLAY TECHNOLOGIES AND SERVICES (FOCUS ON PHAGE DISPLAY)
- 4.1. Chapter Overview
- 4.2. Display Library Technologies and Affiliated Services (Focus on Phage Display): Overall Market Landscape
- 4.2.1. Analysis by Type of Molecule Discovered
- 4.2.2. Analysis by Type of Antibodies Generated
- 4.2.3. Analysis by Type of Library
- 4.2.4. Analysis by Library Size / Complexity
- 4.2.5. Analysis by Source Organism
- 4.2.6. Analysis by Types of Services Offered
- 4.3. Display Library Technologies and Affiliated Services (Focus on Phage Display): Key Industry Players
- 4.3.1. Analysis by Year of Establishment
- 4.3.2. Analysis by Company Size
- 4.3.3. Analysis by Type of Company
- 4.3.4. Analysis by Location of Headquarters
5. MARKET LANDSCAPE: DISPLAY LIBRARY TECHNOLOGIES AND AFFILIATED SERVICES (FOCUS ON OTHER DISPLAY TECHNOLOGIES)
- 5.1. Chapter Overview
- 5.2. Display Library Technologies and Affiliated Services (Focus on Other Display Technologies): Overall Market Landscape
- 5.2.1. Analysis by Type of Technology
- 5.2.2. Analysis by Type of Molecule Discovered
- 5.2.3. Analysis by Type of Antibodies Generated
- 5.2.4. Analysis by Type of Library
- 5.2.5. Analysis by Library Size / Complexity
- 5.2.6. Analysis by Source Organism
- 5.2.7. Analysis by Types of Services Offered
- 5.3. Display Library Technologies and Affiliated Services (Focus on Other Display Technologies): Key Industry Players
- 5.3.1. Analysis by Year of Establishment
- 5.3.2. Analysis by Company Size
- 5.3.3. Analysis by Type of Company
- 5.3.4. Analysis by Location of Headquarters
6. COMPANY PROFILES
- 6.1. Chapter Overview
- 6.2. Abzena
- 6.2.1. Company Overview
- 6.2.2. Technology Portfolio
- 6.2.3. Recent Developments and Future Outlook
- 6.3. Creative Biolabs
- 6.3.1. Company overview
- 6.3.2. Technology Portfolio
- 6.3.3. Service Portfolio
- 6.3.4. Recent Developments and Future Outlook
- 6.4. Distributed Bio (Subsidiary of Charles River)
- 6.4.1. Company Overview
- 6.4.2. Technology Portfolio
- 6.4.2.1. Recent Developments and Future Outlook
- 6.5. ImmunoPrecise Antibodies
- 6.5.1. Company Overview
- 6.5.2. Technology Portfolio
- 6.5.3. Service Portfolio
- 6.5.4. Recent Developments and Future Outlook
- 6.6. IONTAS
- 6.6.1. Company Overview
- 6.6.2. Technology Portfolio
- 6.6.3. Service Portfolio
- 6.6.4. Recent Developments and Future Outlook
- 6.7. LakePharma
- 6.7.1. Company Overview
- 6.7.2. Technology Portfolio
- 6.7.3. Service Portfolio
- 6.7.4. Recent Developments and Future Outlook
- 6.8. Leading Biology
- 6.8.1. Company overview
- 6.8.2. Technology Portfolio
- 6.8.3. Service Portfolio
- 6.8.4. Recent Developments and Future Outlook
- 6.9. Sino Biological
- 6.9.1. Company Overview
- 6.9.2. Technology Portfolio
- 6.9.3. Service Portfolio
- 6.9.4. Recent Developments and Future Outlook
- 6.10. XOMA
- 6.10.1. Company Overview
- 6.10.2. Technology Portfolio
- 6.10.3. Recent Developments and Future Outlook
7. CASE STUDY: BIOLOGICS DISCOVERED USING PHAGE DISPLAY METHOD
- 7.1. Chapter Overview
- 7.2. Biologics Discovered Using the Phage Display Method
- 7.2.1. Analysis by Year of Launch
- 7.2.2. Analysis by Target Antigen / Gene
- 7.2.3. Analysis by Target Disease Indication and Therapeutic Area
- 7.2.4. Analysis by Revenues Generated (2020)
- 7.3. Biologics Discovered Using Phage Display Method: Brief Profiles
- 7.3.1. Humira(R) (Adalimumab)
- 7.3.1.1. Drug Overview
- 7.3.1.2. Discovery Process and Method
- 7.3.2. Tremfya(R) (Guselkumab)
- 7.3.2.1. Drug Overview
- 7.3.2.2. Discovery Process and Method
- 7.3.3. Takhzyro(R) (Lanadelumab)
- 7.3.3.1. Drug Overview
- 7.3.3.2. Discovery Process and Method
- 7.3.4. Xyntha(R)
- 7.3.4.1. Drug Overview
- 7.3.4.2. Discovery Process and Method
- 7.3.5. Portrazza(TM) (Necitumumab)
- 7.3.5.1. Drug Overview
- 7.3.5.2. Discovery Process and Method
- 7.3.1. Humira(R) (Adalimumab)
- 7.4. Concluding Remarks
8. PARTNERSHIPS AND COLLABORATIONS
- 8.1. Chapter Overview
- 8.2. Partnership Models
- 8.3. Display Library Technologies and Affiliated Services: Recent Partnerships and Collaborations
- 8.3.1. Analysis by Year of Partnership
- 8.3.2. Analysis by Type of Partnership
- 8.3.3. Analysis by Focus of Partnership (Type of Molecule)
- 8.3.4. Analysis by Focus of Partnership (Target Therapeutic Area)
- 8.3.5. Analysis by Type of Partner
- 8.3.6. Most Active Players: Analysis by Number of Partnerships
- 8.3.7. Analysis by Geography
- 8.3.7.1. Intercontinental and Intracontinental Agreements
9. PUBLICATION ANALYSIS
- 9.1. Chapter Overview
- 9.2. Scope and Methodology
- 9.3. Analysis by Year of Publication
- 9.4. Analysis by Focus Area (Type of Technology)
- 9.5. Analysis by Focus Area (Type of Molecule)
- 9.6. Word Cloud: Analysis of Study Titles
- 9.7. Key Journals: Analysis by Number of Publications
10. PATENT ANALYSIS
- 10.1. Chapter Overview
- 10.2. Scope and Methodology
- 10.3. Display Library Technologies: Patent Analysis
- 10.3.1. Analysis by Publication Year
- 10.3.2. Analysis by Geography
- 10.3.3. Analysis by CPC Symbols
- 10.3.4. Emerging Focus Areas (Word Cloud)
- 10.3.5. Analysis by Type of Applicant
- 10.3.6. Leading Players: Analysis by Number of Patents
- 10.3.7. Leading Players: International Patents
- 10.3.8. Display Library Technologies: Patent Valuation Analysis
11. MARKET SIZING AND OPPORTUNITY ANALYSIS
- 11.1. Chapter Overview
- 11.2. Key assumptions and Forecast Methodology
- 11.3. Global Display Library Technologies Market (Focus on Hit Generation Services), Till 2035
- 11.4. Display Library Technologies and Affiliated Services Market, Till 2035: Distribution by Type of Display Library Technology
- 11.5. Display Library Technologies and Affiliated Services Market, Till 2035: Distribution by Type of Molecule
- 11.6. Display Library Technologies and Affiliated Services Market, Till 2035: Distribution by Geography
- 11.6.1. Display Library Technologies and Affiliated Services Market Opportunity in North America Across Key Market Segments, Till 2035
- 11.6.1.1. Display Library Technologies and Affiliated Services Market in North America, Till 2035: Distribution by Type of Technology
- 11.6.1.1.1 Display Library Technologies and Affiliated Services Market in North America, Till 2035: Share of Phage Display Technology
- 11.6.1.1.2. Display Library Technologies and Affiliated Services Market in North America, Till 2035: Share of Yeast Display Technology
- 11.6.1.1.3. Display Library Technologies and Affiliated Services Market in North America, Till 2035: Share of Other Display Technologies
- 11.6.1.2. Display Library Technologies and Affiliated Services Market in North America, Till 2035: Distribution by Type of Molecule
- 11.6.1.2.1. Display Library Technologies and Affiliated Services Market in North America, Till 2035: Share of Antibodies
- 11.6.1.2.2. Display Library Technologies and Affiliated Services Market in North America, Till 2035: Share of Peptides
- 11.6.1.2.3. Display Library Technologies and Affiliated Services Market in North America, Till 2035: Share of Other Molecules
- 11.6.1.1. Display Library Technologies and Affiliated Services Market in North America, Till 2035: Distribution by Type of Technology
- 11.6.2. Display Library Technologies and Affiliated Services Market Opportunity in Europe Across Key Market Segments, Till 2035
- 11.6.2.1. Display Library Technologies and Affiliated Services Market in Europe, Till 2035: Distribution by Type of Technology
- 11.6.2.1.1 Display Library Technologies and Affiliated Services Market in Europe, Till 2035: Share of Phage Display Technology
- 11.6.2.1.2. Display Library Technologies and Affiliated Services Market in Europe, Till 2035: Share of Yeast Display Technology
- 11.6.2.1.3. Display Library Technologies and Affiliated Services Market in Europe, Till 2035: Share of Other Display Technologies
- 11.6.2.2. Display Library Technologies and Affiliated Services Market in Europe, Till 2035: Distribution by Type of Molecule
- 11.6.2.2.1. Display Library Technologies and Affiliated Services Market in Europe, Till 2035: Share of Antibodies
- 11.6.2.2.2. Display Library Technologies and Affiliated Services Market in Europe, Till 2035: Share of Peptides
- 11.6.2.2.3. Display Library Technologies and Affiliated Services Market in Europe, Till 2035: Share of Other Molecules
- 11.6.2.1. Display Library Technologies and Affiliated Services Market in Europe, Till 2035: Distribution by Type of Technology
- 11.6.3. Display Library Technologies and Affiliated Services Market Opportunity in Asia-Pacific Across Key Market Segments, Till 2035
- 11.6.3.1. Display Library Technologies and Affiliated Services Market in Asia-Pacific, Till 2035: Distribution by Type of Technology
- 11.6.3.1.1 Display Library Technologies and Affiliated Services Market in Asia-Pacific, Till 2035: Share of Phage Display Technology
- 11.6.3.1.2. Display Library Technologies and Affiliated Services Market in Asia-Pacific, Till 2035: Share of Yeast Display Technology
- 11.6.3.1.3. Display Library Technologies and Affiliated Services Market in Asia-Pacific, Till 2035: Share of Other Display Technologies
- 11.6.3.2. Display Library Technologies and Affiliated Services Market in Asia-Pacific, Till 2035: Distribution by Type of Molecule
- 11.6.3.2.1. Display Library Technologies and Affiliated Services Market in Asia-Pacific, Till 2035: Share of Antibodies
- 11.6.3.2.2. Display Library Technologies and Affiliated Services Market in Asia-Pacific, Till 2035: Share of Peptides
- 11.6.3.2.3. Display Library Technologies and Affiliated Services Market in Asia-Pacific, Till 2035: Share of Other Molecules
- 11.6.3.1. Display Library Technologies and Affiliated Services Market in Asia-Pacific, Till 2035: Distribution by Type of Technology
- 11.6.1. Display Library Technologies and Affiliated Services Market Opportunity in North America Across Key Market Segments, Till 2035
12. CONCLUDING REMARKS
13. EXECUTIVE INSIGHTS
- 13.1. Chapter Overview
- 13.2. Company A
- 13.2.1. Company Snapshot
- 13.2.2. Interview Transcript: CSO / Founder and CEO / Founder
- 13.3. Company B
- 13.3.1. Company Snapshot
- 13.3.2. Interview Transcript: CEO / General Manager
- 13.4. Company C
- 13.4.1. Company Snapshot
- 13.4.2. Interview Transcript: President and CEO
- 13.5. Company D
- 13.5.1. Company Snapshot
- 13.5.2. Interview Transcript: General Manager
14. APPENDIX 1: TABULATED DATA
15. APPENDIX 2: LIST OF COMPANIES AND ORGANIZATIONS
List of Tables
- Figure 3.1. Popular Display Library Technologies
- Figure 3.2. Structure of a Bacteriophage
- Figure 3.3. Phage Display Technique: Basic Steps
- Figure 3.4. Construction of mRNA Display Technology
- Figure 3.5. Construction of Bacterial Display Library
- Figure 4.1. Phage Display Library Technologies and Affiliated Services: Type of Molecule Discovered
- Figure 4.2. Phage Display Library Technologies and Affiliated Services: Distribution by Type of Antibodies Generated
- Figure 4.3. Phage Display Library Technologies and Affiliated Services: Distribution by Type of Library
- Figure 4.4. Phage Display Library Technologies and Affiliated Services: Distribution by Library Size / Complexity
- Figure 4.5. Phage Display Library Technologies and Affiliated Services: Distribution by Source Organism
- Figure 4.6. Phage Display Library Technologies and Affiliated Services: Distribution by Types of Services Offered
- Figure 4.7. Phage Display Library Technologies and Affiliated Service Providers: Distribution by Year of Establishment
- Figure 4.8. Phage Display Library Technologies and Affiliated Service Providers: Distribution by Company Size
- Figure 4.9. Phage Display Library Technologies and Affiliated Service Providers: Distribution by Type of Company
- Figure 4.10. Phage Display Library Technologies and Affiliated Service Providers: Distribution by Location of Headquarters
- Figure 5.1. Other Display Library Technologies and Affiliated Services: Distribution by Type of Molecule Discovered
- Figure 5.2. Other Display Library Technologies and Affiliated Services: Distribution by Type of Antibodies Generated
- Figure 5.3. Other Display Library Technologies and Affiliated Services: Distribution by Type of Library
- Figure 5.4. Other Display Library Technologies and Affiliated Services: Distribution by Library Size / Complexity
- Figure 5.5. Other Display Library Technologies and Affiliated Services: Distribution by Source Organism
- Figure 5.6. Other Display Library Technologies and Affiliated Services: Distribution by Types of Services Offered
- Figure 5.7. Other Display Library Technologies and Affiliated Service Providers: Distribution by Year of Establishment
- Figure 5.8. Other Display Library Technologies and Affiliated Service Providers: Distribution by Company Size
- Figure 5.9. Other Display Library Technologies and Affiliated Service Providers: Distribution by Type of Company
- Figure 5.10. Other Display Library Technologies and Affiliated Service Providers: Distribution by Location of Headquarters
- Figure 6.1. Creative Biolabs: Service Portfolio
- Figure 6.2. ImmunoPrecise Antibodies: Service Portfolio
- Figure 6.3. IONTAS: Service Portfolio
- Figure 6.4. LakePharma: Service Portfolio
- Figure 6.5. Leading Biology: Service Portfolio
- Figure 6.6. Leading Biology: Premade Phage Display Antibody Libraries
- Figure 6.7. Sino Biological: Service Portfolio
- Figure 7.1. Biologics Discovered Using Phage Display Method: First Launch Timeline
- Figure 7.2. Biologics Discovered Using Phage Display Method: Word Cloud Representation of Target Antigen / Gene
- Figure 7.3. Biologics Discovered Using Phage Display Method: Distribution by Target Disease Indications and Therapeutic Area
- Figure 7.4. Biologics Discovered Using Phage Display Method: Logo Landscape Highlighting Revenues Generated in 2020
- Figure 8.1. Partnerships and Collaborations: Distribution by Year of Partnership
- Figure 8.2. Partnerships and Collaborations: Distribution by Type of Partnership
- Figure 8.3. Partnerships and Collaborations: Distribution by Focus Area (Type of Molecule)
- Figure 8.4. Partnerships and Collaborations: Distribution by Focus Area (Target Therapeutic Area)
- Figure 8.5. Partnerships and Collaborations: Distribution by Type of Partner
- Figure 8.6. Most Active Players: Distribution by Number of Partnerships
- Figure 8.7. Partnerships and Collaborations: Distribution by Geography
- Figure 8.8. Partnerships and Collaborations: Distribution by Intercontinental and Intracontinental Agreements
- Figure 9.1. Publication Analysis: Cumulative Year-wise Trend, Since 2017
- Figure 9.2. Publication Analysis: Distribution by Focus Area
- Figure 9.3. Publication Analysis: Distribution by Type of Molecule
- Figure 9.4. Publication Analysis: Word Cloud of Study Titles
- Figure 9.5. Key Journals: Distribution by Number of Publications
- Figure 10.1. Patent Analysis: Distribution by Type of Patent
- Figure 10.2. Patent Analysis: Cumulative Distribution by Publication Year, Since 2017
- Figure 10.3. Patent Analysis: Distribution by Type of Patent and Publication Year
- Figure 10.4. Patent Analysis: Distribution by Geography
- Figure 10.5. Patent Analysis: Distribution by Jurisdiction
- Figure 10.6. Patent Analysis: Distribution by CPC Symbols
- Figure 10.7. Patent Analysis: Emerging Focus Areas
- Figure 10.8. Patent Analysis: Cumulative Year-wise Distribution by Type of Applicant
- Figure 10.9. Leading Industry Players: Distribution by Number of Patents
- Figure 10.10. Leading Players: Distribution by International Patents
- Figure 10.11. Patent Analysis: Distribution of Patents by Age
- Figure 10.12. Patent Analysis: Distribution of Patents by Geography, Since 2017
- Figure 10.13. Display Library Technologies: Patent Valuation
- Figure 11.1. Global Display Library Technologies and Affiliated Services Market (Focus on Hit Generation Services), Till 2035 (USD Million)
- Figure 11.2. Display Library Technologies and Affiliated Services Market, Till 2035: Distribution by Type of Display Library Technology (USD Million)
- Figure 11.3. Display Library Technologies and Affiliated Services Market, Till 2035: Distribution by Type of Molecule (USD Million)
- Figure 11.4. Display Library Technologies and Affiliated Services Market, Till 2035: Distribution by Geography (USD Million)
- Figure 11.5. Display Library Technologies and Affiliated Services Market in North America, Till 2035 (USD Million)
- Figure 11.6. Display Library Technologies and Affiliated Services Market in North America, Till 2035: Share of Phage Display Technology (USD Million)
- Figure 11.7. Display Library Technologies and Affiliated Services Market in North America, Till 2035: Share of Yeast Display Technology (USD Million)
- Figure 11.8. Display Library Technologies and Affiliated Services Market in North America, Till 2035: Share of Other Display Technologies (USD Million)
- Figure 11.9. Display Library Technologies and Affiliated Services Market in North America, Till 2035: Share of Antibodies (USD Million)
- Figure 11.10. Display Library Technologies and Affiliated Services Market in North America, Till 2035: Share of Peptides (USD Million)
- Figure 11.11. Display Library Technologies and Affiliated Services Market in North America, Till 2035: Share of Other Molecules (USD Million)
- Figure 11.12. Display Library Technologies and Affiliated Services Market in Europe, Till 2035: Share of Phage Display Technology (USD Million)
- Figure 11.13. Display Library Technologies and Affiliated Services Market in Europe, Till 2035: Share of Yeast Display Technology (USD Million)
- Figure 11.14. Display Library Technologies and Affiliated Services Market in Europe, Till 2035: Share of Other Display Technologies (USD Million)
- Figure 11.15. Display Library Technologies and Affiliated Services Market in Europe, Till 2035: Share of Antibodies (USD Million)
- Figure 11.16. Display Library Technologies and Affiliated Services Market in Europe, Till 2035: Share of Peptides (USD Million)
- Figure 11.17. Display Library Technologies and Affiliated Services Market in Europe, Till 2035: Share of Other Molecules (USD Million)
- Figure 11.18. Display Library Technologies and Affiliated Services Market in Asia-Pacific, Till 2035: Share of Phage Display Technology (USD Million)
- Figure 11.19. Display Library Technologies and Affiliated Services Market in Asia-Pacific, Till 2035: Share of Yeast Display Technology (USD Million)
- Figure 11.20. Display Library Technologies and Affiliated Services Market in Asia-Pacific, Till 2035: Share of Other Display Technologies (USD Million)
- Figure 11.21. Display Library Technologies and Affiliated Services Market in Asia-Pacific, Till 2035: Share of Antibodies (USD Million)
- Figure 11.22. Display Library Technologies and Affiliated Services Market in Asia-Pacific, Till 2035: Share of Peptides (USD Million)
- Figure 11.23. Display Library Technologies and Affiliated Services Market in Asia-Pacific, Till 2035: Share of Other Molecules (USD Million)
List of Figures
- Table 4.1. Display Library Technologies and Affiliated Services Market Landscape (Focus on Phage Display): Information on Developers, Type of Molecule Generated and Types of Antibodies Generated
- Table 4.2. Display Library Technologies and Affiliated Services Market Landscape (Focus on Phage Display): Information on Type of Library and Library Size / Complexity
- Table 4.3. Display Library Technologies and Affiliated Services Market Landscape (Focus on Phage Display): Information on Animal Model Use
- Table 4.4. Display Library Technologies and Affiliated Services Market Landscape (Focus on Phage Display): Information on Types of Services Offered
- Table 4.5. Display Library Technologies and Affiliated Services Market Landscape (Focus on Phage Display): Companies Offering Drug Discovery Platform(s)
- Table 4.6. Display Library Technologies and Affiliated Services Market Landscape (Focus on Phage Display): List of Companies
- Table 5.1. Display Library Technologies and Affiliated Services Market Landscape (Focus on Other Display Technologies): Information on Developer, Type of Molecule Generated and Type of Antibodies Generated
- Table 5.2. Display Library Technologies and Affiliated Services Market Landscape (Focus on Other Display Technologies): Information on Type of Library and Library Size / Complexity
- Table 5.3. Display Library Technologies and Affiliated Services Market Landscape (Focus on Other Display Technologies): Information on Animal Model Used
- Table 5.4. Display Library Technologies and Affiliated Services Market Landscape (Focus on Other Display Technologies): Information on Types of Services Offered
- Table 5.5. Display Library Technologies and Affiliated Services Market Landscape (Focus on Other Display Technologies): Companies Offering Drug Discovery Platform(s)
- Table 4.6. Display Library Technologies and Affiliated Services Market Landscape (Focus on Other Display Technologies): List of Companies
- Table 6.1. Display Library Technologies and Affiliated Services: List of Companies Profiled
- Table 6.2. Abzena: Company Snapshot
- Table 6.3. Abzena: Recent Developments and Future Outlook
- Table 6.4. Creative Biolabs: Company Snapshot
- Table 6.5. Creative Biolabs: Recent Developments and Future Outlook
- Table 6.6. Distributed Bio: Company Snapshot
- Table 6.6. Distributed Bio: Recent Developments and Future Outlook
- Table 6.7. ImmunoPrecise Antibodies: Company Snapshot
- Table 6.8. ImmunoPrecise Antibodies: Recent Developments and Future Outlook
- Table 6.9. IONTAS: Company Snapshot
- Table 6.10. IONTAS: Recent Developments and Future Outlook
- Table 6.11. LakePharma: Company Snapshot
- Table 6.12. LakePharma: Recent Developments and Future Outlook
- Table 6.13. Leading Biology: Company Snapshot
- Table 6.14. Sino Biological: Company Snapshot
- Table 6.16. XOMA: Company Snapshot
- Table 6.17. XOMA: Recent Developments and Future Outlook
- Table 7.1. List of Approved Biologics Discovered Using Phage Display Method: Information on Launch Year, Target, Indication and Therapeutic Area
- Table 7.2. List of Clinical Stage Biologics Discovered Using Phage Display Library Method
- Table 8.1. Partnerships and Collaborations: Information on Year and Type, Since 2017
- Table 8.2. Partnerships and Collaborations: Information on Focus Area
- Table 8.3. Partnerships and Collaborations: Information on Geography
- Table 10.1. Display Library Technologies: Prominent CPC Codes
- Table 10.2. Display Library Technologies: Most Popular CPC Symbols
- Table 10.3. Display Library Technologies: List of Top CPC Symbols
- Table 10.4. Patent Valuation Analysis: Categorization based on Weighted Valuation Scores
- Table 10.5. Patent Analysis: List of Relatively High Value Patents
- Table 14.1. Phage Display Library Technologies and Affiliated Services: Type of Molecule Discovered
- Table 14.2. Phage Display Library Technologies and Affiliated Services: Distribution by Type of Antibodies Generated
- Table 14.3. Phage Display Library Technologies and Affiliated Services: Distribution by Type of Library
- Table 14.4. Phage Display Library Technologies and Affiliated Services: Distribution by Library Size / Complexity
- Table 14.5. Phage Display Library Technologies and Affiliated Services: Distribution by Animal Model Used
- Table 14.6. Phage Display Library Technologies and Affiliated Services: Distribution by Types of Services Offered
- Table 14.7. Phage Display Library Technologies and Affiliated Service Providers: Distribution by Year of Establishment
- Table 14.8. Phage Display Library Technologies and Affiliated Service Providers: Distribution by Company Size
- Table 14.9. Phage Display Library Technologies and Affiliated Service Providers: Distribution by Type of Company
- Table 14.10. Phage Display Library Technologies and Affiliated Service Providers: Distribution by Location of Headquarters
- Table 14.11. Other Display Library Technologies and Affiliated Services: Distribution by Type of Molecules Generated
- Table 14.12. Other Display Library Technologies and Affiliated Services: Distribution by Type of Antibodies Generated
- Table 14.14. Other Display Library Technologies and Affiliated Services: Distribution by Type of Library
- Table 14.14. Other Display Library Technologies and Affiliated Services: Distribution by Library Size / Complexity
- Table 14.15. Other Display Library Technologies and Affiliated Services: Distribution by Animal Model Used
- Table 14.16. Other Display Library Technologies and Affiliated Services: Distribution by Types of Services Offered
- Table 14.17. Other Display Library Technologies and Affiliated Service Providers: Distribution by Year of Establishment
- Table 14.18. Other Display Library Technologies and Affiliated Service Providers: Distribution by Company Size
- Table 14.19. Other Display Library Technologies and Affiliated Service Providers: Distribution by Type of Company
- Table 14.20. Other Display Library Technologies and Affiliated Service Providers: Distribution by Location of Headquarters
- Table 14.21. Biologics Discovered Using Phage Display Method: First Launch Year Timeline
- Table 14.22. Biologics Discovered Using Phage Display Method: Distribution by Target Disease Indications and Therapeutic Area
- Table 14.23. Partnerships and Collaborations: Distribution by Year of Partnership
- Table 14.24. Partnerships and Collaborations: Distribution by Type of Partnership
- Table 14.25. Partnerships and Collaborations: Distribution by Focus Area (Type of Molecule)
- Table 14.26. Partnerships and Collaborations: Distribution by Focus Area (Target Therapeutic Area)
- Table 14.27. Partnerships and Collaborations: Distribution by Type of Partner
- Table 14.28. Most Active Players: Distribution by Number of Partnerships
- Table 14.29. Partnerships and Collaborations: Distribution by Geography
- Table 14.30. Partnerships and Collaborations: Distribution by Intercontinental and Intracontinental Agreements
- Table 14.31. Publication Analysis: Cumulative Year-wise Trend, Since 2017
- Table 14.32. Publication Analysis: Distribution by Focus Area
- Table 14.33. Publication Analysis: Distribution by Type of Molecule
- Table 14.34. Key Journals: Distribution by Number of Publications
- Table 14.35. Patent Analysis: Distribution by Type of Patent
- Table 14.36. Patent Analysis: Cumulative Distribution by Publication Year, Since 2017
- Table 14.37. Patent Analysis: Distribution by Type of Patent and Publication Year
- Table 14.38. Patent Analysis: Distribution by Geography
- Table 14.39. Patent Analysis: Distribution by Jurisdiction
- Table 14.40. Patent Analysis: Distribution by CPC Symbols
- Table 14.41. Patent Analysis: Cumulative Year-wise Distribution by Type of Applicant
- Table 14.42. Leading Industry Players: Distribution by Number of Patents
- Table 14.43. Leading Players: Distribution by International Patents
- Table 14.44. Patent Analysis: Distribution of Patents by Age
- Table 14.45. Patent Analysis: Distribution of Patents by Geography, Since 2017
- Table 14.46. Display Library Technologies: Patent Valuation
- Table 14.47. Global Display Library Technologies and Affiliated Services Market (Focus on Hit Generation Services), Till 2035 (USD Million)
- Table 14.48. Display Library Technologies and Affiliated Services Market, Till 2035: Distribution by Type of Display Library Technology (USD Million)
- Table 14.49. Display Library Technologies and Affiliated Services Market, Till 2035: Distribution by Type of Molecule (USD Million)
- Table 14.50. Display Library Technologies and Affiliated Services Market, Till 2035: Distribution by Geography (USD Million)
- Table 14.51. Display Library Technologies and Affiliated Services Market in North America, Till 2035 (USD Million)
- Table 14.52. Display Library Technologies and Affiliated Services Market in North America, Till 2035: Share of Phage Display Technology (USD Million)
- Table 14.53. Display Library Technologies and Affiliated Services Market in North America, Till 2035: Share of Yeast Display Technology (USD Million)
- Table 14.54. Display Library Technologies and Affiliated Services Market in North America, Till 2035: Share of Other Display Technologies (USD Million)
- Table 14.55. Display Library Technologies and Affiliated Services Market in North America, Till 2035: Share of Antibodies (USD Million)
- Table 14.56. Display Library Technologies and Affiliated Services Market in North America, Till 2035: Share of Peptides (USD Million)
- Table 14.57. Display Library Technologies and Affiliated Services Market in North America, Till 2035: Share of Other Molecules (USD Million)
- Table 14.58. Display Library Technologies and Affiliated Services Market in Europe, Till 2035: Share of Phage Display Technology (USD Million)
- Table 14.59. Display Library Technologies and Affiliated Services Market in Europe, Till 2035: Share of Yeast Display Technology (USD Million)
- Table 14.60. Display Library Technologies and Affiliated Services Market in Europe, Till 2035: Share of Other Display Technologies (USD Million)
- Table 14.61. Display Library Technologies and Affiliated Services Market in Europe, Till 2035: Share of Antibodies (USD Million)
- Table 14.62. Display Library Technologies and Affiliated Services Market in Europe, Till 2035: Share of Peptides (USD Million)
- Table 14.63. Display Library Technologies and Affiliated Services Market in Europe, Till 2035: Share of Other Molecules (USD Million)
- Table 14.64. Display Library Technologies and Affiliated Services Market in Asia-Pacific, Till 2035: Share of Phage Display Technology (USD Million)
- Table 14.65. Display Library Technologies and Affiliated Services Market in Asia-Pacific, Till 2035: Share of Yeast Display Technology (USD Million)
- Table 14.66. Display Library Technologies and Affiliated Services Market in Asia-Pacific, Till 2035: Share of Other Display Technologies (USD Million)
- Table 14.67. Display Library Technologies and Affiliated Services Market in Asia-Pacific, Till 2035: Share of Antibodies (USD Million)
- Table 14.68. Display Library Technologies and Affiliated Services Market in Asia-Pacific, Till 2035: Share of Peptides (USD Million)
- Table 14.69. Display Library Technologies and Affiliated Services Market in Asia-Pacific, Till 2035: Share of Other Molecules (USD Million)
 囊泡转运蛋白检测市场:2026-2032年全球市场预测(依技术平台、产品形式、最终用户、应用及转运蛋白类别划分)
 AI驱动的药物发现市场预测至2034年:按组件、治疗领域、技术、应用、最终用户和地区进行全球分析。客户流失预测模型市场预测:至 2034 年-按组件、部署类型、组织规模、最终用户和地区分類的全球分析
 人工智慧在动物医药研发市场分析及预测(至2035年):依类型、产品类型、服务、技术、应用、组件、最终用户、实施类型、开发阶段及解决方案划分人工智慧市场分析及预测(至2035年):预测药物反应建模-按类型、产品类型、服务、技术、组件、应用、最终用户、功能、部署模式和解决方案划分人工智慧疫苗研发市场分析及预测(至2035年):按类型、产品类型、服务、技术、组件、应用、最终用户、研发阶段、部署类型和功能划分人工智慧药物交互作用预警市场分析及预测(至2035年):按类型、产品类型、服务、技术、组件、应用、部署类型、最终用户、功能和解决方案划分医学研究数位平台市场分析及预测(至2035年):按类型、产品类型、服务、技术、组件、应用、最终用户、部署类型和功能划分
 应用发现与依赖关係映射 (ADDM) 解决方案市场 - 全球行业规模、份额、趋势、机会、预测:按类型、应用、地区和竞争对手划分,2021-2031 年β-内酰胺类抗生素酶市场:按酵素类型、产品形式、原生动物、应用和最终用户划分 - 全球预测 2026-2032