


 |
市场调查报告书
商品编码
1787842
可解释人工智慧市场:产业趋势·全球预测 (~2035年):元件类型·展开类型·用途·终端用户·企业类型·各地区Explainable AI Market, Till 2035: Distribution by Type of Component, Type of Deployment, Type of Application, End-User, Type of Enterprise and Geographical Regions: Industry Trends and Global Forecasts |
||||||
可解释人工智慧市场:概览
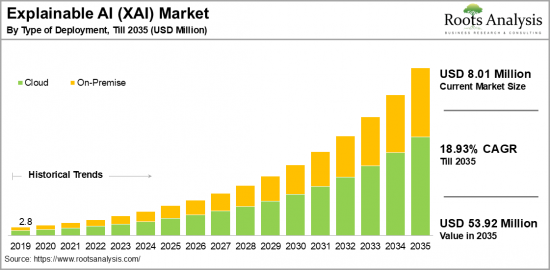
预计到 2035 年,全球可解释人工智慧市场规模将从目前的 801 万美元增长至 5392 万美元,预测期内复合年增长率为 18.93%。
可解释人工智慧市场机会:分类
各元件类型
- 服务
- 解决方案
各部署类型
- 云端
- 内部部署
各用途
- 药物研发·诊断
- 诈欺·异常侦测
- 认同和访问管理
- 预知保全
- 供应链管理
- 其他
各终端用户
- 航太·防卫
- 汽车
- 医疗保健
- IT·通讯
- 公共部门·公共事业
- 零售·电子商务
各类型企业
- 大企业
- 中小企业
各地区
- 北美
- 美国
- 加拿大
- 墨西哥
- 其他的北美各国
- 欧洲
- 奥地利
- 比利时
- 丹麦
- 法国
- 德国
- 爱尔兰
- 义大利
- 荷兰
- 挪威
- 俄罗斯
- 西班牙
- 瑞典
- 瑞士
- 英国
- 其他欧洲各国
- 亚洲
- 中国
- 印度
- 日本
- 新加坡
- 韩国
- 其他亚洲各国
- 南美
- 巴西
- 智利
- 哥伦比亚
- 委内瑞拉
- 其他的南美各国
- 中东·北非
- 埃及
- 伊朗
- 伊拉克
- 以色列
- 科威特
- 沙乌地阿拉伯
- 阿拉伯联合大公国
- 其他的中东·北非各国
- 全球其他地区
- 澳洲
- 纽西兰
- 其他的国家
可解释人工智慧市场:成长与趋势
自2020年以来,人工智慧用户数量增加了一倍多,全球用户已达到约3亿。这标誌着可解释计算与人工智慧透明度融合的重要里程碑。可解释人工智慧 (XAI) 有望透过利用使人工智慧演算法易于理解并让利害关係人理解其决策背后原理的技术来改变各个领域。可解释人工智慧的主要优点包括与模型无关的方法和互动式视觉化,这些优势可以增强使用者理解并加速医学领域的药物研发。
此外,可解释人工智慧透过提供更深入的洞察和有效的解决方案来应对紧迫挑战,改变了金融、医疗保健、能源和製造业等多个行业的商业实践。在互联网的广泛应用和公众意识不断增强的推动下,人工智慧在关键领域的应用正在迅速扩展。
在全球向创新和数位转型转型以实现更高营运效率的过程中,可解释人工智慧正变得越来越重要。自然语言处理和可解释机器学习在充分发挥可解释人工智慧市场潜力方面发挥关键作用,有助于提高能源效率和反应速度。此外,SHAP 和 LIME 等技术增强了复杂人工智慧模型的可解释性,增强了人们对人工智慧系统的信任,并为改善各个领域的决策流程铺平了道路,标誌着现代人工智慧时代的重大发展。因此,在技术进步和投资兴趣不断增长的推动下,预计可解释人工智慧市场将在预测期内实现显着增长。
本报告研究了全球可解释人工智慧市场,并提供了市场概况、背景、市场影响因素分析、市场规模趋势及预测、按细分市场和地区进行的详细分析、竞争格局以及主要公司的概况。
目录
章节I:报告概要
第1章 序文
第2章 调查手法
第3章 市场动态
第4章 宏观经济指标
章节II:定性的洞察
第5章 摘要整理
第6章 简介
第7章 法规Scenario
章节III:市场概要
第8章 主要企业的总括的资料库
第9章 竞争情形
第10章 閒置频段分析
第11章 企业的竞争力分析
第12章 可解释人工智慧市场上Start-Ups生态系统
章节IV:企业简介
第13章 企业简介
- 章概要
- Alteryx
- Amelia
- Arthur.ai
- AWS
- BuildGroup
- DarwinAI
- DataRobot
- Ditto.ai
- Factmata
- IBM
- Kyndi
- Microsoft
- Mphasis
- NVIDIA
章节V:市场趋势
第14章 大趋势分析
第15章 未满足需求的分析
第16章 专利分析
第17章 最近的趋势
章节VI:市场机会分析
第18章 全球可解释人工智慧市场
第19章 可解释人工智慧市场机会:各元件类型
第20章 可解释人工智慧市场机会:各部署类型
第21章 可解释人工智慧市场机会:各用途
第22章 可解释人工智慧市场机会:各终端用户
第23章 可解释人工智慧市场机会:各企业形态
第24章 可解释人工智慧市场机会:北美
第25章 可解释人工智慧市场机会:欧洲
第26章 可解释人工智慧市场机会:亚洲
第27章 可解释人工智慧市场机会:中东·北非
第28章 可解释人工智慧市场机会:南美
第29章 可解释人工智慧市场机会:全球其他地区
第30章 市场集中分析:主要企业的分布
第31章 邻近市场的分析
章节VII:策略工具
第32章 胜利的关键策略
第33章 波特的五力分析
第34章 SWOT分析
第35章 价值链分析
第36章 ROOTS的策略建议
章节VIII:其他的独家洞察
第37章 来自1次调查的洞察
第38章 报告书的结论
章节IX:附录
第39章 表格形式资料
第40章 企业·团体一览
第41章 客制化的机会
第42章 ROOTS订阅服务
第43章 着者详细内容
Explainable AI Market Overview
As per Roots Analysis, the global explainable AI market size is estimated to grow from USD 8.01 million in the current year to USD 53.92 million by 2035, at a CAGR of 18.93% during the forecast period, till 2035.
The opportunity for explainable AI market has been distributed across the following segments:
Type of Component
- Services
- Solutions
Type of Deployment
- Cloud
- On-Premise
Type of Application
- Drug Discovery & Diagnostics
- Fraud and Anomaly Detection
- Identity and Access Management
- Predictive Maintenance
- Supply Chain Management
- Others
End-User
- Aerospace & Defense
- Automotive
- Healthcare
- IT & Telecommunication
- Public Sector & Utilities
- Retail and e-commerce
Type of Enterprise
- Large Enterprises
- Small and Medium Enterprises
Geographical Regions
- North America
- US
- Canada
- Mexico
- Other North American countries
- Europe
- Austria
- Belgium
- Denmark
- France
- Germany
- Ireland
- Italy
- Netherlands
- Norway
- Russia
- Spain
- Sweden
- Switzerland
- UK
- Other European countries
- Asia
- China
- India
- Japan
- Singapore
- South Korea
- Other Asian countries
- Latin America
- Brazil
- Chile
- Colombia
- Venezuela
- Other Latin American countries
- Middle East and North Africa
- Egypt
- Iran
- Iraq
- Israel
- Kuwait
- Saudi Arabia
- UAE
- Other MENA countries
- Rest of the World
- Australia
- New Zealand
- Other countries
EXPLAINABLE AI MARKET: GROWTH AND TRENDS
As of now, the number of AI users has more than doubled since 2020, reaching approximately 300 million worldwide. This marks a significant milestone in the combination of explainable computing and transparency in artificial intelligence. It is important to note that explainable AI is set to transform various sectors by utilizing techniques that allow AI algorithms to be understood, enabling stakeholders to grasp the reasoning behind decisions made. Some of the key benefits of explainable AI include model-agnostic approaches and interactive visualizations that facilitate user comprehension and speed up drug discovery within the healthcare field.
Moreover, explainable AI has changed how businesses operate by offering deeper insights and more effective solutions to urgent challenges across multiple industries such as finance, healthcare, energy, and manufacturing. It should be emphasized that the use of AI in key sectors is increasing rapidly due to the widespread availability of the internet and growing public awareness.
The explainable AI is becoming crucial in the global transition towards innovation and digital transformation aimed at achieving greater work efficiency. Natural language processing and interpretable machine learning have been crucial in realizing the full potential of the explainable AI market, which contributes to improved energy efficiency and faster responses. Additionally, techniques like SHAP and LIME are enhancing the interpretability of intricate AI models, thereby fostering greater trust in AI systems and paving the way for improved decision-making processes across various sectors, indicating a significant modern development. As a result, with ongoing technological progress and increased investment interest, the explainable AI market is expected to experience significant growth during the forecast period.
EXPLAINABLE AI MARKET: KEY SEGMENTS
Market Share by Type of Component
Based on type of component, the global explainable AI market is segmented into software and services. According to our estimates, currently, software segment captures the majority share of the market. This can be attributed to the rising demand for transparency and accountability in AI systems, prompting organizations to adopt XAI solutions.
This helps to clarify the decision-making process, especially in critical areas like healthcare and finance, where compliance with explainable AI regulations is essential.
Market Share by Type of Deployment
Based on type of deployment, the explainable AI market is segmented into cloud and on-premise. According to our estimates, currently, the cloud computing segment captures the majority of the market. This can be attributed to its flexibility and scalability, which makes it appealing for businesses eager to utilize XAI without significant initial infrastructure costs.
However, the on-premise segment is expected to grow at a relatively higher CAGR during the forecast period. This can be attributed to its ability to enable businesses to retain full control over their sensitive data, thereby reducing the risks tied to data breaches that may occur with cloud solutions. Further, on-premise systems provide opportunities for customization and scalability, allowing organizations to adapt their AI frameworks to align with specific operational requirements.
Market Share by Type of Application
Based on type of application, the explainable AI market is segmented into drug discovery & diagnostics, fraud and anomaly detection, identity and access management, predictive maintenance, supply chain management and others. According to our estimates, currently, fraud detection segment captures the majority share of the market. This can be attributed to the growing demand for transparency and trust in automated decision-making, particularly in the realm of explainable AI in cybersecurity, where understanding AI-generated decisions is essential.
However, the drug discovery and diagnostics segment is expected to grow at a relatively higher CAGR during the forecast period. This can be attributed to the rising demand for AI technologies that improve diagnostic precision and facilitate personalized medicine. Such growth is driven by advancements in machine learning that optimize drug development procedures and enhance treatment results.
Market Share by End-User
Based on end-user, the explainable AI market is segmented into aerospace & defense, automotive, healthcare, IT & telecommunication, public sector & utilities and retail and e-commerce. According to our estimates, currently, the IT & telecommunication segment captures the majority share of the market. This growth can be attributed to the extensive data produced from various sources, which is crucial for training AI models and generating valuable insights.
However, the aerospace & defense sector is expected to grow at a relatively higher CAGR during the forecast period, owing to the rising demand for clarity and responsibility in decision-making, especially in critical contexts where AI plays a role in national security and public safety.
Market Share by Type of Enterprise
Based on type of enterprise, the explainable AI market is segmented into large and small and medium enterprise. According to our estimates, currently, the large enterprise segment captures the majority share of the market. Additionally, this segment is expected to grow at a higher CAGR during the forecast period. This can be attributed to their ability to invest in explainable AI technologies, leverage significant resources, enhance economies of scale, and foster business growth.
Market Share by Geographical Regions
Based on geographical regions, the explainable AI market is segmented into North America, Europe, Asia, Latin America, Middle East and North Africa, and the rest of the world. According to our estimates, currently, North America captures the majority share of the market. However, the market in Asia is expected to grow at a higher CAGR during the forecast period. This can be attributed to the significant investments, government initiatives, and an increasing demand for explainable AI in countries like China and India.
Example Players in Explainable AI Market
- Alteryx
- Amelia
- Arthur.ai
- AWS
- BuildGroup
- DarwinAI
- DataRobot
- Ditto.ai
- Factmata
- IBM
- Kyndi
- Microsoft
- Mphasis
- NVIDIA
EXPLAINABLE AI MARKET: RESEARCH COVERAGE
The report on the explainable AI market features insights on various sections, including:
- Market Sizing and Opportunity Analysis: An in-depth analysis of the explainable AI market, focusing on key market segments, including [A] type of component, [B] type of deployment, [C] type of application, [D] end-user, [E] type of enterprise and [F] geographical regions.
- Competitive Landscape: A comprehensive analysis of the companies engaged in the Explainable AI market, based on several relevant parameters, such as [A] year of establishment, [B] company size, [C] location of headquarters and [D] ownership structure.
- Company Profiles: Elaborate profiles of prominent players engaged in the Explainable AI market, providing details on [A] location of headquarters, [B] company size, [C] company mission, [D] company footprint, [E] management team, [F] contact details, [G] financial information, [H] operating business segments, [I] Explainable AI portfolio, [J] moat analysis, [K] recent developments, and an informed future outlook.
- Megatrends: An evaluation of ongoing megatrends in Explainable AI industry.
- Patent Analysis: An insightful analysis of patents filed / granted in the explainable AI domain, based on relevant parameters, including [A] type of patent, [B] patent publication year, [C] patent age and [D] leading players.
- Recent Developments: An overview of the recent developments made in the explainable AI market, along with analysis based on relevant parameters, including [A] year of initiative, [B] type of initiative, [C] geographical distribution and [D] most active players.
- Porter's Five Forces Analysis: An analysis of five competitive forces prevailing in the explainable AI market, including threats of new entrants, bargaining power of buyers, bargaining power of suppliers, threats of substitute products and rivalry among existing competitors.
- SWOT Analysis: An insightful SWOT framework, highlighting the strengths, weaknesses, opportunities and threats in the domain. Additionally, it provides Harvey ball analysis, highlighting the relative impact of each SWOT parameter.
- Value Chain Analysis: A comprehensive analysis of the value chain, providing information on the different phases and stakeholders involved in the Explainable AI market.
KEY QUESTIONS ANSWERED IN THIS REPORT
- How many companies are currently engaged in explainable AI market?
- Which are the leading companies in this market?
- What factors are likely to influence the evolution of this market?
- What is the current and future market size?
- What is the CAGR of this market?
- How is the current and future market opportunity likely to be distributed across key market segments?
REASONS TO BUY THIS REPORT
- The report provides a comprehensive market analysis, offering detailed revenue projections of the overall market and its specific sub-segments. This information is valuable to both established market leaders and emerging entrants.
- Stakeholders can leverage the report to gain a deeper understanding of the competitive dynamics within the market. By analyzing the competitive landscape, businesses can make informed decisions to optimize their market positioning and develop effective go-to-market strategies.
- The report offers stakeholders a comprehensive overview of the market, including key drivers, barriers, opportunities, and challenges. This information empowers stakeholders to stay abreast of market trends and make data-driven decisions to capitalize on growth prospects.
ADDITIONAL BENEFITS
- Complimentary Excel Data Packs for all Analytical Modules in the Report
- 15% Free Content Customization
- Detailed Report Walkthrough Session with Research Team
- Free Updated report if the report is 6-12 months old or older
TABLE OF CONTENTS
SECTION I: REPORT OVERVIEW
1. PREFACE
- 1.1. Introduction
- 1.2. Market Share Insights
- 1.3. Key Market Insights
- 1.4. Report Coverage
- 1.5. Key Questions Answered
- 1.6. Chapter Outlines
2. RESEARCH METHODOLOGY
- 2.1. Chapter Overview
- 2.2. Research Assumptions
- 2.3. Database Building
- 2.3.1. Data Collection
- 2.3.2. Data Validation
- 2.3.3. Data Analysis
- 2.4. Project Methodology
- 2.4.1. Secondary Research
- 2.4.1.1. Annual Reports
- 2.4.1.2. Academic Research Papers
- 2.4.1.3. Company Websites
- 2.4.1.4. Investor Presentations
- 2.4.1.5. Regulatory Filings
- 2.4.1.6. White Papers
- 2.4.1.7. Industry Publications
- 2.4.1.8. Conferences and Seminars
- 2.4.1.9. Government Portals
- 2.4.1.10. Media and Press Releases
- 2.4.1.11. Newsletters
- 2.4.1.12. Industry Databases
- 2.4.1.13. Roots Proprietary Databases
- 2.4.1.14. Paid Databases and Sources
- 2.4.1.15. Social Media Portals
- 2.4.1.16. Other Secondary Sources
- 2.4.2. Primary Research
- 2.4.2.1. Introduction
- 2.4.2.2. Types
- 2.4.2.2.1. Qualitative
- 2.4.2.2.2. Quantitative
- 2.4.2.3. Advantages
- 2.4.2.4. Techniques
- 2.4.2.4.1. Interviews
- 2.4.2.4.2. Surveys
- 2.4.2.4.3. Focus Groups
- 2.4.2.4.4. Observational Research
- 2.4.2.4.5. Social Media Interactions
- 2.4.2.5. Stakeholders
- 2.4.2.5.1. Company Executives (CXOs)
- 2.4.2.5.2. Board of Directors
- 2.4.2.5.3. Company Presidents and Vice Presidents
- 2.4.2.5.4. Key Opinion Leaders
- 2.4.2.5.5. Research and Development Heads
- 2.4.2.5.6. Technical Experts
- 2.4.2.5.7. Subject Matter Experts
- 2.4.2.5.8. Scientists
- 2.4.2.5.9. Doctors and Other Healthcare Providers
- 2.4.2.6. Ethics and Integrity
- 2.4.2.6.1. Research Ethics
- 2.4.2.6.2. Data Integrity
- 2.4.3. Analytical Tools and Databases
- 2.4.1. Secondary Research
3. MARKET DYNAMICS
- 3.1. Forecast Methodology
- 3.1.1. Top-Down Approach
- 3.1.2. Bottom-Up Approach
- 3.1.3. Hybrid Approach
- 3.2. Market Assessment Framework
- 3.2.1. Total Addressable Market (TAM)
- 3.2.2. Serviceable Addressable Market (SAM)
- 3.2.3. Serviceable Obtainable Market (SOM)
- 3.2.4. Currently Acquired Market (CAM)
- 3.3. Forecasting Tools and Techniques
- 3.3.1. Qualitative Forecasting
- 3.3.2. Correlation
- 3.3.3. Regression
- 3.3.4. Time Series Analysis
- 3.3.5. Extrapolation
- 3.3.6. Convergence
- 3.3.7. Forecast Error Analysis
- 3.3.8. Data Visualization
- 3.3.9. Scenario Planning
- 3.3.10. Sensitivity Analysis
- 3.4. Key Considerations
- 3.4.1. Demographics
- 3.4.2. Market Access
- 3.4.3. Reimbursement Scenarios
- 3.4.4. Industry Consolidation
- 3.5. Robust Quality Control
- 3.6. Key Market Segmentations
- 3.7. Limitations
4. MACRO-ECONOMIC INDICATORS
- 4.1. Chapter Overview
- 4.2. Market Dynamics
- 4.2.1. Time Period
- 4.2.1.1. Historical Trends
- 4.2.1.2. Current and Forecasted Estimates
- 4.2.2. Currency Coverage
- 4.2.2.1. Overview of Major Currencies Affecting the Market
- 4.2.2.2. Impact of Currency Fluctuations on the Industry
- 4.2.3. Foreign Exchange Impact
- 4.2.3.1. Evaluation of Foreign Exchange Rates and Their Impact on Market
- 4.2.3.2. Strategies for Mitigating Foreign Exchange Risk
- 4.2.4. Recession
- 4.2.4.1. Historical Analysis of Past Recessions and Lessons Learnt
- 4.2.4.2. Assessment of Current Economic Conditions and Potential Impact on the Market
- 4.2.5. Inflation
- 4.2.5.1. Measurement and Analysis of Inflationary Pressures in the Economy
- 4.2.5.2. Potential Impact of Inflation on the Market Evolution
- 4.2.6. Interest Rates
- 4.2.6.1. Overview of Interest Rates and Their Impact on the Market
- 4.2.6.2. Strategies for Managing Interest Rate Risk
- 4.2.7. Commodity Flow Analysis
- 4.2.7.1. Type of Commodity
- 4.2.7.2. Origins and Destinations
- 4.2.7.3. Values and Weights
- 4.2.7.4. Modes of Transportation
- 4.2.8. Global Trade Dynamics
- 4.2.8.1. Import Scenario
- 4.2.8.2. Export Scenario
- 4.2.9. War Impact Analysis
- 4.2.9.1. Russian-Ukraine War
- 4.2.9.2. Israel-Hamas War
- 4.2.10. COVID Impact / Related Factors
- 4.2.10.1. Global Economic Impact
- 4.2.10.2. Industry-specific Impact
- 4.2.10.3. Government Response and Stimulus Measures
- 4.2.10.4. Future Outlook and Adaptation Strategies
- 4.2.11. Other Indicators
- 4.2.11.1. Fiscal Policy
- 4.2.11.2. Consumer Spending
- 4.2.11.3. Gross Domestic Product (GDP)
- 4.2.11.4. Employment
- 4.2.11.5. Taxes
- 4.2.11.6. R&D Innovation
- 4.2.11.7. Stock Market Performance
- 4.2.11.8. Supply Chain
- 4.2.11.9. Cross-Border Dynamics
- 4.2.1. Time Period
SECTION II: QUALITATIVE INSIGHTS
5. EXECUTIVE SUMMARY
6. INTRODUCTION
- 6.1. Chapter Overview
- 6.2. Overview of Explainable AI Market
- 6.2.1. Type of Component
- 6.2.2. Type of Deployment
- 6.2.3. Type of Application
- 6.2.4. Type of End-User
- 6.2.5. Type of Enterprise
- 6.3. Future Perspective
7. REGULATORY SCENARIO
SECTION III: MARKET OVERVIEW
8. COMPREHENSIVE DATABASE OF LEADING PLAYERS
9. COMPETITIVE LANDSCAPE
- 9.1. Chapter Overview
- 9.2. Explainable AI: Overall Market Landscape
- 9.2.1. Analysis by Year of Establishment
- 9.2.2. Analysis by Company Size
- 9.2.3. Analysis by Location of Headquarters
- 9.2.4. Analysis by Ownership Structure
10. WHITE SPACE ANALYSIS
11. COMPANY COMPETITIVENESS ANALYSIS
12. STARTUP ECOSYSTEM IN THE EXPLAINABLE AI MARKET
- 12.1. Explainable AI Market: Market Landscape of Startups
- 12.1.1. Analysis by Year of Establishment
- 12.1.2. Analysis by Company Size
- 12.1.3. Analysis by Company Size and Year of Establishment
- 12.1.4. Analysis by Location of Headquarters
- 12.1.5. Analysis by Company Size and Location of Headquarters
- 12.1.6. Analysis by Ownership Structure
- 12.2. Key Findings
SECTION IV: COMPANY PROFILES
13. COMPANY PROFILES
- 13.1. Chapter Overview
- 13.2. Alteryx *
- 13.2.1. Company Overview
- 13.2.2. Company Mission
- 13.2.3. Company Footprint
- 13.2.4. Management Team
- 13.2.5. Contact Details
- 13.2.6. Financial Performance
- 13.2.7. Operating Business Segments
- 13.2.8. Service / Product Portfolio (project specific)
- 13.2.9. MOAT Analysis
- 13.2.10. Recent Developments and Future Outlook
- 13.3. Amelia
- 13.4. Arthur.ai
- 13.5. AWS
- 13.6. BuildGroup
- 13.7. DarwinAI
- 13.8. DataRobot
- 13.9. Ditto.ai
- 13.10. Factmata
- 13.11. Google
- 13.12. IBM
- 13.13. Kyndi
- 13.14. Microsoft
- 13.15. Mphasis
- 13.16. NVIDIA
SECTION V: MARKET TRENDS
14. MEGA TRENDS ANALYSIS
15. UNMEET NEED ANALYSIS
16. PATENT ANALYSIS
17. RECENT DEVELOPMENTS
- 17.1. Chapter Overview
- 17.2. Recent Funding
- 17.3. Recent Partnerships
- 17.4. Other Recent Initiatives
SECTION VI: MARKET OPPORTUNITY ANALYSIS
18. GLOBAL EXPLAINABLE AI MARKET
- 18.1. Chapter Overview
- 18.2. Key Assumptions and Methodology
- 18.3. Trends Disruption Impacting Market
- 18.4. Demand Side Trends
- 18.5. Supply Side Trends
- 18.6. Global Explainable AI Market, Historical Trends (Since 2019) and Forecasted Estimates (Till 2035)
- 18.7. Multivariate Scenario Analysis
- 18.7.1. Conservative Scenario
- 18.7.2. Optimistic Scenario
- 18.8. Investment Feasibility Index
- 18.9. Key Market Segmentations
19. EXPLAINABLE AI MARKET OPPORTUNITY BASED ON TYPE OF COMPONENT
- 19.1. Chapter Overview
- 19.2. Key Assumptions and Methodology
- 19.3. Revenue Shift Analysis
- 19.4. Market Movement Analysis
- 19.5. Penetration-Growth (P-G) Matrix
- 19.6. Explainable AI Market for Services: Historical Trends (Since 2019) and Forecasted Estimates (Till 2035)
- 19.7. Explainable AI Market for Software: Historical Trends (Since 2019) and Forecasted Estimates (Till 2035)
- 19.8. Data Triangulation and Validation
- 19.8.1. Secondary Sources
- 19.8.2. Primary Sources
- 19.8.3. Statistical Modeling
20. MARKET OPPORTUNITIES BASED ON TYPE OF DEPLOYMENT
- 20.1. Chapter Overview
- 20.2. Key Assumptions and Methodology
- 20.3. Revenue Shift Analysis
- 20.4. Market Movement Analysis
- 20.5. Penetration-Growth (P-G) Matrix
- 20.6. Explainable AI Market for Cloud: Historical Trends (Since 2019) and Forecasted Estimates (Till 2035)
- 20.7. Explainable AI Market for On-Premise: Historical Trends (Since 2019) and Forecasted Estimates (Till 2035)
- 20.8. Data Triangulation and Validation
- 20.8.1. Secondary Sources
- 20.8.2. Primary Sources
- 20.8.3. Statistical Modeling
21. MARKET OPPORTUNITIES BASED ON TYPE OF APPLICATION
- 21.1. Chapter Overview
- 21.2. Key Assumptions and Methodology
- 21.3. Revenue Shift Analysis
- 21.4. Market Movement Analysis
- 21.5. Penetration-Growth (P-G) Matrix
- 21.6. Explainable AI Market for Drug Discovery & Diagnostics: Historical Trends (Since 2019) and Forecasted Estimates (Till 2035)
- 21.7. Explainable AI Market for Fraud and Anomaly Detection: Historical Trends (Since 2019) and Forecasted Estimates (Till 2035)
- 21.8. Explainable AI Market for Identity and Access Management: Historical Trends (Since 2019) and Forecasted Estimates (Till 2035)
- 21.9. Explainable AI Market for Predictive Maintenance: Historical Trends (Since 2019) and Forecasted Estimates (Till 2035)
- 21.10. Explainable AI Market for Supply Chain Management: Historical Trends (Since 2019) and Forecasted Estimates (Till 2035)
- 21.11. Explainable AI Market for Others: Historical Trends (Since 2019) and Forecasted Estimates (Till 2035)
- 21.12. Data Triangulation and Validation
- 21.12.1. Secondary Sources
- 21.12.2. Primary Sources
- 21.12.3. Statistical Modeling
22. MARKET OPPORTUNITIES BASED ON END-USER
- 22.1. Chapter Overview
- 22.2. Key Assumptions and Methodology
- 22.3. Revenue Shift Analysis
- 22.4. Market Movement Analysis
- 22.5. Penetration-Growth (P-G) Matrix
- 22.6. Explainable AI Market for Aerospace & Defense: Historical Trends (Since 2019) and Forecasted Estimates (Till 2035)
- 22.7. Explainable AI Market for Automotive: Historical Trends (Since 2019) and Forecasted Estimates (Till 2035)
- 22.8. Explainable AI Market for Healthcare: Historical Trends (Since 2019) and Forecasted Estimates (Till 2035)
- 22.9. Explainable AI Market for IT & Telecommunication: Historical Trends (Since 2019) and Forecasted Estimates (Till 2035)
- 22.10. Explainable AI Market for Public Sector & Utilities: Historical Trends (Since 2019) and Forecasted Estimates (Till 2035)
- 22.11. Explainable AI Market for Retail and E-commerce: Historical Trends (Since 2019) and Forecasted Estimates (Till 2035)
- 22.12. Data Triangulation and Validation
- 22.12.1. Secondary Sources
- 22.12.2. Primary Sources
- 22.12.3. Statistical Modeling
23. MARKET OPPORTUNITIES BASED ON TYPE OF ENTERPRISE
- 23.1. Chapter Overview
- 23.2. Key Assumptions and Methodology
- 23.3. Revenue Shift Analysis
- 23.4. Market Movement Analysis
- 23.5. Penetration-Growth (P-G) Matrix
- 23.6. Explainable AI Market for Large: Historical Trends (Since 2019) and Forecasted Estimates (Till 2035)
- 23.7. Explainable AI Market for Small and Medium Enterprise: Historical Trends (Since 2019) and Forecasted Estimates (Till 2035)
- 23.8. Data Triangulation and Validation
- 23.8.1. Secondary Sources
- 23.8.2. Primary Sources
- 23.8.3. Statistical Modeling
24. MARKET OPPORTUNITIES FOR EXPLAINABLE AI IN NORTH AMERICA
- 24.1. Chapter Overview
- 24.2. Key Assumptions and Methodology
- 24.3. Revenue Shift Analysis
- 24.4. Market Movement Analysis
- 24.5. Penetration-Growth (P-G) Matrix
- 24.6. Explainable AI Market in North America: Historical Trends (Since 2019) and Forecasted Estimates (Till 2035)
- 24.6.1. Explainable AI Market in the US: Historical Trends (Since 2019) and Forecasted Estimates (Till 2035)
- 24.6.2. Explainable AI Market in Canada: Historical Trends (Since 2019) and Forecasted Estimates (Till 2035)
- 24.6.3. Explainable AI Market in Mexico: Historical Trends (Since 2019) and Forecasted Estimates (Till 2035)
- 24.6.4. Explainable AI Market in Other North American Countries: Historical Trends (Since 2019) and Forecasted Estimates (Till 2035)
- 24.7. Data Triangulation and Validation
25. MARKET OPPORTUNITIES FOR EXPLAINABLE AI IN EUROPE
- 25.1. Chapter Overview
- 25.2. Key Assumptions and Methodology
- 25.3. Revenue Shift Analysis
- 25.4. Market Movement Analysis
- 25.5. Penetration-Growth (P-G) Matrix
- 25.6. Explainable AI Market in Europe: Historical Trends (Since 2019) and Forecasted Estimates (Till 2035)
- 25.6.1. Explainable AI Market in Austria: Historical Trends (Since 2019) and Forecasted Estimates (Till 2035)
- 25.6.2. Explainable AI Market in Belgium: Historical Trends (Since 2019) and Forecasted Estimates (Till 2035)
- 25.6.3. Explainable AI Market in Denmark: Historical Trends (Since 2019) and Forecasted Estimates (Till 2035)
- 25.6.4. Explainable AI Market in France: Historical Trends (Since 2019) and Forecasted Estimates (Till 2035)
- 25.6.5. Explainable AI Market in Germany: Historical Trends (Since 2019) and Forecasted Estimates (Till 2035)
- 25.6.6. Explainable AI Market in Ireland: Historical Trends (Since 2019) and Forecasted Estimates (Till 2035)
- 25.6.7. Explainable AI Market in Italy: Historical Trends (Since 2019) and Forecasted Estimates (Till 2035)
- 25.6.8. Explainable AI Market in Netherlands: Historical Trends (Since 2019) and Forecasted Estimates (Till 2035)
- 25.6.9. Explainable AI Market in Norway: Historical Trends (Since 2019) and Forecasted Estimates (Till 2035)
- 25.6.10. Explainable AI Market in Russia: Historical Trends (Since 2019) and Forecasted Estimates (Till 2035)
- 25.6.11. Explainable AI Market in Spain: Historical Trends (Since 2019) and Forecasted Estimates (Till 2035)
- 25.6.12. Explainable AI Market in Sweden: Historical Trends (Since 2019) and Forecasted Estimates (Till 2035)
- 25.6.13. Explainable AI Market in Sweden: Historical Trends (Since 2019) and Forecasted Estimates (Till 2035)
- 25.6.14. Explainable AI Market in Switzerland: Historical Trends (Since 2019) and Forecasted Estimates (Till 2035)
- 25.6.15. Explainable AI Market in the UK: Historical Trends (Since 2019) and Forecasted Estimates (Till 2035)
- 25.6.16. Explainable AI Market in Other European Countries: Historical Trends (Since 2019) and Forecasted Estimates (Till 2035)
- 25.7. Data Triangulation and Validation
26. MARKET OPPORTUNITIES FOR EXPLAINABLE AI IN ASIA
- 26.1. Chapter Overview
- 26.2. Key Assumptions and Methodology
- 26.3. Revenue Shift Analysis
- 26.4. Market Movement Analysis
- 26.5. Penetration-Growth (P-G) Matrix
- 26.6. Explainable AI Market in Asia: Historical Trends (Since 2019) and Forecasted Estimates (Till 2035)
- 26.6.1. Explainable AI Market in China: Historical Trends (Since 2019) and Forecasted Estimates (Till 2035)
- 26.6.2. Explainable AI Market in India: Historical Trends (Since 2019) and Forecasted Estimates (Till 2035)
- 26.6.3. Explainable AI Market in Japan: Historical Trends (Since 2019) and Forecasted Estimates (Till 2035)
- 26.6.4. Explainable AI Market in Singapore: Historical Trends (Since 2019) and Forecasted Estimates (Till 2035)
- 26.6.5. Explainable AI Market in South Korea: Historical Trends (Since 2019) and Forecasted Estimates (Till 2035)
- 26.6.6. Explainable AI Market in Other Asian Countries: Historical Trends (Since 2019) and Forecasted Estimates (Till 2035)
- 26.7. Data Triangulation and Validation
27. MARKET OPPORTUNITIES FOR EXPLAINABLE AI IN MIDDLE EAST AND NORTH AFRICA (MENA)
- 27.1. Chapter Overview
- 27.2. Key Assumptions and Methodology
- 27.3. Revenue Shift Analysis
- 27.4. Market Movement Analysis
- 27.5. Penetration-Growth (P-G) Matrix
- 27.6. Explainable AI Market in Middle East and North Africa (MENA): Historical Trends (Since 2019) and Forecasted Estimates (Till 2035)
- 27.6.1. Explainable AI Market in Egypt: Historical Trends (Since 2019) and Forecasted Estimates (Till 205)
- 27.6.2. Explainable AI Market in Iran: Historical Trends (Since 2019) and Forecasted Estimates (Till 2035)
- 27.6.3. Explainable AI Market in Iraq: Historical Trends (Since 2019) and Forecasted Estimates (Till 2035)
- 27.6.4. Explainable AI Market in Israel: Historical Trends (Since 2019) and Forecasted Estimates (Till 2035)
- 27.6.5. Explainable AI Market in Kuwait: Historical Trends (Since 2019) and Forecasted Estimates (Till 2035)
- 27.6.6. Explainable AI Market in Saudi Arabia: Historical Trends (Since 2019) and Forecasted Estimates (Till 2035)
- 27.6.7. Explainable AI Market in United Arab Emirates (UAE): Historical Trends (Since 2019) and Forecasted Estimates (Till 2035)
- 27.6.8. Explainable AI Market in Other MENA Countries: Historical Trends (Since 2019) and Forecasted Estimates (Till 2035)
- 27.7. Data Triangulation and Validation
28. MARKET OPPORTUNITIES FOR EXPLAINABLE AI IN LATIN AMERICA
- 28.1. Chapter Overview
- 28.2. Key Assumptions and Methodology
- 28.3. Revenue Shift Analysis
- 28.4. Market Movement Analysis
- 28.5. Penetration-Growth (P-G) Matrix
- 28.6. Explainable AI Market in Latin America: Historical Trends (Since 2019) and Forecasted Estimates (Till 2035)
- 28.6.1. Explainable AI Market in Argentina: Historical Trends (Since 2019) and Forecasted Estimates (Till 2035)
- 28.6.2. Explainable AI Market in Brazil: Historical Trends (Since 2019) and Forecasted Estimates (Till 2035)
- 28.6.3. Explainable AI Market in Chile: Historical Trends (Since 2019) and Forecasted Estimates (Till 2035)
- 28.6.4. Explainable AI Market in Colombia Historical Trends (Since 2019) and Forecasted Estimates (Till 2035)
- 28.6.5. Explainable AI Market in Venezuela: Historical Trends (Since 2019) and Forecasted Estimates (Till 2035)
- 28.6.6. Explainable AI Market in Other Latin American Countries: Historical Trends (Since 2019) and Forecasted Estimates (Till 2035)
- 28.7. Data Triangulation and Validation
29. MARKET OPPORTUNITIES FOR EXPLAINABLE AI IN REST OF THE WORLD
- 29.1. Chapter Overview
- 29.2. Key Assumptions and Methodology
- 29.3. Revenue Shift Analysis
- 29.4. Market Movement Analysis
- 29.5. Penetration-Growth (P-G) Matrix
- 29.6. Explainable AI Market in Rest of the World: Historical Trends (Since 2019) and Forecasted Estimates (Till 2035)
- 29.6.1. Explainable AI Market in Australia: Historical Trends (Since 2019) and Forecasted Estimates (Till 2035)
- 29.6.2. Explainable AI Market in New Zealand: Historical Trends (Since 2019) and Forecasted Estimates (Till 2035)
- 29.6.3. Explainable AI Market in Other Countries
- 29.7. Data Triangulation and Validation
30. MARKET CONCENTRATION ANALYSIS: DISTRIBUTION BY LEADING PLAYERS
- 30.1. Leading Player 1
- 30.2. Leading Player 2
- 30.3. Leading Player 3
- 30.4. Leading Player 4
- 30.5. Leading Player 5
- 30.6. Leading Player 6
- 30.7. Leading Player 7
- 30.8. Leading Player 8
31. ADJACENT MARKET ANALYSIS
SECTION VII: STRATEGIC TOOLS
32. KEY WINNING STRATEGIES
33. PORTER'S FIVE FORCES ANALYSIS
34. SWOT ANALYSIS
35. VALUE CHAIN ANALYSIS
36. ROOTS STRATEGIC RECOMMENDATIONS
- 36.1. Chapter Overview
- 36.2. Key Business-related Strategies
- 36.2.1. Research & Development
- 36.2.2. Product Manufacturing
- 36.2.3. Commercialization / Go-to-Market
- 36.2.4. Sales and Marketing
- 36.3. Key Operations-related Strategies
- 36.3.1. Risk Management
- 36.3.2. Workforce
- 36.3.3. Finance
- 36.3.4. Others
SECTION VIII: OTHER EXCLUSIVE INSIGHTS
37. INSIGHTS FROM PRIMARY RESEARCH
38. REPORT CONCLUSION
SECTION IX: APPENDIX
39. TABULATED DATA
40. LIST OF COMPANIES AND ORGANIZATIONS
41. CUSTOMIZATION OPPORTUNITIES
42. ROOTS SUBSCRIPTION SERVICES
43. AUTHOR DETAILS
 可解释人工智慧市场:组件、方法、技术类型、软体类型、部署模型、应用、最终用途—2026-2032年全球市场预测
 2026年可解释人工智慧全球市场报告
 可解释人工智慧市场分析及至2035年预测:按类型、产品、服务、技术、组件、应用、部署、最终用户和功能划分
 可解释人工智慧全球市场规模、份额、趋势和成长分析报告(2026-2034)
 全球可解释人工智慧市场
 可解释人工智慧市场-全球产业规模、份额、趋势、机会和预测,按组件、部署方式、应用、最终用途、地区和竞争格局划分,2021-2031年预测
 可解释人工智慧 (XAI) 市场,全球预测至 2032 年:按组件、模型类型、部署模式、技术、最终用户和地区划分2032 年人工智慧透明区块链市场预测:按组件、技术、组织规模、部署模式、应用、最终用户和地区进行的全球分析全球可解释人工智慧身分验证市场:未来预测(至 2032 年)—按组件、身分验证类型、部署模式、组织规模、应用程式、最终使用者和地区进行分析2032 年可解释人工智慧市场预测:按组件、部署、应用、最终用户和地区进行的全球分析