


 |
市场调查报告书
商品编码
1817402
电子批次记录市场:产业趋势及2035年全球预测-按电子批次记录系统类型、部署模式、电子批次记录用途、地区及主要参与者划分Electronics Batch Records Market: Industry Trends and Global Forecasts, Till 2035 - Distribution by Type of Electronic Batch Record System, Deployment Mode, Purpose of Electronic Batch Record, Geographical Regions and Leading Players |
||||||
电子批次记录市场:概览
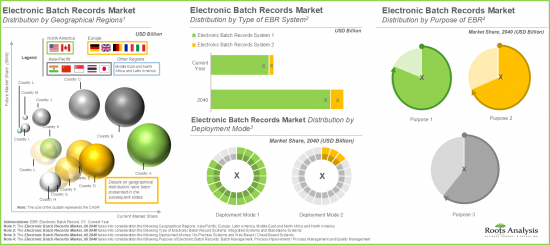
全球电子批次记录市场目前估值12.8亿美元,预计2040年将达到96.2亿美元,预测期内复合年增长率为14.4%。
电子批次记录市场机会细分为以下几个部分:
电子批次记录系统的类型
- 整合系统
- 独立系统
部署模式
- 本地部署
- 基于Web/基于云端
电子批次记录的用途记录
- 批次管理
- 製程改善/製程管理
- 品质管理
地区
- 北美
- 欧洲
- 亚太地区
- 中东和北非
- 拉丁美洲
北美市场
- 美国
- 加拿大
欧洲市场
- 德国
- 英国
- 法国
- 义大利
- 西班牙
- 其他
亚太市场
- 中国
- 印度
- 日本等
中东和北非市场
- 沙乌地阿拉伯
- 阿拉伯联合大公国阿联酋
- 埃及
拉丁美洲市场
- 巴西
- 墨西哥
- 阿根廷
电子批次记录市场成长与趋势
电子批次记录 (EBR) 是一种旨在追踪、简化和自动化生产流程的数位化解决方案。这些系统可以撷取、监控和储存生产线上每个批次的生产数据,确保整个生产生命週期的透明度和品质标准的一致性。目前,电子批次记录广泛应用于法规遵循和品质保证至关重要的各个领域,包括製药、生物技术、医疗保健以及食品饮料行业。
此外,传统的手动批次记录存在诸多课题,包括人为错误和潜在的违反监管标准的风险,这些课题可能会扰乱生产流程。为了克服这些课题,许多製造商正在采用电子批次记录,以在提高产品品质的同时最大限度地降低营运和生产成本。此外,美国食品药物管理局于 1990 年推出了 21 CFR Part 11 合规标准,旨在加强良好生产规范 (GMP),这标誌着数位化批量生产解决方案的采用迈出了重要一步,并凸显了 EBR 系统的重要性。
日益增长的安全隐患、更严格的监管要求以及对科学验证的需求,正在加速对先进 EBR 解决方案的需求。此外,对品质的日益重视、向多产品策略的转变、先进技术的整合以及人工智慧在EBR系统中的出现,预计将进一步推动该市场的成长。
电子批记录市场的关键洞见
本报告深入探讨了电子批记录市场的现状,并识别了行业内的潜在成长机会。报告的主要内容包括:
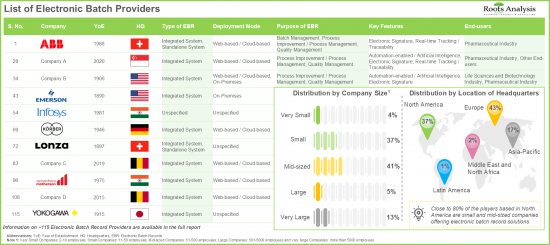
- 目前,全球各地的公司提供约115种电子批记录解决方案。
- 近95%的电子批记录着重于品质控制,其中近60%的EBR是为製药业自动化而开发的。
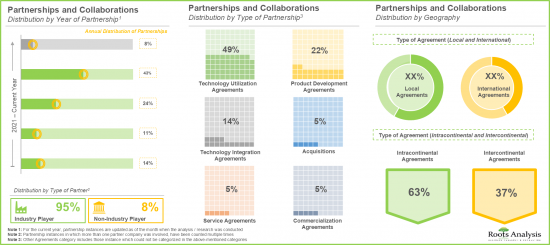
- 近年来,合作活动稳步成长,其中技术存取协定成为最主要的合作模式。
- 近期,电子批次记录 (EBR) 领域超过 60% 的措施都专注于推出新的解决方案。值得注意的是,83% 的已发布或升级的解决方案都包含即时追踪和可追溯性功能。
- 受自动化解决方案需求成长和法规遵循加强的推动,预计电子批次记录市场在可预见的未来将保持强劲成长。
- 预计到 2040 年,该市场的复合年增长率 (CAGR) 将达到 14.4%,其中整合系统细分市场预计将占大部分市场占有率(近 80%)。
电子批次记录市场的主要细分
根据电子批次记录系统的类型,全球市场分为整合系统和独立系统。目前,整合系统占了整体市场的主导地位。此外,需要强调的是,这一趋势在未来不太可能改变。这是因为这些系统能够提高製造流程的效率和生产力,并降低合规成本和减少人为错误。
全球电子批次记录市场按部署类型分为基于 Web/基于云端和本地部署。目前,本地部署部分占该市场收入的大部分。然而,基于网路/云端部署模式的收入预计将在预测期内以更高的复合年增长率成长。
根据电子批记录的用途,全球市场细分为批次管理、製程改善/製程管理和品质控制。目前,品质控制占最大的市场占有率,并且由于品质控制意识的增强以及保持生产批记录准确性和可靠性的需求,这一趋势在未来不太可能改变。
依主要地区划分,市场细分为北美、欧洲、亚太、中东和北非以及拉丁美洲。目前,北美占最大的市场占有率。此外,值得注意的是,预计亚太市场在预测期内将以相对较高的复合年增长率成长。
进入电子批次记录市场的公司范例
- ABB
- AmpleLogic
- Ant Solutions
- Datex
- Ecubix
- InstantGMP
- Korber
- Sapio Sciences
- Scigeniq
- Siemens
- Solulever
- Supertech Instrumentation
- Thermo Fisher Scientific
- Tulip Interfaces
- Yokogawa
电子批次记录市场研究报告
本电子批次记录市场报告深入分析了各个细分领域,包括:
- 市场规模和机会分析:本报告深入分析了电子批次记录市场的当前市场机会和未来成长潜力,重点关注以下关键细分市场:A) 电子批次记录的类型记录系统、[B] 部署模式、[C] 电子批记录的用途、[D] 地区和 [E] 关键公司。
- 市场影响分析:本报告彻底分析了可能影响市场成长的各种因素,包括[A] 推动因素、[B] 阻碍因素、[C] 市场推动因素和[D] 现有课题。
- 市场格局:本报告根据几个相关参数对电子批记录系统进行了全面评估,例如 A) 电子批记录系统的类型、[B] 部署模式、[C] 电子批记录的用途、[D] 主要功能和 [E] 最终用户。
- 电子批记录系统格局:列出电子批记录领域的系统供应商,并根据 A) 成立年份、[B] 公司规模和 [C] 总部位置进行分析。
- 竞争分析:根据各种相关参数,包括 A) 公司实力、[B] 产品组合实力和 [C] 最终用户,审查假设的临床试验公司在该领域的竞争地位。
- 公司简介:提供以下资讯:A) 公司概况、[B] 财务资讯(如有)、[C] 解决方案组合、[D] 最新发展和 [E] 未来展望。
- 合作关係与协作:基于若干相关参数,详细分析 2021 年以来电子批次记录市场利益相关者之间达成的合作伙伴关係,包括 A) 合作年份、[B] 合作类型、[C] 合作伙伴类型、[D] 电子批次记录的目的、[E] 最终用户、[F] 最活跃的参与者(合作伙伴数量)和 [G] 地区。
- 近期举措:基于若干相关参数,详细分析电子批次记录领域开展的各种举措,例如:A) 举措年份、B) 举措类型、C) 电子批次记录的目标、D) 主要特点、E) 最终用户、F) 最活跃的参与者(近期举措数量)、G) 地区。
目录
第一部分:报告概述
第一章:引言
第二章:研究方法
第三章:市场动态
- 章节概述
- 预测研究法
- 市场估值框架
- 预测工具与技术
- 关键考虑因素
- 局限性
第四章:宏观经济指标
- 章节概述
- 市场动态
- 结论
第二部分:质性洞察
第五章:摘要整理
第六章:引言
第三节:市场概况
第七章:市场格局
- 章节概览
- 电子批记录解决方案供应商:市场格局
第八章:竞争分析
- 章节概览
- 假设和关键参数
- 研究方法
- 同侪概览
- 电子批记录解决方案提供者:竞争分析
第四节:公司简介
第九章:公司简介:北美电子批记录解决方案供应商
- 章节概览
- 赛默飞世尔科技
- Datex
- InstantGMP
- Sapio Sciences
- Tulip Interfaces
第10章:公司简介:欧洲电子批记录解决方案提供者
- 章节概述
- ABB
- Ant Solutions
- Körber
- 西门子
- Solulever
第11章:公司简介:亚太及其他地区电子批记录解决方案提供者
- 第概述
- 横河马达
- AmpleLogic
- Ecubix
- Scigeniq
- Supertech Instrumentation
第五节 市场趋势
第十二章 合作伙伴关係与合作
- 章节概述
- 合作伙伴关係模式
- 电子批次记录:合作伙伴关係与合作
第十三章 近期举措
- 章节概述
- 电子批次记录解决方案:近期举措
第六节 市场机会分析
第十四章 市场影响分析:推动因素阻碍因素、机会与课题
- 章节概述
- 市场推动因素
- 市场阻碍因素
- 市场机遇
- 市场课题
- 结论
第十五章:全球电子批次记录市场
- 章节概述
- 假设与研究方法
- 全球电子批次记录市场:历史趋势(2020 年及以后)和预测(至 2040 年)
- 主要细分市场
第十六章:以电子批次记录系统类型划分的电子批次记录市场
第十七章:以部署模式划分的电子批次记录市场
第十八章:以电子批次记录系统类型划分的电子批次记录市场记录用途
第19章:电子批次记录市场(按地区)
第20章:电子批次记录解决方案市场(按主要参与者)
第7节:补充见解
第21章:结论
第22章 附录1:表格数据
第23章 附录2:公司与组织列表
ELECTRONIC BATCH RECORDS MARKET: OVERVIEW
As per Roots Analysis, the global electronic batch records market size is currently valued at USD 1.28 billion and is projected to reach USD 9.62 billion by 2040, growing at a CAGR of 14.4% during the forecast period.
The opportunity for electronic batch records market has been distributed across the following segments:
Type of Electronic Batch Record System
- Integrated System
- Standalone System
Deployment Mode
- On-Premises
- Web-based / Cloud-based
Purpose of Electronic Batch Record
- Batch Management
- Process Improvement / Process Management
- Quality Management
Geographical Regions
- North America
- Europe
- Asia-Pacific
- Middle East and North Africa
- Latin America
Market in North America
- US
- Canada
Market in Europe
- Germany
- UK
- France
- Italy
- Spain
- Rest of Europe
Market in Asia-Pacific
- China
- India
- Japan and Rest of Asia-Pacific
Market in Middle East and North Africa
- Saudi Arabia
- UAE
- Egypt
Market in Latin America
- Brazil
- Mexico
- Argentina
Electronic Batch Records Market: Growth and Trends
Electronic batch records (EBR) are digital solutions designed to track, streamline, and automate manufacturing processes. These systems capture, monitor, and store production data for every batch on the production line, ensuring transparency and adherence to quality standards across the entire manufacturing lifecycle. Currently, the electronic batch records are widely used in various sectors, such as pharmaceuticals, biotechnology, healthcare, and the food and beverage industry, where regulatory compliance and quality assurance are critical.
Moreover, the traditional manual batch records pose several challenges that can disrupt manufacturing processes, as they are more prone to human error and can lead to potential violations of regulatory standards. To overcome these challenges, many manufacturers have adopted electronic batch records in order to enhance their product quality while minimizing the operational and production costs. Further, the introduction of 21 CFR Part 11 compliance standards by the US Food and Drug Administration in 1990, aimed at reinforcing Good Manufacturing Practices (GMPs) marked a significant step toward the adoption of digital batch manufacturing solutions, underscoring the importance of EBR systems.
Growing safety concerns, stricter regulatory requirements, and the demand for scientific validation have accelerated the need for advanced EBR solutions. In addition, the increasing emphasis on quality, the shift toward multi-product manufacturing strategies, the integration of advanced technologies, and the emergence of artificial intelligence in EBR systems are expected to drive further growth in this market.
Electronic Batch Records Market: Key Insights
The report delves into the current state of the electronic batch records market and identifies potential growth opportunities within the industry. The key takeaways of the report are:
- Presently, around 115 electronic batch record solutions are offered by companies across the globe; majority of the electronic batch solution providers are headquartered in Europe.
- Close to 95% electronic batch records focus on quality management; nearly 60% of these EBRs are developed for automation in the pharmaceutical industry.
- A steady growth in the partnership activity has been observed in recent years; technology utilization agreements have emerged as the most prominent partnering model.
- More than 60% of the recent initiatives within EBR domain were focused on the launch of new solutions; notably, 83% of the solutions launched / upgraded are incorporated with real-time tracking / traceability.
- Driven by the escalating demand for automated solutions and growing regulatory compliance, the electronic batch record market is poised to rise steadily in the foreseeable future.
- The market is anticipated to grow at an annualized rate (CAGR) of 14.4% by 2040; the integrated systems segment is expected to capture the majority share (close to 80%) of the market.
Electronic Batch Records Market: Key Segments
Integrated Systems are Likely to Hold the Largest Share in the Electronic Batch Records Market During the Forecast Period
Based on the type of electronic batch record systems, the global market is segmented into integrated systems and standalone systems. Currently, the integrated systems segment leads the overall market. Further, it is important to highlight that this trend is unlikely to change in the future as well. This can be attributed to the fact that these systems have the capability to improve the efficiency and productivity of manufacturing processes, while reducing the compliance cost and manual errors.
Electronic Batch Records Market for Web-Based / Cloud-Based Deployment Mode is Likely to Grow at a Relatively Faster Pace During the Forecast Period
Based on the deployment mode, the global electronic batch records market is segmented across web-based / cloud-based segment and on-premises. Presently, the market is dominated by the revenues generated through on-premises segment. However, the revenues generated by web-based / cloud-based deployment mode are anticipated to grow at a higher CAGR during the forecast period.
Quality Management Hold the Largest Share in the Electronic Batch Records Market
Based on the purpose of electronic batch records, the global market is segmented into batch management, process improvement / process management and quality management. Presently, the quality management segment accounts for the largest market share, and this trend is unlikely to change in the future as well owing to the widespread awareness of quality control and maintaining the accuracy and reliability of manufacturing batch records.
North America Accounts for the Largest Share in the Market
Based on key geographical regions, the market is segmented into North America, Europe, Asia Pacific, Middle East and North Africa, Latin America. In the current scenario, North America is likely to capture the largest market share. Further, it is worth highlighting that the market in Asia-Pacific is expected to grow at a relatively high CAGR during the forecast period.
Example Players in the Electronic Batch Records Market
- ABB
- AmpleLogic
- Ant Solutions
- Datex
- Ecubix
- InstantGMP
- Korber
- Sapio Sciences
- Scigeniq
- Siemens
- Solulever
- Supertech Instrumentation
- Thermo Fisher Scientific
- Tulip Interfaces
- Yokogawa
Electronic Batch Records Market: Research Coverage
The report on electronic batch records market features insights into various sections, including:
- Market Sizing and Opportunity Analysis: An in-depth analysis of current market opportunity and the future growth potential of electronic batch records market, focusing on key market segments, including [A] type of electronic batch record system, [B] deployment mode, [C] purpose of electronic batch record, [D] geographical regions, and [E] leading players.
- Market Impact Analysis: A thorough analysis of various factors, such as [A] drivers, [B] restraints, [C] opportunities, and [D] existing challenges that are likely to impact market growth.
- Market Landscape: A comprehensive evaluation of electronic batch record systems, based on several relevant parameters, such as [A] type of electronic batch record system, [B] deployment mode, [C] purpose of electronic batch record, [D] key features, and [E] end user.
- Electronic Batch Records Systems Landscape: The report features a list of system providers engaged in the electronic batch records domain, along with analyses based on [A] year of establishment, [B] company size, and [C] location of headquarters.
- Company Competitiveness Analysis: An insightful competitiveness analysis of the virtual clinical trials companies in this domain, based on various relevant parameters, such as [A] company strength, [B] portfolio strength, and [C] end user.
- Company Profiles: Comprehensive profiles of key industry players in the electronic batch records domain, featuring information on [A] company overview, [B] financial information (if available), [C] solutions portfolio, [D] recent developments, and [E] future outlook statements.
- Partnerships and Collaborations: A detailed analysis of partnerships inked between stakeholders in the electronic batch records market, since 2021, based on several relevant parameters, such as [A] year of partnership, [B] type of partnership, [C] type of partner, [D] purpose of electronic batch record, [E] end user, [F] most active players (in terms of number of partnerships), and [G] geography.
- Recent Initiatives: A detailed analysis of the various initiatives undertaken in the electronic batch records domain, based on several relevant parameters, such as [A] year of initiative, [B] type of initiative, [C] purpose of electronic batch record, [D] key features, [E] end user, [F] most active players (in terms of number of recent initiatives), and [G] geography.
Key Questions Answered in this Report
- How many companies are currently engaged in this market?
- Which are the leading companies in this market?
- What factors are likely to influence the evolution of this market?
- What is the current and future market size?
- What is the CAGR of this market?
- How is the current and future market opportunity likely to be distributed across key market segments?
Reasons to Buy this Report
- The report provides a comprehensive market analysis, offering detailed revenue projections of the overall market and its specific sub-segments. This information is valuable to both established market leaders and emerging entrants.
- Stakeholders can leverage the report to gain a deeper understanding of the competitive dynamics within the market. By analyzing the competitive landscape, businesses can make informed decisions to optimize their market positioning and develop effective go-to-market strategies.
- The report offers stakeholders a comprehensive overview of the market, including key drivers, barriers, opportunities, and challenges. This information empowers stakeholders to stay abreast of market trends and make data-driven decisions to capitalize on growth prospects.
Additional Benefits
- Complimentary PPT Insights Packs
- Complimentary Excel Data Packs for all Analytical Modules in the Report
- 15% Free Content Customization
- Detailed Report Walkthrough Session with Research Team
- Free Updated report if the report is 6-12 months old or older
TABLE OF CONTENTS
SECTION I: REPORT OVERVIEW
1. PREFACE
- 1.1. Introduction
- 1.2. Market Share Insights
- 1.3. Key Market Insights
- 1.4. Report Coverage
- 1.5. Key Questions Answered
- 1.6. Chapter Outlines
2. RESEARCH METHODOLOGY
- 2.1. Chapter Overview
- 2.2. Research Assumptions
- 2.2.1. Market Landscape and Market Trends
- 2.2.2. Market Forecast and Opportunity Analysis
- 2.2.3. Comparative Analysis
- 2.3. Database Building
- 2.3.1. Data Collection
- 2.3.2. Data Validation
- 2.3.3. Data Analysis
- 2.4. Project Methodology
- 2.4.1. Secondary Research
- 2.4.1.1. Annual Reports
- 2.4.1.2. Academic Research Papers
- 2.4.1.3. Company Websites
- 2.4.1.4. Investor Presentations
- 2.4.1.5. Regulatory Filings
- 2.4.1.6. White Papers
- 2.4.1.7. Industry Publications
- 2.4.1.8. Conferences and Seminars
- 2.4.1.9. Government Portals
- 2.4.1.10. Media and Press Releases
- 2.4.1.11. Newsletters
- 2.4.1.12. Industry Databases
- 2.4.1.13. Roots Proprietary Databases
- 2.4.1.14. Paid Databases and Sources
- 2.4.1.15. Social Media Portals
- 2.4.1.16. Other Secondary Sources
- 2.4.2. Primary Research
- 2.4.2.1. Types of Primary Research
- 2.4.2.1.1. Qualitative Research
- 2.4.2.1.2. Quantitative Research
- 2.4.2.1.3. Hybrid Approach
- 2.4.2.2. Advantages of Primary Research
- 2.4.2.3. Techniques for Primary Research
- 2.4.2.3.1. Interviews
- 2.4.2.3.2. Surveys
- 2.4.2.3.3. Focus Groups
- 2.4.2.3.4. Observational Research
- 2.4.2.3.5. Social Media Interactions
- 2.4.2.4. Key Opinion Leaders Considered in Primary Research
- 2.4.2.4.1. Company Executives (CXOs)
- 2.4.2.4.2. Board of Directors
- 2.4.2.4.3. Company Presidents and Vice Presidents
- 2.4.2.4.4. Research and Development Heads
- 2.4.2.4.5. Technical Experts
- 2.4.2.4.6. Subject Matter Experts
- 2.4.2.4.7. Scientists
- 2.4.2.4.8. Doctors and Other Healthcare Providers
- 2.4.2.5. Ethics and Integrity
- 2.4.2.5.1. Research Ethics
- 2.4.2.5.2. Data Integrity
- 2.4.2.1. Types of Primary Research
- 2.4.3. Analytical Tools and Databases
- 2.4.1. Secondary Research
- 2.5. Robust Quality Control
3. MARKET DYNAMICS
- 3.1. Chapter Overview
- 3.2. Forecast Methodology
- 3.2.1. Top-down Approach
- 3.2.2. Bottom-up Approach
- 3.2.3. Hybrid Approach
- 3.3. Market Assessment Framework
- 3.3.1. Total Addressable Market (TAM)
- 3.3.2. Serviceable Addressable Market (SAM)
- 3.3.3. Serviceable Obtainable Market (SOM)
- 3.3.4. Currently Acquired Market (CAM)
- 3.4. Forecasting Tools and Techniques
- 3.4.1. Qualitative Forecasting
- 3.4.2. Correlation
- 3.4.3. Regression
- 3.4.4. Extrapolation
- 3.4.5. Convergence
- 3.4.6. Sensitivity Analysis
- 3.4.7. Scenario Planning
- 3.4.8. Data Visualization
- 3.4.9. Time Series Analysis
- 3.4.10. Forecast Error Analysis
- 3.5. Key Considerations
- 3.5.1. Demographics
- 3.5.2. Government Regulations
- 3.5.3. Reimbursement Scenarios
- 3.5.4. Market Access
- 3.5.5. Supply Chain
- 3.5.6. Industry Consolidation
- 3.5.7. Pandemic / Unforeseen Disruptions Impact
- 3.6. Limitations
4. MACRO-ECONOMIC INDICATORS
- 4.1. Chapter Overview
- 4.2. Market Dynamics
- 4.2.1. Time Period
- 4.2.1.1. Historical Trends
- 4.2.1.2. Current and Forecasted Estimates
- 4.2.2. Currency Coverage
- 4.2.2.1. Major Currencies Affecting the Market
- 4.2.2.2. Factors Affecting Currency Fluctuations
- 4.2.2.3. Impact of Currency Fluctuations on the Industry
- 4.2.3. Foreign Currency Exchange Rate
- 4.2.3.1. Impact of Foreign Exchange Rate Volatility on the Market
- 4.2.3.2. Strategies for Mitigating Foreign Exchange Risk
- 4.2.4. Recession
- 4.2.4.1. Assessment of Current Economic Conditions and Potential Impact on the Market
- 4.2.4.2. Historical Analysis of Past Recessions and Lessons Learnt
- 4.2.5. Inflation
- 4.2.5.1. Measurement and Analysis of Inflationary Pressures in the Economy
- 4.2.5.2. Potential Impact of Inflation on the Market Evolution
- 4.2.6. Interest Rates
- 4.2.6.1. Interest Rates and Their Impact on the Market
- 4.2.6.2. Strategies for Managing Interest Rate Risk
- 4.2.7. Commodity Flow Analysis
- 4.2.7.1. Type of Commodity
- 4.2.7.2. Origins and Destinations
- 4.2.7.3. Value and Weights
- 4.2.7.4. Modes of Transportation
- 4.2.8. Global Trade Dynamics
- 4.2.8.1. Import Scenario
- 4.2.8.2. Export Scenario
- 4.2.8.3. Trade Policies
- 4.2.8.4. Strategies for Mitigating the Risks Associated with Trade Barriers
- 4.2.8.5. Impact of Trade Barriers on the Market
- 4.2.9. War Impact Analysis
- 4.2.9.1. Russian-Ukraine War
- 4.2.9.2. Israel-Hamas War
- 4.2.10. COVID Impact / Related Factors
- 4.2.10.1. Global Economic Impact
- 4.2.10.2. Industry-specific Impact
- 4.2.10.3. Government Response and Stimulus Measures
- 4.2.10.4. Future Outlook and Adaptation Strategies
- 4.2.11. Other Indicators
- 4.2.11.1. Fiscal Policy
- 4.2.11.2. Consumer Spending
- 4.2.11.3. Gross Domestic Product (GDP)
- 4.2.11.4. Employment
- 4.2.11.5. Taxes
- 4.2.11.6. Stock Market Performance
- 4.2.11.7. Cross-Border Dynamics
- 4.2.1. Time Period
- 4.3. Conclusion
SECTION II: QUALITATIVE INSIGHTS
5. EXECUTIVE SUMMARY
6. INTRODUCTION
- 6.1. Chapter Overview
- 6.2. Types of Batch Records
- 6.3. Features of Electronic Batch Records
- 6.4. Applications of Electronic Batch Records
- 6.5. Advantages of Electronic Batch Records
- 6.6. Disadvantages of Electronic Batch Records
- 6.7. Key Considerations while Selecting an EBR Solution
- 6.8. Future Perspective
SECTION III: MARKET OVERVIEW
7. MARKET LANDSCAPE
- 7.1. Chapter Overview
- 7.2. Electronic Batch Record Solution Providers: Overall Market Landscape
- 7.2.1. Analysis by Year of Establishment
- 7.2.2. Analysis by Company Size
- 7.2.3. Analysis by Location of Headquarters
- 7.2.4. Analysis by Type of Electronic Batch Record System
- 7.2.5. Analysis by Deployment Mode
- 7.2.6. Analysis by Purpose of Electronic Batch Record
- 7.2.7. Analysis by Key Features
- 7.2.8. Analysis by End-user
8. COMPANY COMPETITIVENESS ANALYSIS
- 8.1. Chapter Overview
- 8.2. Assumptions and Key Parameters
- 8.3. Methodology
- 8.4. Overview of Peer Groups
- 8.5. Electronic Batch Record Solution Providers: Company Competitiveness Analysis
- 8.5.1. Electronic Batch Record Solution Providers based in North America
- 8.5.2. Electronic Batch Record Solution Providers based in Europe
- 8.5.3. Electronic Batch Record Solution Providers based in Asia-Pacific and Rest of the World
SECTION IV: COMPANY PROFILES
9. COMPANY PROFILES: ELECTRONIC BATCH RECORD SOLUTION PROVIDERS IN NORTH AMERICA
- 9.1. Chapter Overview
- 9.2 Thermo Fisher Scientific
- 9.2.1. Company Overview
- 9.2.2. Electronic Batch Record Solution Portfolio
- 9.2.3. Financial Information
- 9.2.4. Recent Developments and Future Outlook
- 9.3. Datex
- 9.4. InstantGMP
- 9.5. Sapio Sciences
- 9.6. Tulip Interfaces
10. COMPANY PROFILES: ELECTRONIC BATCH RECORD SOLUTION PROVIDERS IN EUROPE
- 10.1. Chapter Overview
- 10.2. ABB
- 10.2.1. Company Overview
- 10.2.2. Electronic Batch Record Solution Portfolio
- 10.2.3. Financial Information
- 10.2.4. Recent Developments and Future Outlook
- 10.3. Ant Solutions
- 10.4. Korber
- 10.5. Siemens
- 10.6. Solulever
11. COMPANY PROFILES: ELECTRONIC BATCH RECORD SOLUTION PROVIDERS IN ASIA-PACIFIC AND REST OF THE WORLD
- 11.1. Chapter Overview
- 11.2. Yokogawa
- 11.2.1. Company Overview
- 11.2.2. Electronic Batch Record Solution Portfolio
- 11.2.3. Financial Information
- 11.2.4. Recent Developments and Future Outlook
- 11.3. AmpleLogic
- 11.4. Ecubix
- 11.5. Scigeniq
- 11.6. Supertech Instrumentation
SECTION V: MARKET TRENDS
12. PARTNERSHIPS AND COLLABORATIONS
- 12.1. Chapter Overview
- 12.2. Partnership Models
- 12.3. Electronic Batch Records: Partnerships and Collaborations
- 12.3.1. Analysis by Year of Partnership
- 12.3.2. Analysis by Type of Partnership
- 12.3.3. Analysis by Year and Type of Partnership
- 12.3.4. Analysis by Type of Partner
- 12.3.5. Analysis by Purpose of Electronic Batch Record
- 12.3.6. Analysis by End-user
- 13.2.7. Most Active Players: Analysis by Number of Partnerships
- 12.3.8. Analysis by Geography
- 12.3.8.1. Analysis by Country
- 12.3.8.2. Analysis by Region
13. RECENT INITIATIVES
- 13.1. Chapter Overview
- 13.2. Electronic Batch Record Solutions: Recent Initiatives
- 13.2.1. Analysis by Year of Initiative
- 13.2.2. Analysis by Type of Initiative
- 13.2.3. Analysis by Year and Type of Initiative
- 13.2.4. Analysis by Purpose of Electronic Batch Record
- 13.2.5. Analysis by Key Features
- 13.2.6. Analysis by End-user
- 13.2.7. Most Active Players: Analysis by Number of Recent Initiatives
- 13.2.8. Analysis by Geography
SECTION VI: MARKET OPPORTUNITY ANALYSIS
14. MARKET IMPACT ANALYSIS: DRIVERS, RESTRAINTS, OPPORTUNITIES AND CHALLENGES
- 14.1. Chapter Overview
- 14.2. Market Drivers
- 14.3. Market Restraints
- 14.4. Market Opportunities
- 14.5. Market Challenges
- 14.6. Conclusion
15. GLOBAL ELECTRONIC BATCH RECORDS MARKET
- 15.1. Chapter Overview
- 15.2. Assumptions and Methodology
- 15.3. Global Electronic Batch Records Market: Historical Trends (Since 2020) and Forecasted Estimates (Till 2040)
- 15.3.1. Roots Analysis Perspective on Market Growth
- 15.3.2. Scenario Analysis
- 15.3.2.1. Conservative Scenario
- 15.3.2.2. Optimistic Scenario
- 15.4. Key Market Segmentations
16. ELECTRONIC BATCH RECORDS MARKET, BY TYPE OF ELECTRONIC BATCH RECORD SYSTEM
- 16.1. Chapter Overview
- 16.2. Assumptions and Methodology
- 16.3. Electronic Batch Records Market: Distribution by Type of Electronic Batch Record System
- 16.3.1. Electronic Batch Records Market for Integrated Systems: Historical Trends (Since 2020) and Forecasted Estimates (Till 2040)
- 16.3.2. Electronic Batch Records Market for Standalone Systems: Historical Trends (Since 2020) and Forecasted Estimates (Till 2040)
- 16.4. Data Triangulation and Validation
17. ELECTRONIC BATCH RECORDS MARKET, BY TYPE OF DEPLOYMENT MODE
- 17.1. Chapter Overview
- 17.2. Assumptions and Methodology
- 17.3. Electronic Batch Records Market: Distribution by Deployment Mode
- 17.3.1. Electronic Batch Records Market for Web-based / Cloud-based Deployment Mode: Historical Trends (Since 2020) and Forecasted Estimates (Till 2040)
- 17.3.2. Electronic Batch Records Market for On-Premises Deployment Mode: Historical Trends (Since 2020) and Forecasted Estimates (Till 2040)
- 17.4. Data Triangulation and Validation
18. ELECTRONIC BATCH RECORDS MARKET, BY PURPOSE OF ELECTRONIC BATCH RECORD
- 18.1. Chapter Overview
- 18.2. Assumptions and Methodology
- 18.3. Electronic Batch Records Market: Distribution by Purpose of Electronic Batch Record
- 18.3.1. Electronic Batch Records Market for Quality Management: Historical Trends (Since 2020) and Forecasted Estimates (Till 2040)
- 18.3.2. Electronic Batch Records Market for Process Improvement / Process Management: Historical Trends (Since 2020) and Forecasted Estimates (Till 2040)
- 18.3.3. Electronic Batch Records Market for Batch Management: Historical Trends (Since 2020) and Forecasted Estimates (Till 2040)
- 18.4. Data Triangulation and Validation
19. ELECTRONIC BATCH RECORDS MARKET, BY GEOGRAPHICAL REGION
- 19.1. Chapter Overview
- 19.2. Assumptions and Methodology
- 19.3. Electronic Batch Records Market: Distribution by Geographical Region
- 19.3.1. Electronic Batch Records Market for North America: Historical Trends (Since 2020) and Forecasted Estimates (Till 2040)
- 19.3.1.1. Electronic Batch Records Market in the US: Historical Trends (Since 2020) and Forecasted Estimates (Till 2040)
- 19.3.1.2. Electronic Batch Records Market in Canada: Historical Trends (Since 2020) and Forecasted Estimates (Till 2040)
- 19.3.2. Electronic Batch Records Market for Europe: Historical Trends (Since 2020) and Forecasted Estimates (Till 2040)
- 19.3.2.1. Electronic Batch Records Market in Germany: Historical Trends (Since 2020) and Forecasted Estimates (Till 2040)
- 19.3.2.2. Electronic Batch Records Market in the UK: Historical Trends (Since 2020) and Forecasted Estimates (Till 2040)
- 19.3.2.3. Electronic Batch Records Market in France: Historical Trends (Since 2020) and Forecasted Estimates (Till 2040)
- 19.3.2.4. Electronic Batch Records Market in Italy: Historical Trends (Since 2020) and Forecasted Estimates (Till 2040)
- 19.3.2.5. Electronic Batch Records Market in Spain: Historical Trends (Since 2020) and Forecasted Estimates (Till 2040)
- 19.3.2.6. Electronic Batch Records Market for Rest of Europe: Historical Trends (Since 2020) and Forecasted Estimates (Till 2040)
- 19.3.3. Electronic Batch Records Market for Asia-Pacific: Historical Trends (Since 2020) and Forecasted Estimates (Till 2040)
- 19.3.3.1. Electronic Batch Records Market in China: Historical Trends (Since 2020) and Forecasted Estimates (Till 2040)
- 19.3.3.2. Electronic Batch Records Market in India: Historical Trends (Since 2020) and Forecasted Estimates (Till 2040)
- 19.3.3.3. Electronic Batch Records Market for Japan and Rest of Asia-Pacific: Historical Trends (Since 2020) and Forecasted Estimates (Till 2040)
- 19.3.4. Electronic Batch Records Market for Middle East and North Africa: Historical Trends (Since 2020) and Forecasted Estimates (Till 2040)
- 19.3.4.1. Electronic Batch Records Market in Saudi Arabia: Historical Trends (Since 2020) and Forecasted Estimates (Till 2040)
- 19.3.4.2. Electronic Batch Records Market in UAE: Historical Trends (Since 2020) and Forecasted Estimates (Till 2040)
- 19.3.4.3. Electronic Batch Records Market in Egypt: Historical Trends (Since 2020) and Forecasted Estimates (Till 2040)
- 19.3.5. Electronic Batch Records Market for Latin America: Historical Trends (Since 2020) and Forecasted Estimates (Till 2040)
- 19.3.5.1. Electronic Batch Records Market in Brazil: Historical Trends (Since 2020) and Forecasted Estimates (Till 2040)
- 19.3.5.2. Electronic Batch Records Market in Mexico: Historical Trends (Since 2020) and Forecasted Estimates (Till 2040)
- 19.3.5.3. Electronic Batch Records Market in Argentina: Historical Trends (Since 2020) and Forecasted Estimates (Till 2040)
- 19.3.1. Electronic Batch Records Market for North America: Historical Trends (Since 2020) and Forecasted Estimates (Till 2040)
- 19.4. Market Movement Analysis
- 19.5 Penetration-Growth (P-G) Matrix
- 19.6. Data Triangulation and Validation
20. ELECTRONIC BATCH RECORDS SOLUTIONS MARKET, BY LEADING PLAYERS
- 20.1. Chapter Overview
- 20.2. Leading Industry Players
SECTION VII: OTHER INSIGHTS
21. CONCLUDING REMARKS
22. APPENDIX 1: TABULATED DATA
23. APPENDIX 2: LIST OF COMPANIES AND ORGANIZATIONS
List of Tables
- Table 7.1 Electronic Batch Record Solution Providers: Information on Year of Establishment, Company Size and Location of Headquarters
- Table 7.2 Electronic Batch Record Solution Providers: Information on Type of EBR System, Deployment Mode and Purpose of EBR
- Table 7.3 Electronic Batch Record Solution Providers: Information on Key Features and End-user
- Table 9.1 Electronic Batch Record Solution Providers in North America: List of Companies Profiled
- Table 9.2 Datex: Company Overview
- Table 9.3 Electronic Batch Record Solutions Portfolio
- Table 9.4 Datex: Recent Developments and Future Outlook
- Table 9.5 InstantGMP: Company Overview
- Table 9.6 Electronic Batch Record Solutions Portfolio
- Table 9.7 InstantGMP: Recent Developments and Future Outlook
- Table 9.8 Sapio Sciences: Company Overview
- Table 9.9 Electronic Batch Record Solutions Portfolio
- Table 9.10 Sapio Sciences: Recent Developments and Future Outlook
- Table 9.11 Thermo Fisher Scientific: Company Overview
- Table 9.12 Electronic Batch Record Solutions Portfolio
- Table 9.13 Thermo Fisher Scientific: Recent Developments and Future Outlook
- Table 9.14 Tulip Interfaces: Company Overview
- Table 9.15 Electronic Batch Record Solutions Portfolio
- Table 9.16 Tulip Interfaces: Recent Developments and Future Outlook
- Table 10.1 Electronic Batch Record Solution Providers in Europe: List of Companies Profiled
- Table 10.2 ABB: Company Overview
- Table 10.3 Electronic Batch Record Solutions Portfolio
- Table 10.4 ABB: Recent Developments and Future Outlook
- Table 10.5 Ant Solutions: Company Overview
- Table 10.6 Electronic Batch Record Solutions Portfolio
- Table 10.7 Ant Solutions: Recent Developments and Future Outlook
- Table 10.8 Korber: Company Overview
- Table 10.9 Electronic Batch Record Solutions Portfolio
- Table 10.10 Korber: Recent Developments and Future Outlook
- Table 10.11 Siemens: Company Overview
- Table 10.12 Electronic Batch Record Solutions Portfolio
- Table 10.13 Siemens: Recent Developments and Future Outlook
- Table 10.14 Solulever: Company Overview
- Table 10.15 Electronic Batch Record Solutions Portfolio
- Table 11.1 Electronic Batch Record Solution Providers in Asia-Pacific and Rest of the World: List of Companies Profiled
- Table 11.2 AmpleLogic: Company Overview
- Table 11.3 Electronic Batch Record Solutions Portfolio
- Table 11.4 Ecubix: Company Overview
- Table 11.5 Electronic Batch Record Solutions Portfolio
- Table 11.6 Scigeniq: Company Overview
- Table 11.7 Electronic Batch Record Solutions Portfolio
- Table 11.8 Scigeniq: Recent Developments and Future Outlook
- Table 11.9 Supertech Instrumentation: Company Overview
- Table 11.10 Electronic Batch Record Solutions Portfolio
- Table 11.11 Yokogawa: Company Overview
- Table 11.12 Electronic Batch Record Solutions Portfolio
- Table 12.1 Electronic Batch Record Providers: List of Partnerships and Collaborations, Since 2021
- Table 12.2 Partnerships and Collaborations: Information on Type of Agreement
- Table 13.1 Electronic Batch Records: List of Recent Initiatives
- Table 21.1 Leading Industry Players: Based on Company Competitiveness Analysis
- Table 23.1 Electronic Batch Record Solution Providers: Distribution by Year of Establishment
- Table 23.2 Electronic Batch Record Solution Providers: Distribution by Company Size
- Table 23.3 Electronic Batch Record Solution Providers: Distribution by Location of Headquarters (Region-wise)
- Table 23.4 Electronic Batch Record Solution Providers: Distribution by Type of Electronic Batch Record System
- Table 23.5 Electronic Batch Record Solution Providers: Distribution by Deployment Mode
- Table 23.6 Electronic Batch Record Solution Providers: Distribution by Purpose of Electronic Batch Record
- Table 23.7 Electronic Batch Record Solution Providers: Distribution by Key Feature
- Table 23.8 Electronic Batch Record Solution Providers: Distribution by End-users
- Table 23.9 Thermo Fisher Scientific: Annual Revenues, Since FY 2021 (USD Billion)
- Table 23.10 ABB: Annual Revenues, Since FY 2021 (EUR Billion)
- Table 23.11 Korber: Annual Revenues, Since FY 2021 (EUR Billion)
- Table 23.12 Siemens: Annual Revenues, Since FY 2021 (EUR Billion)
- Table 23.13 Yokogawa: Annual Revenues, Since FY 2021 (YEN Billion)
- Table 23.14 Partnerships and Collaborations: Distribution by Cumulative Year-wise Trend, Since 2021
- Table 23.15 Partnerships and Collaborations: Distribution by Type of Partnership
- Table 23.16 Partnerships and Collaborations: Distribution by Year and Type of Partnership, Since 2021
- Table 23.17 Partnerships and Collaborations: Distribution by Type of Partner
- Table 23.18 Partnerships and Collaborations: Distribution by Purpose of Electronic Batch Record
- Table 23.19 Partnerships and Collaborations: Distribution by End-users
- Table 23.20 Most Active Players: Distribution by Number of Partnership
- Table 23.21 Partnerships and Collaborations: Distribution by Country
- Table 23.22 Partnerships and Collaborations: Distribution by Region
- Table 23.23 Recent Initiatives: Cumulative Year-wise Trend, Since 2021
- Table 23.24 Recent Initiatives: Distribution by Type of Initiative
- Table 23.25 Recent Initiatives: Distribution by Year and Type of Initiative
- Table 23.26 Recent Initiatives: Distribution by Purpose of Electronic Batch Record
- Table 23.27 Recent Initiatives: Distribution by Key Features
- Table 23.28 Recent Initiatives: Distribution by End-user
- Table 23.29 Most Active Players: Distribution by Number of Recent Initiatives
- Table 23.30 Recent Initiatives: Distribution by Geography
- Table 23.31 Global Electronic Batch Records Market: Historical Trends (Since 2020) and Forecasted Estimates (Till 2040) (USD Billion)
- Table 23.32 Global Electronic Batch Records Market, Forecasted Estimates (Till 2040): Conservative Scenario (USD Billion)
- Table 23.33 Global Electronic Batch Records Market, Forecasted Estimates (Till 2040): Optimistic Scenario (USD Billion)
- Table 23.34 Electronic Batch Records Market: Distribution by Type of Electronic Batch Record System, 2020, 2025 and 2040
- Table 23.35 Electronic Batch Records Market for Integrated Systems: Historical Trends (Since 2020) and Forecasted Estimates (Till 2040), Conservative, Base and Optimistic Scenarios (USD Billion)
- Table 23.36 Electronic Batch Records Market for Standalone Systems: Historical Trends (Since 2020) and Forecasted Estimates (Till 2040), Conservative, Base and Optimistic Scenarios (USD Billion)
- Table 23.37 Electronic Batch Records Market: Distribution by Deployment Mode, 2020, 2025 and 2040
- Table 23.38 Electronic Batch Records Market for Web-Based / Cloud-Based Deployment Mode: Historical Trends (Since 2020) and Forecasted Estimates (Till 2040), Conservative, Base and Optimistic Scenarios (USD Billion)
- Table 23.39 Electronic Batch Records Market for On-Premises Deployment Mode: Historical Trends (Since 2020) and Forecasted Estimates (Till 2040), Conservative, Base and Optimistic Scenarios (USD Billion)
- Table 23.40 Electronic Batch Records Market: Distribution by Purpose of Electronic Batch Record Systems, 2020, 2025 and 2040
- Table 23.41 Electronic Batch Records Market for Quality Management: Historical Trends (Since 2020) and Forecasted Estimates (Till 2040), Conservative, Base and Optimistic Scenarios (USD Billion)
- Table 23.42 Electronic Batch Records Market for Process Improvement / Process Management: Historical Trends (Since 2020) and Forecasted Estimates (Till 2040), Conservative, Base and Optimistic Scenarios (USD Billion)
- Table 23.43 Electronic Batch Records Market for Batch Management: Historical Trends (Since 2020) and Forecasted Estimates (Till 2040), Conservative, Base and Optimistic Scenarios (USD Billion)
- Table 23.44 Electronic Batch Records Market: Distribution by Key Geographical Regions, 2020, 2025 and 2040
- Table 23.45 Electronic Batch Records Market in North America: Historical Trends (Since 2020) and Forecasted Estimates (Till 2040), Conservative, Base and Optimistic Scenarios (USD Billion)
- Table 23.46 Electronic Batch Records Market in the US: Historical Trends (Since 2020) and Forecasted Estimates (Till 2040), Conservative, Base and Optimistic Scenarios (USD Billion)
- Table 23.47 Electronic Batch Records Market in Canada: Historical Trends (Since 2020) and Forecasted Estimates (Till 2040), Conservative, Base and Optimistic Scenarios (USD Billion)
- Table 23.48 Electronic Batch Records Market in Europe: Historical Trends (Since 2020) and Forecasted Estimates (Till 2040) (USD Billion), Conservative, Base and Optimistic Scenarios (USD Billion)
- Table 23.49 Electronic Batch Records Market in Germany: Historical Trends (Since 2020) and Forecasted Estimates (Till 2040), Conservative, Base and Optimistic Scenarios (USD Billion)
- Table 23.50 Electronic Batch Records Market in the UK: Historical Trends (Since 2020) and Forecasted Estimates (Till 2040), Conservative, Base and Optimistic Scenarios (USD Billion)
- Table 23.51 Electronic Batch Records Market in France: Historical Trends (Since 2020) and Forecasted Estimates (Till 2040), Conservative, Base and Optimistic Scenarios (USD Billion)
- Table 23.52 Electronic Batch Records Market in Italy: Historical Trends (Since 2020) and Forecasted Estimates (Till 2040), Conservative, Base and Optimistic Scenarios (USD Billion)
- Table 23.53 Electronic Batch Records Market in Spain: Historical Trends (Since 2020) and Forecasted Estimates (Till 2040), Conservative, Base and Optimistic Scenarios (USD Billion)
- Table 23.54 Electronic Batch Records Market in Rest of Europe: Historical Trends (Since 2020) and Forecasted Estimates (Till 2040), Conservative, Base and Optimistic Scenarios (USD Billion)
- Table 23.55 Electronic Batch Records Market in Asia-Pacific: Historical Trends (Since 2020) and Forecasted Estimates (Till 2040), Conservative, Base and Optimistic Scenarios (USD Billion)
- Table 23.56 Electronic Batch Records Market in China: Historical Trends (Since 2020) and Forecasted Estimates (Till 2040), Conservative, Base and Optimistic Scenarios (USD Billion)
- Table 23.57 Electronic Batch Records Market in India: Historical Trends (Since 2020) and Forecasted Estimates (Till 2040), Conservative, Base and Optimistic Scenarios (USD Billion)
- Table 23.58 Electronic Batch Records Market in Japan and Rest of Asia-Pacific: Historical Trends (Since 2020) and Forecasted Estimates (Till 2040), Conservative, Base and Optimistic Scenarios (USD Billion)
- Table 23.59 Electronic Batch Records Market in Middle East and North Africa: Historical Trends (Since 2020) and Forecasted Estimates (Till 2040), Conservative, Base and Optimistic Scenarios (USD Billion)
- Table 23.60 Electronic Batch Records Market in Saudi Arabia: Historical Trends (Since 2020) and Forecasted Estimates (Till 2040), Conservative, Base and Optimistic Scenarios (USD Billion)
- Table 23.61 Electronic Batch Records Market in UAE: Historical Trends (Since 2020) and Forecasted Estimates (Till 2040), Conservative, Base and Optimistic Scenarios (USD Billion)
- Table 23.62 Electronic Batch Records Market in Egypt: Historical Trends (Since 2020) and Forecasted Estimates (Till 2040), Conservative, Base and Optimistic Scenarios (USD Billion)
- Table 23.63 Electronic Batch Records Market in Latin America: Historical Trends (Since 2020) and Forecasted Estimates (Till 2040), Conservative, Base and Optimistic Scenarios (USD Billion)
- Table 23.64 Electronic Batch Records Market in Brazil: Historical Trends (Since 2020) and Forecasted Estimates (Till 2040), Conservative, Base and Optimistic Scenarios (USD Billion)
- Table 23.65 Electronic Batch Records Market in Mexico: Historical Trends (Since 2020) and Forecasted Estimates (Till 2040), Conservative, Base and Optimistic Scenarios (USD Billion)
- Table 23.66 Electronic Batch Records Market in Argentina: Historical Trends (Since 2020) and Forecasted Estimates (Till 2040), Conservative, Base and Optimistic Scenarios (USD Billion)
List of Figures
- Figure 2.1 Research Methodology: Project Methodology
- Figure 2.2 Research Methodology: Data Sources for Secondary Research
- Figure 2.3 Research Methodology: Robust Quality Control
- Figure 3.1 Market Dynamics: Forecast Methodology
- Figure 3.2 Market Dynamics: Market Assessment Framework
- Figure 4.1 Lessons Learnt from Past Recessions
- Figure 5.1 Executive Summary: Market Landscape
- Figure 5.2 Executive Summary: Recent Initiatives
- Figure 5.3 Executive Summary: Market Forecast and Opportunity Analysis
- Figure 6.1 Types of Batch Records
- Figure 6.2 Features of Electronic Batch Records
- Figure 6.3 Advantages of Electronic Batch Records
- Figure 7.1 Electronic Batch Record Solution Providers: Distribution by Year of Establishment
- Figure 7.2 Electronic Batch Record Solution Providers: Distribution by Company Size
- Figure 7.3 Electronic Batch Record Solution Providers: Distribution by Location of Headquarters
- Figure 7.4 Electronic Batch Record Solution Providers: Distribution by Type of Electronic Batch Record System
- Figure 7.5 Electronic Batch Record Solution Providers: Distribution by Deployment Mode
- Figure 7.6 Electronic Batch Record Solution Providers: Distribution by Purpose of Electronic Batch Record
- Figure 7.7 Electronic Batch Record Solution Providers: Distribution by Key Features
- Figure 7.8 Electronic Batch Record Solution Providers: Distribution by End-user
- Figure 8.1 Company Competitiveness Analysis: Overview of Peer Group I
- Figure 8.2 Company Competitiveness Analysis: Overview of Peer Group II
- Figure 8.3 Company Competitiveness Analysis: Overview of Peer Group III
- Figure 8.4 Company Competitiveness Analysis: Electronic Batch Record Solution Providers based in North America
- Figure 8.5 Company Competitiveness Analysis: Electronic Batch Record Solution Providers based in Europe
- Figure 8.6 Company Competitiveness Analysis: Electronic Batch Record Solution Providers based in Asia-Pacific and Rest of the World
- Figure 9.1 Thermo Fisher Scientific: Annual Revenues, FY 2021 onwards (USD Billion)
- Figure 10.1 ABB: Annual Revenues, FY 2021 onwards (EUR Billion)
- Figure 10.2 Korber: Annual Revenues, FY 2021 onwards (EUR Billion)
- Figure 10.3 Siemens: Annual Revenues, FY 2021 onwards (EUR Billion)
- Figure 11.1 Yokogawa: Annual Revenues, FY 2021 onwards (YEN Billion)
- Figure 12.1 Partnerships and Collaborations: Cumulative Year-wise Trend, Since 2021
- Figure 12.2 Partnerships and Collaborations: Distribution by Type of Partnership
- Figure 12.3 Partnerships and Collaborations: Distribution by Year and Type of Partnership, Since 2021
- Figure 12.4 Partnerships and Collaborations: Distribution by Type of Partner
- Figure 12.5 Partnerships and Collaborations: Distribution by Purpose of Electronic Batch Record
- Figure 12.6 Partnerships and Collaborations: Distribution by End-user
- Figure 12.7 Most Active Players: Distribution by Number of Partnerships
- Figure 12.8 Partnerships and Collaborations: Distribution by Country
- Figure 12.9 Partnerships and Collaborations: Distribution by Region
- Figure 13.1 Recent Initiatives: Cumulative Year-wise Trend, Since 2021
- Figure 13.2 Recent Initiatives: Distribution by Type of Initiative
- Figure 13.3 Recent Initiatives: Distribution by Year and Type of Initiative, Since 2021
- Figure 13.4 Recent Initiatives: Distribution by Purpose of Electronic Batch Record
- Figure 13.5 Recent Initiatives: Distribution by Key Features
- Figure 13.6 Recent Initiatives: Distribution by End-user
- Figure 13.7 Most Active Players: Distribution by Number of Recent Initiatives
- Figure 13.8 Recent Initiatives: Distribution by Geography
- Figure 15.1 Global Electronic Batch Records Market: Historical Trends (Since 2020) and Forecasted Estimates (Till 2040) (USD Billion)
- Figure 15.2 Global Electronic Batch Records Market, Forecasted Estimate (Till 2040): Conservative Scenario (USD Billion)
- Figure 15.3 Global Electronic Batch Records Market, Forecasted Estimate (Till 2040): Optimistic Scenario (USD Billion)
- Figure 16.1 Electronic Batch Records Market: Distribution by Type of Electronic Batch Record System
- Figure 16.2 Electronic Batch Records Market for Integrated Systems: Historical Trends (Since 2020) and Forecasted Estimates (Till 2040) (USD Billion)
- Figure 16.3 Electronic Batch Records Market for Standalone Systems: Historical Trends (Since 2020) and Forecasted Estimates (Till 2040) (USD Billion)
- Figure 17.1 Electronic Batch Records Market: Distribution by Type of Deployment Mode
- Figure 17.2 Electronic Batch Records Market for Web-based / Cloud-based Deployment Mode: Historical Trends (Since 2020) and Forecasted Estimates (Till 2040) (USD Billion)
- Figure 17.3 Electronic Batch Records Market for On-Premises Deployment Mode: Historical Trends (Since 2020) and Forecasted Estimates (Till 2040) (USD Billion)
- Figure 17.4 Penetration-Growth (P-G) Matrix: Deployment Mode
- Figure 18.1 Electronic Batch Records Market: Distribution by Purpose of Electronic Batch Record
- Figure 18.2 Electronic Batch Records Market for Quality Management: Historical Trends (Since 2020) and Forecasted Estimates (Till 2040) (USD Billion)
- Figure 18.3 Electronic Batch Records Market for Process Improvement / Process Management: Historical Trends (Since 2020) and Forecasted Estimates (Till 2040) (USD Billion)
- Figure 18.4 Electronic Batch Records Market for Batch Management: Historical Trends (Since 2020) and Forecasted Estimates (Till 2040) (USD Billion)
- Figure 19.1 Electronic Batch Records Market: Distribution by Geographical Region
- Figure 19.2 Electronic Batch Records Market for North America: Historical Trends (Since 2020) and Forecasted Estimates (Till 2040) (USD Billion)
- Figure 19.3 Electronic Batch Records Market in the US: Historical Trends (Since 2020) and Forecasted Estimates (Till 2040) (USD Billion)
- Figure 19.4 Electronic Batch Records Market in Canada: Historical Trends (Since 2020) and Forecasted Estimates (Till 2040) (USD Billion)
- Figure 19.5 Electronic Batch Records Market for Europe: Historical Trends (Since 2020) and Forecasted Estimates (Till 2040) (USD Billion) (USD Billion)
- Figure 19.6 Electronic Batch Records Market in Germany: Historical Trends (Since 2020) and Forecasted Estimates (Till 2040) (USD Billion)
- Figure 19.7 Electronic Batch Records Market in the UK: Historical Trends (Since 2020) and Forecasted Estimates (Till 2040) (USD Billion)
- Figure 19.8 Electronic Batch Records Market in France: Historical Trends (Since 2020) and Forecasted Estimates (Till 2040) (USD Billion)
- Figure 19.9 Electronic Batch Records Market in Italy: Historical Trends (Since 2020) and Forecasted Estimates (Till 2040) (USD Billion)
- Figure 19.1 Electronic Batch Records Market in Spain: Historical Trends (Since 2020) and Forecasted Estimates (Till 2040) (USD Billion)
- Figure 19.11 Electronic Batch Records Market for Rest of Europe: Historical Trends (Since 2020) and Forecasted Estimates (Till 2040) (USD Billion)
- Figure 19.12 Electronic Batch Records Market for Asia-Pacific: Historical Trends (Since 2020) and Forecasted Estimates (Till 2040) (USD Billion)
- Figure 19.13 Electronic Batch Records Market in China: Historical Trends (Since 2020) and Forecasted Estimates (Till 2040) (USD Billion)
- Figure 19.14 Electronic Batch Records Market in India: Historical Trends (Since 2020) and Forecasted Estimates (Till 2040) (USD Billion)
- Figure 19.15 Electronic Batch Records Market for Japan and Rest of Asia-Pacific: Historical Trends (Since 2020) and Forecasted Estimates (Till 2040) (USD Billion)
- Figure 19.16 Electronic Batch Records Market for Middle East and North Africa: Historical Trends (Since 2020) and Forecasted Estimates (Till 2040) (USD Billion)
- Figure 19.17 Electronic Batch Records Market in Saudi Arabia: Historical Trends (Since 2020) and Forecasted Estimates (Till 2040) (USD Billion)
- Figure 19.18 Electronic Batch Records Market in UAE: Historical Trends (Since 2020) and Forecasted Estimates (Till 2040) (USD Billion)
- Figure 19.19 Electronic Batch Records Market in Egypt: Historical Trends (Since 2020) and Forecasted Estimates (Till 2040) (USD Billion)
- Figure 19.2 Electronic Batch Records Market for Latin America: Historical Trends (Since 2020) and Forecasted Estimates (Till 2040) (USD Billion)
- Figure 19.21 Electronic Batch Records Market in Brazil: Historical Trends (Since 2020) and Forecasted Estimates (Till 2040) (USD Billion)
- Figure 19.22 Electronic Batch Records Market in Mexico: Historical Trends (Since 2020) and Forecasted Estimates (Till 2040) (USD Billion)
- Figure 19.23 Electronic Batch Records Market in Argentina: Historical Trends (Since 2020) and Forecasted Estimates (Till 2040) (USD Billion)
- Figure 19.24 Market Movement Analysis
- Figure 19.25 Penetration-Growth (P-G) Matrix: Geographical Region
- Figure 21.1 Concluding Remarks: Market Landscape
- Figure 21.2 Concluding Remarks: Partnerships and Collaborations
- Figure 21.3 Concluding Remarks: Recent Initiatives
- Figure 21.4 Concluding Remarks: Market Forecast and Opportunity Analysis