


 |
市场调查报告书
商品编码
1821504
肿瘤学的AI市场:2035年前的产业趋势和全球预测 - 各癌症类型,各终端用户类型,各地区AI in Oncology Market: Industry Trends and Global Forecasts, Till 2035 - Distribution by Type of Cancer, Type of End User, Geographical Regions |
||||||
肿瘤学人工智慧市场:概览
预计到2035年,肿瘤学人工智慧市场规模将从目前的24亿美元增长至91亿美元,预测期内的复合年增长率为14.1%。
市场区隔与机会分析依下列参数进行:
各癌症类型
- 固态恶性肿瘤
- 乳癌
- 肺癌症
- 前列腺癌症
- 大肠癌症
- 脑瘤
- 其他
各终端用户类型
- 医院
- 製药公司
- 研究机关
- 其他
各地区
- 北美
- 欧洲
- 亚太地区
- 其他地区
肿瘤学人工智慧市场:成长与趋势
人工智慧在製药业被广泛用于资料收集、评估和即时解读。事实上,基于人工智慧的软体解决方案的整合使临床医生能够及早发现癌症,并开发个人化疗法来治疗各种肿瘤适应症。此外,肿瘤学领域的人工智慧技术显着降低了癌症检测和治疗的成本。在人工智慧技术前景的驱动下,专家认为,人工智慧在肿瘤学领域的应用具有巨大的未来创收潜力。
全球癌症风险的上升显着增加了对先进癌症诊断和治疗方法的需求。众所周知,癌症是全球主要的死亡原因。此外,国际癌症研究机构预测,到2030年,癌症相关死亡人数可能会增加72%。因此,技术创新和不断上升的癌症发病率等市场驱动因素正在推动肿瘤人工智慧市场的变革性成长。然而,克服监管障碍和资料隐私等挑战对于在未来几年充分发挥其潜力仍然至关重要。
肿瘤人工智慧市场关键洞察
本报告深入探讨了肿瘤人工智慧市场的现状,并识别了行业内的潜在成长机会。主要发现包括:
- 目前的市场格局特点是,有超过70家企业致力于开发基于人工智慧的肿瘤领域软体解决方案。
- 超过 50% 的参与者正在医院中使用基于机器学习的解决方案进行诊断。
- 为了获得竞争优势,产业利害关係人正积极升级现有能力,并强化以人工智慧为中心的服务组合。
- 近期合作活动的增加也证明了人们对该市场的兴趣日益浓厚。
- 许多公共和私人投资者期待丰厚的回报,已投资了相当于 60 亿美元的资金。
- 过去五年,学术界和产业界利益相关者已授予或提交了超过 2,770 项专利,专门用于开发基于人工智慧的肿瘤学软体解决方案。
- 预计未来十年市场将以 14.1% 的健康速度成长,并且不同适应症、分子类型和地理的机会可能非常多样化。
肿瘤AI市场:关键细分市场
依癌症类型划分,全球肿瘤AI市场分为实体恶性肿瘤、乳癌、肺癌、摄护腺癌、大肠癌、脑肿瘤等。预计今年实体恶性肿瘤领域将占大部分市场占有率,这一趋势未来不太可能改变。这一高市场占有率的驱动因素是全球癌症负担的增加,尤其是实体肿瘤,这需要创新、可扩展且精准的工具,从而催生了该领域宝贵的AI应用。
依最终用户类型划分,市场分为医院、製药公司、研究机构和其他。目前,医院领域占肿瘤AI市场的最大占有率。这一趋势在短期内不太可能改变。
依地区划分,全球肿瘤AI市场分为北美、欧洲、亚太地区及其他地区。我们的研究表明,欧洲目前占肿瘤学人工智慧市场的大部分占有率(33%),而且这一趋势在未来不太可能改变。这是人口老化、对先进癌症诊断的需求不断增长以及慢性病管理增加的结果,使得人工智慧解决方案成为一项重要的投资。此外,在预测期(至2035年),亚太市场很可能会以相对较高的复合年增长率(14.7%)成长。这是由于该地区癌症患者数量的增加,推动了对先进诊断和治疗解决方案的需求。
初步研究概述
本研究中提出的观点和见解受到与多位利害关係人讨论的影响。本研究报告包含以下产业参与者的详细访谈记录:
- A公司执行长
- B公司执行长
- C公司执行长
- D公司行销·通讯担当副社长
肿瘤学的AI市场上参与企业案例
- Berg(A part of BPGbio)
- CancerCenter.AI
- Concert AI
- GE Healthcare
- IBM Watson Health
- iCAD
- JLK Inspection
- Median Technologies
- Path AI
- Roche Diagnostics
肿瘤学的AI市场调查对象
- 市场规模和机会分析本报告按关键细分市场对全球肿瘤人工智慧市场进行了全面分析,包括 [A] 抗体类型、[B] 癌症类型、 [C] 最终用户类型和 [D] 地区。
- 市场格局:基于多个相关参数对肿瘤学人工智慧市场中的公司进行深入评估,例如 A] 成立年份、[B] 公司规模、[C] 总部位置、[D] 最终用户类型、[E] 提供的服务类型、[F] 使用的人工智慧技术类型、[G] 平台类型等。
- 竞争分析:对肿瘤学人工智慧解决方案提供者进行全面的竞争分析,考察因素包括 A] 公司实力、[B] 产品组合实力等。
- 公司简介:肿瘤学人工智慧市场中主要服务提供者的详细公司简介,重点关注 A] 公司概况、[B] 财务资讯(如有)、[C] 服务组合以及 [D] 近期发展和未来展望。
- 专利分析:根据各种相关参数,对肿瘤学人工智慧市场迄今提交/授予的专利进行深入分析,例如 A] 专利出版年份、[B] 专利类型、[C] 专利管辖区、[D] CPC 符号、[F] 申请人类型、[G] 管辖区、[H] 主要参与者、[i] 估值分析和 [J] 专利。
- 合作关係与分析:根据多个参数,对肿瘤学人工智慧市场利益相关者达成的交易进行深入分析,例如:A) 合作年份、B) 合作类型、C) 癌症类型、D) 最活跃的参与者(合作伙伴关係数量)、E) 合作活动的区域分布。
- 资金与投资分析:基于相关参数对人工智慧药物研发公司筹集的资金进行深入分析,例如:A) 融资年份,B) 投资金额(按年份),C) 融资类型,D) 投资金额(按公司规模),E) 投资者类型,F) 投资金额(按投资者类型),G) 最活跃的参与者,H) 最活跃的投资者,I) 区域分析。
- 蓝海分析:基于各种框架对参与者进行评估,例如:A) 价值创新,B) 战略画布,C) 四大行动框架,D) ERRC 网格,E) 六条路径框架,F) 先驱者-迁移者-定居者 (PMS) 地图,G) 三层非客户,F) 蓝海买方战略序列,F) 效用效用。
目录
第1章 序文
第2章 摘要整理
第3章 简介
- 章概要
- 人工智能概要
- 人工智能的种类
- 医疗保健的AI
- 医疗保健中人工智慧的主要课题
- 未来展望
第4章 市场概要
- 章概要
- 肿瘤学的AI:软体供应商的市场形势
- 肿瘤学的AI:软体解决方案的市场形势
第5章 企业简介
- 章概要
- Roche Diagnostics
- IBM Watson Health
- CancerCenter.AI
- GE Healthcare
- Concert AI
- Path AI
- Berg
- Median Technologies
- iCAD
- JLK Inspection
第6章 企业的竞争力分析
- 章概要
- 前提主要的参数
- 调查手法
- 企业的竞争力:北美的中小企业
- 企业的竞争力:欧洲的中小企业
- 企业的竞争力:亚太地区的中小企业
- 企业的竞争力:北美中规模企业
- 企业的竞争力:欧洲中规模企业
- 企业的竞争力:亚太地区中规模企业
- 企业的竞争力:北美和欧洲的大企业
第7章 专利分析
- 章概要
- 与范围调查手法
- 肿瘤学的AI:专利分析
- 肿瘤学的AI:专利基准分析
第8章 伙伴关係和合作
- 章概要
- 伙伴关係模式
- 肿瘤学的AI:最近的伙伴关係和合作
第9章 资金筹措投资分析
- 章概要
- 资金筹措模式的种类
- 肿瘤学的AI:资金筹措和投资分析的清单
- 投资摘要
- 结论
第10章 蓝海策略:新创企业进入竞争市场的策略指南
- 章概要
- 青·海洋策略概要
- 结论
第11章 市场规模的评估机会分析
- 章概要
- 与主要的前提调查手法
- 肿瘤学的人工智能的全球市场,2022年~2035年
- 肿瘤学市场上人工智能:各癌症类型分析,2022年~2035年
- 肿瘤学市场上人工智能:各终端用户类型分析,2022年~2035年
- 肿瘤学市场上人工智能:各主要地区分析,2022年~2035年
第12章 结论
第13章 执行洞察
第14章 附录1:表格形式资料
第15章 附录2:企业·团体一览
Ai in Oncology Market: Overview
The AI in oncology market is estimated to grow from USD 2.4 billion in the current year to USD 9.1 billion by 2035, representing a higher CAGR of 14.1% during the forecast period.
The market sizing and opportunity analysis has been segmented across the following parameters:
Type of Cancer
- Solid Malignancies
- Breast cancer
- Lung cancer
- Prostate cancer
- Colorectal cancer
- Brain tumor
- Others
Type of End User
- Hospitals
- Pharmaceutical Companies
- Research Institutes
- Others
Geographical Regions
- North America
- Europe
- Asia-Pacific
- Rest of the World
Ai in Oncology Market: Growth and Trends
AI has been immensely utilized for data collection, evaluation, and real-time interpretation in the pharmaceutical industry. In fact, the integration of AI-based software solutions enables clinicians to detect cancer at an early stage and develop personalized therapies to treat a wide range of oncological indications. Additionally, AI-powered technology in oncology significantly reduces the cost of cancer testing and treatment. Driven by the significance offered by AI technology, experts believe that the use of AI in oncology market has enormous potential to generate revenue in the future.
Due to the rise in cancer risk across the globe, there has been a significant rise in the demand for advanced cancer diagnostic and treatment methods to treat patients. It is a widely known fact that cancer is the leading cause of deaths worldwide. Further, International Agency for Cancer Research suggests that the number of cancer-associated deaths is likely to increase by 72%, by 2030. Therefore, drivers such as technological innovation and rising cancer incidence position the AI in oncology market for transformative growth. However, overcoming challenges such as regulatory hurdles and data privacy would remain critical in realizing its full potential in the coming years.
Ai in Oncology Market: Key Insights
The report delves into the current state of the AI in oncology market and identifies potential growth opportunities within industry. Some key findings from the report include:
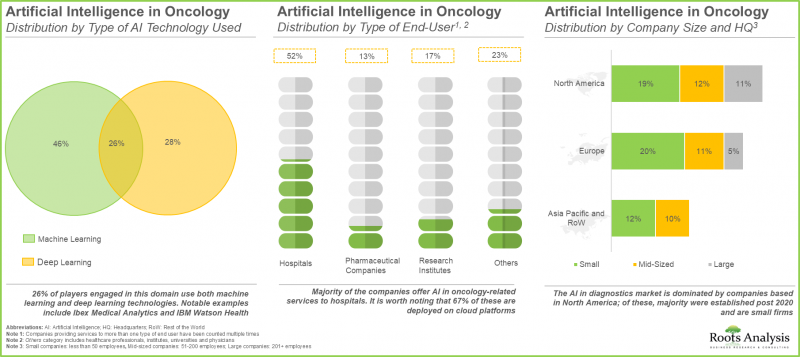
- The current market landscape features the presence of over 70 players engaged in the development of AI-based software solutions for the oncology sector.
- Over 50% of the players use their machine learning powered solutions for diagnostic purposes in hospitals; geographically, the software providers are well distributed.
- In pursuit of gaining a competitive edge, industry stakeholders are actively upgrading their existing capabilities and enhancing their AI-focused service portfolios.
- The growing interest in this market is prevalent from the recent rise in partnership activity; ~50% of the deals were inked to enable utilization and integration of proprietary AI-based technology solutions
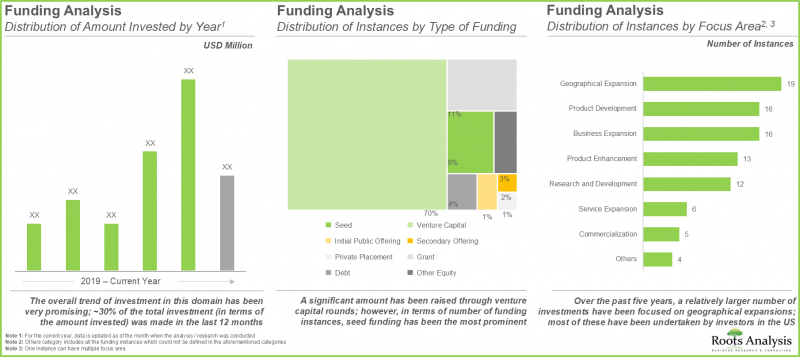
- Foreseeing lucrative returns, many public and private investors have made investments worth ~USD 6 billion; 70% of the funding initiatives were led by venture capitalists.
- Over 2,770 patents have been granted / filed by academic and industry stakeholders in the last five years, exclusively for the development of AI-based software solutions for oncology.
- The market is expected to witness a healthy growth of 14.1% in the coming decade; the opportunity is likely to be well distributed across various target indications, types of molecules and different regions.
Ai in Oncology Market: Key Segments
Solid Malignancies Holds the Largest Share
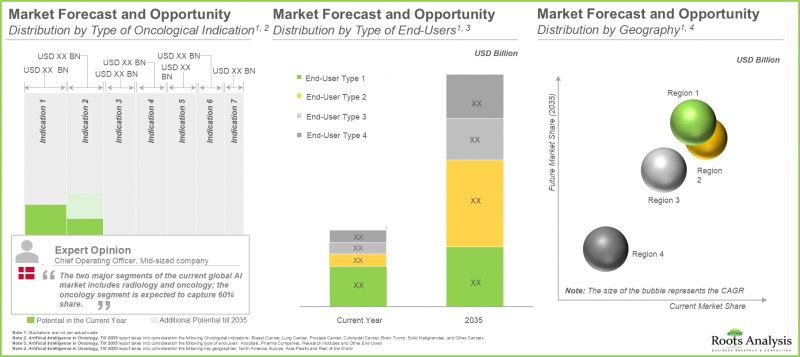
Based on the type of cancer, the global AI in oncology market is segmented across type of cancer, such as solid malignancies, breast cancer, lung cancer, prostate cancer, colorectal cancer, brain tumor and others. The solid malignancies segment is likely to capture the majority of the market share in the current year, and this trend is unlikely to change in the future. The high market share can be attributed to the increased global cancer burden, particularly in solid tumors, which has necessitated innovative, scalable, and precise tools, thus creating valuable AI applications valuable in this sector.
Currently, Hospitals Segment Occupies the Largest Share of the AI in Oncology Market
Based on the type of end-user, the market is segmented into hospitals, pharmaceutical companies, research institutes and others. In the current year, the hospital segment holds the maximum share of AI in oncology market. This trend is unlikely to change in the near future.
Asia-Pacific to Propel in the AI in Oncology Sector in the Coming Years
Based on the geographical regions, the global AI in oncology market is segmented across North America, Europe and Asia-Pacific and rest of the world. Our research suggests that Europe captures the majority (33%) of AI in oncology market share in the current year and this trend is unlikely to change in the future. This is a result of the ageing population, rise in the need for advanced cancer diagnostics and chronic disease management areas, wherein AI solutions provide substantial investments. Further, the market in Asia-Pacific is likely to grow at a relatively high CAGR (14.7%), during the forecast period till 2035. This is attributed to the increase in the number of cancer cases in the region, driving demand for advanced diagnostic and treatment solutions.
Primary Research Overview
The opinions and insights presented in this study were influenced by discussions conducted with multiple stakeholders. The research report features detailed transcripts of interviews held with the following industry stakeholders:
- Chief Executive Officer, Company A
- Chief Executive Officer, Company B
- Chief Executive Officer, Company C
- Vice President, Marketing and Communications, Company D
Example Players in the AI in Oncology Market
- Berg (A part of BPGbio)
- CancerCenter.AI
- Concert AI
- GE Healthcare
- IBM Watson Health
- iCAD
- JLK Inspection
- Median Technologies
- Path AI
- Roche Diagnostics
Ai in Oncology Market: Research Coverage
- Market Sizing and Opportunity Analysis: The report features a thorough analysis of the global AI in oncology market, in terms of the key market segments, including [A] type of antibody manufactured, [B] type of cancer, [C] type of end user and [D] geographical regions.
- Market Landscape: An in-depth assessment of the companies involved in AI in oncology market, based on several relevant parameters, such as [A] year of establishment, [B] company size, [C] location of headquarters, [D] type of end-user, [E] type of services offered, [F] type of AI technology used, and [G] type of platform.
- Company Competitiveness Analysis: A comprehensive competitive analysis of AI in oncology solution providers, examining factors, such as [A] company strength and [B] portfolio strength.
- Company Profiles: Detailed profiles of key service providers engaged in the AI in oncology market, focused on [A] overview of the company, [B] financial information (if available), [C] service portfolio, and [D] recent developments and an informed future outlook.
- Patent Analysis: An in-depth analysis of patents filed / granted till date in the AI in oncology market domain, based on various relevant parameters, such as [A] patent publication year, [B] type of patent, [C] patent jurisdiction, [D] CPC symbols, [F] type of applicant, [G] jurisdiction, [H] leading players, [I] benchmarking analysis and [J] patent valuation.
- Partnerships and Analysis: An insightful analysis of the deals inked by stakeholders in the AI in oncology market, based on several parameters, such as [A] year of partnership, [B] type of partnership,[C] type of cancer, [D] most active players (in terms of the number of partnerships signed) and [E] geographical distribution of partnership activity.
- Funding and Investment Analysis: An in-depth analysis of the fundings raised by AI in drug discovery companies, based on relevant parameters, such as [A] year of funding, [B] amount invested by year, [C] type of funding, [D] amount invested by company size, [E] type of investor, [F] amount invested by type of investor, [G] most active players, [H] most active investors and [I] geographical analysis.
- Blue Ocean Analysis: A strategic guide for start-ups to enter into a highly competitive market, assessing players based on various frameworks, such as [A] value innovation, [B] strategy canvas, [C] four action framework [D] eliminate-raise-reduce-create (ERRC) grid [E] six path framework [F] pioneer-migrator-settler (PMS) map [G] three tiers of noncustomers [F] sequence of blue ocean strategy and [F] buyer utility map.
Key Questions Answered in this Report
- How many companies are currently engaged in this market?
- Which are the leading companies in this market?
- What factors are likely to influence the evolution of this market?
- What is the current and future market size?
- What is the CAGR of this market?
- How is the current and future market opportunity likely to be distributed across key market segments?
Reasons to Buy this Report
- The report provides a comprehensive market analysis, offering detailed revenue projections of the overall market and its specific sub-segments. This information is valuable to both established market leaders and emerging entrants.
- Stakeholders can leverage the report to gain a deeper understanding of the competitive dynamics within the market. By analyzing the competitive landscape, businesses can make informed decisions to optimize their market positioning and develop effective go-to-market strategies.
- The report offers stakeholders a comprehensive overview of the market, including key drivers, barriers, opportunities, and challenges. This information empowers stakeholders to stay abreast of market trends and make data-driven decisions to capitalize on growth prospects.
Additional Benefits
- Complimentary PPT Insights Packs
- Complimentary Excel Data Packs for all Analytical Modules in the Report
- 15% Free Content Customization
- Detailed Report Walkthrough Session with Research Team
- Free Updated report if the report is 6-12 months old or older
TABLE OF CONTENTS
1. PREFACE
- 1.1. Overview
- 1.2. Scope of the Report
- 1.3. Market Segmentation
- 1.4. Research Methodology
- 1.5. Key Questions Answered
- 1.6. Chapter Outlines
2. EXECUTIVE SUMMARY
- 2.1 Chapter Overview
3. INTRODUCTION
- 3.1. Chapter Overview
- 3.2. Overview of Artificial Intelligence
- 3.3. Types Of Artificial Intelligence
- 3.4. AI in Healthcare
- 3.5. Key Challenges Associated with Use of AI in Healthcare Sector
- 3.6. Future Perspectives
4. MARKET OVERVIEW
- 4.1. Chapter Overview
- 4.2. AI in Oncology: Market Landscape of Software providers
- 4.2.1. Analysis by Year of Establishment
- 4.2.2. Analysis by Company Size
- 4.2.3. Analysis by Location of Headquarters (Region-wise)
- 4.2.4. Analysis by Location of Headquarters (Country-wise)
- 4.2.5. Analysis by Type of End-User
- 4.2.6. Analysis by Year of Establishment, Company size and Location of Headquarters
- 4.3. AI in Oncology: Market Landscape of Software Solutions
- 4.3.1. Analysis by Type of Service(s) Offered
- 4.3.2. Analysis by Type of AI Technology Used
- 4.3.3. Analysis by Type of Platform
- 4.3.4. Analysis by Type of Service(s) Offered and Type of End-User
- 4.3.5. Analysis by Type of Platform and Type of AI Technology Used
- 4.3.6. Analysis by Type of Service(s) Offered, Location of Headquarters and Type of AI Technology Used
5. COMPANY PROFILES
- 5.1. Chapter Overview
- 5.2. Roche Diagnostics
- 5.2.1. Company Overview
- 5.2.2. Financial Information
- 5.2.3. Service Portfolio
- 5.2.4. Recent Developments and Future Outlook
- 5.3. IBM Watson Health
- 5.3.1. Company Overview
- 5.3.2. Financial Information
- 5.3.3. Service Portfolio
- 5.3.4. Recent Developments and Future Outlook
- 5.4. CancerCenter.AI
- 5.4.1. Company Overview
- 5.4.2. Service Portfolio
- 5.4.3. Recent Development and Future Outlooks
- 5.5. GE Healthcare
- 5.5.1. Company Overview
- 5.5.2. Financial Information
- 5.5.3. Service Portfolio
- 5.5.4. Recent Development and Future Outlook
- 5.6. Concert AI
- 5.6.1. Company Overview
- 5.6.2. Service Portfolio
- 5.6.3. Recent Developments and Future Outlook
- 5.7. Path AI
- 5.7.1. Company Overview
- 5.7.2. Service portfolio
- 5.7.3. Recent Development and Future Outlook
- 5.8. Berg
- 5.8.1. Company Overview
- 5.8.2. Service Portfolio
- 5.8.3. Recent Development and Future Outlook
- 5.9. Median Technologies
- 5.9.1. Company Overview
- 5.9.2. Financial Information
- 5.9.3. Service Portfolio
- 5.9.4. Recent Development and Future Outlook
- 5.10. iCAD
- 5.10.1. Company Overview
- 5.10.2. Financial Information
- 5.10.3. Service Portfolio
- 5.10.4. Recent Developments and Future Outlook
- 5.11. JLK Inspection
- 5.11.1. Company Overview
- 5.11.2. Service Portfolio
- 5.11.3. Recent Development and Future Outlook
6. COMPANY COMPETITIVENESS ANALYSIS
- 6.1. Chapter Overview
- 6.2. Assumptions and Key Parameters
- 6.3. Methodology
- 6.3.1. Company Competitiveness: Small Companies in North America
- 6.3.2. Company Competitiveness: Small Companies in Europe
- 6.3.3. Company Competitiveness: Small Companies in Asia Pacific
- 6.3.4. Company Competitiveness: Mid-sized companies in North America
- 6.3.5. Company Competitiveness: Mid-sized companies in Europe
- 6.3.6. Company Competitiveness: Mid-sized companies in Asia Pacific
- 6.3.7. Company Competitiveness: Large companies in North America and Europe
7. PATENT ANALYSIS
- 7.1. Chapter Overview
- 7.2. Scope and Methodology
- 7.3. AI in Oncology: Patent Analysis
- 7.3.1. Analysis by Type of Patent
- 7.3.2. Analysis by Patent Publication Year
- 7.3.3. Analysis by Year-wise Trend of Filed Patent Applications and Granted Patents
- 7.3.4. Analysis by Jurisdiction
- 7.3.5. Analysis by Type of Industry
- 7.3.6. Analysis by Patent Age
- 7.3.7. Analysis by Legal Status
- 7.3.8. Analysis by CPC Symbols
- 7.3.9. Most Active Players: Analysis by Number of Patents
- 7.3.10. Analysis by Key Inventors
- 7.4. AI in Oncology: Patent Benchmarking Analysis
- 7.4.1. Analysis by Patent Characteristics
- 7.4.2. AI in Oncology: Patent Valuation Analysis
8. PARTNERSHIPS AND COLLABORATIONS
- 8.1. Chapter Overview
- 8.2. Partnership Models
- 8.3 AI in Oncology: Recent Partnerships and Collaborations
- 8.3.1. Analysis by Year of Partnership
- 8.3.2. Analysis by Type of Partnership
- 8.3.3. Analysis by Year and Type of Partnership
- 8.3.4. Analysis by Company Size and Type of Partnership
- 8.3.5. Most Active Partners: Analysis by Number of Partnerships
- 8.3.6. Most Active Players: Analysis by Type of Partnership
- 8.3.7. Analysis by Type of Cancer
- 8.3.8. Analysis by Type of Partner
- 8.3.9. Analysis by Year and Type of Partner
- 8.3.10. Intercontinental and Intracontinental Agreements
- 8.3.11. Local and International Agreements
- 8.3.12. Country-Wise Distribution
- 8.3.13. Analysis by Region
9. FUNDING AND INVESTMENT ANALYSIS
- 9.1. Chapter Overview
- 9.2. Types of Funding Models
- 9.3. AI in Oncology: List of Funding and Investment Analysis
- 9.3.1. Analysis by Year and Number of Funding Instances
- 9.3.2. Analysis by Year and Amount Invested
- 9.3.3 Analysis by Type of Funding and Number of Instances
- 9.3.4. Analysis by Year, Type of Funding and Amount Invested
- 9.3.5. Analysis by Type of Funding and Amount Invested
- 9.3.6. Analysis by Area of Application
- 9.3.7. Analysis by Focus Area
- 9.3.8. Analysis by Type of Cancer Indication
- 9.3.9. Analysis by Geography
- 9.3.10. Most Active Players by Number of Instances
- 9.3.11. Most Active Players by Amount Invested
- 9.3.12. Analysis by Type of Investors
- 9.3.13. Analysis by Lead Investors
- 9.4. Summary of Investments
- 9.5. Concluding Remarks
10. BLUE OCEAN STRATEGY: A STRATEGIC GUIDE FOR START-UPS TO ENTER INTO HIGHLY COMPETITIVE MARKET
- 10.1. Chapter Overview
- 10.2. Overview of Blue Ocean Strategy
- 10.2.1 Red Ocean
- 10.2.2 Blue Ocean
- 10.2.3 Difference between Red Ocean Strategy and Blue Ocean Strategy
- 10.2.4. AI in Oncology: Blue Ocean Strategy and Shift Tools
- 10.2.4.1. Value Innovation
- 10.2.4.2. Strategy Canvas
- 10.2.4.3. Four Action Framework
- 10.2.4.4. Eliminate-Raise-Reduce-Create (ERRC) Grid
- 10.2.4.5. Six Path Framework
- 10.2.4.6. Pioneer-Migrator-Settler (PMS) Map
- 10.2.4.7. Three Tiers of Noncustomers
- 10.2.4.8. Sequence of Blue Ocean Strategy
- 10.2.4.9. Buyer Utility Map
- 10.2.4.10. The Price Corridor of the Mass
- 10.2.4.11. Four Hurdles to Strategy Execution
- 10.2.4.12. Tipping Point Leadership
- 10.2.4.13. Fair Process
- 10.3. Conclusion
11. MARKET SIZING AND OPPORTUNITY ANALYSIS
- 11.1. Chapter Overview
- 11.2 Key Assumptions and Methodology
- 11.3. Global Artificial Intelligence in Oncology Market, 2022-2035
- 11.4. Artificial Intelligence in Oncology Market: Analysis by Type of Cancer, 2022- 2035
- 11.4.1. Artificial Intelligence in Oncology Market for Breast Cancer, 2022-2035
- 11.4.2. Artificial Intelligence in Oncology Market for Lung Cancer, 2022-2035
- 11.4.3. Artificial Intelligence in Oncology Market for Prostate Cancer, 2022-2035
- 11.4.4. Artificial Intelligence in Oncology Market for Colorectal Cancer, 2022-2035
- 11.4.5. Artificial Intelligence in Oncology Market for Brain Tumor, 2022-2035
- 11.4.6. Artificial Intelligence in Oncology Market for Solid Malignancies, 2022-2035
- 11.4.7. Artificial Intelligence in Oncology Market for Other Cancers, 2022-2035
- 11.5. Artificial Intelligence in Oncology Market: Analysis by Type of End-User, 2022-2035
- 11.5.1. Artificial Intelligence in Oncology Market for Hospitals, 2022-2035
- 11.5.2. Artificial Intelligence in Oncology Market for Pharmaceutical Companies, 2022-2035
- 11.5.3. Artificial Intelligence in Oncology Market for Research Institutes, 2022-2035
- 11.5.4. Artificial Intelligence in Oncology Market for Other End-Users, 2022-2035
- 11.6. Artificial Intelligence in Oncology Market: Analysis by Key Geographical Regions, 2022-2035
- 11.6.1. Artificial Intelligence in Oncology Market for North America, 2022-2035
- 11.6.2. Artificial Intelligence in Oncology Market for Europe, 2022-2035
- 11.6.3. Artificial Intelligence in Oncology Market for Asia Pacific, 2022-2035
- 11.6.4. Artificial Intelligence in Oncology Market for Rest of the World, 2022-2035
12. CONCLUSION
- 12.1. Chapter Overview
13. EXECUTIVE INSIGHTS
- 13.1. Chapter Overview
- 13.2. Company A
- 13.2.1. Company Snapshot
- 13.2.2. Interview Transcript: Vice President, Marketing and Communications
- 13.3. Company B
- 13.3.1. Company Snapshot
- 13.3.2. Interview Transcript: Chief Executive Officer
- 13.4. Company C
- 13.4.1. Company Snapshot
- 13.4.2. Interview Transcript: Chief Executive Officer
- 13.5. Company D
- 13.5.1. Company Snapshot
- 13.5.2. Interview Transcript: Chief Executive Officer
- 13.6. Company E
- 13.6.1 Company Snapshot
- 13.6.2 Interview Transcript: Chief Executive Officer
14. APPENDIX 1: TABULATED DATA
15. APPENDIX 2: LIST OF COMPANIES AND ORGANIZATIONS
List of Tables
- Table 4.1 AI in Oncology: List of Software providers
- Table 4.2 AI in Oncology Software providers: Information on Type of Service(s) Offered
- Table 4.3 AI in Oncology Software providers: Information on the Type of AI Technology Used
- Table 4.4 AI in Oncology Software providers: Information on Type of Platform
- Table 5.1 Roche Diagnostics: Key Highlights
- Table 5.2 IBM Watson Health: Key Highlights
- Table 5.3 CancerCenter.ai: Key Highlights
- Table 5.4 CancerCenter.ai: Recent Developments and Future Outlook
- Table 5.5 GE Healthcare: Key Highlights
- Table 5.6 GE Healthcare: Recent Developments and Future Outlook
- Table 5.7 Concert AI: Key Highlights
- Table 5.8 Concert AI: Recent Developments and Future Outlook
- Table 5.9 Path AI: Key Highlights
- Table 5.10 PathAI: Recent Developments and Future Outlook
- Table 5.11 BERG: Key Highlights
- Table 5.12 BERG: Recent Developments and Future Outlook
- Table 5.13 Median Technologies: Key Highlights
- Table 5.14 Median Technologies: Recent Developments and Future Outlook
- Table 5.15 iCAD: Key Highlights
- Table 5.16 iCAD: Recent Developments and Future Outlook
- Table 5.17 JLK Inspection: Key Highlights
- Table 7.1 Patent Analysis: CPC Symbols
- Table 7.2 Patent Analysis: Most Popular CPC Symbols
- Table 7.3 Patent Analysis: List of Top CPC Symbols
- Table 7.4 Patent Analysis: Categorization based on Weighted Valuation Scores
- Table 7.5 Patent Analysis: List of Relatively High Value Patents
- Table 8.1 Partnerships and Collaborations: List of Partnerships and Collaborations,
- Table 9.1 AI in Oncology: List of Funding and Investments,
- Table 9.2 Funding and Investment Analysis: Summary of Investments (Number of Instances)
- Table 9.3 Funding and Investment Analysis: Summary of Investments (Total Amount Invested)
- Table 9.4 Funding and Investment Analysis: Summary of Venture Capital Funding
- Table 14.1 AI in Oncology Software providers: Distribution by Year of Establishment
- Table 14.2 AI in Oncology Software providers: Distribution by Company Size
- Table 14.3 AI in Oncology Software providers: Distribution by Location of Headquarters (Region-wise)
- Table 14.4 AI in Oncology Software providers: Distribution by Location of Headquarters (Country-wise)
- Table 14.5 AI in Oncology Software providers: Distribution by Type of End-User
- Table 14.6 AI in Oncology Software providers: Distribution by Year of Establishment, Company Size and Location of Headquarters
- Table 14.7 AI in Oncology- based Software Solutions: Distribution by Type of Service(s) Offered
- Table 14.8 AI in Oncology- based Software Solutions: Distribution by Type of AI Technology Used
- Table 14.9 AI in Oncology- based Software Solutions: Distribution by Type of Platform
- Table 14.10 AI in Oncology- based Software Solutions: Distribution by Type of Service(s) Offered and Type of End User
- Table 14.11 AI in Oncology-based Software Solutions: Distribution by Type of Platform and Type of AI Technology Used
- Table 14.12 Roche Diagnostics: Annual Revenues (CHF Billion)
- Table 14.13 IBM Watson Health: Annual Revenues (USD Billion)
- Table 14.14 GE Healthcare: Annual Revenues (USD Billion)
- Table 14.15 Median Technologies: Annual Revenues (EUR Million)
- Table 14.16 iCAD: Annual Revenues (USD Million)
- Table 14.17 Patent Analysis: Distribution by Type of Patents
- Table 14.18 Patent Analysis: Cumulative Distribution by Publication Year
- Table 14.19 Patent Analysis: Year-Wise Distribution of Filed Patent Applications and Granted Patents
- Table 14.20 Patent Analysis: Distribution by Jurisdiction
- Table 14.21 Patent Analysis: Cumulative Distribution by Type of Industry
- Table 14.22 Patent Analysis: Distribution by Patent Age
- Table 14.23 Patent Analysis: Distribution by Legal Status
- Table 14.24 Leading Industry Players: Distribution by Number of Patents
- Table 14.25 Leading Non-Industry Players: Distribution by Number of Patents
- Table 14.26 Patent Analysis: Distribution by Key Inventors
- Table 14.27 AI in Oncology: Patent Valuation Analysis
- Table 14.28 Partnerships and Collaborations: Distribution by Year of Partnership
- Table 14.29 Partnerships and Collaborations: Distribution by Type of Partnership
- Table 14.30 Partnerships and Collaborations: Distribution by Year and Type of Partnership
- Table 14.31 Partnerships and Collaborations: Distribution by Company Size and Type of Partnership
- Table 14.32 Most Active Partners: Distribution by Type of Partnership
- Table 14.33 Partnerships and Collaborations: Distribution by Type of Cancer
- Table 14.34 Partnerships and Collaborations: Distribution by Type of Partner
- Table 14.35 Partnerships and Collaborations: Distribution by Year and Type of Partner
- Table 14.36 Partnerships and Collaborations: Intercontinental and Intracontinental Agreement
- Table 14.37 Partnerships and Collaborations: Local and International Agreement
- Table 14.38 Partnerships and Collaborations: Distribution by Country
- Table 14.39 Partnerships and Collaborations: Distribution by Region
- Table 14.40 Most Active Players: Distribution by number of Partnerships
- Table 14.41 Funding and Investment Analysis: Cumulative Year-wise Distribution by Number of Instances,
- Table 14.42 Funding and Investment Analysis: Cumulative Year-wise Distribution by Amount Invested, (USD Billion)
- Table 14.43 Funding and Investment Analysis: Distribution of Instances by Type of Funding
- Table 14.44 Funding and Investment Analysis: Distribution of Amount Invested and Type of Funding (USD Million)
- Table 14.45 Most Active Players: Distribution by Number of Instances
- Table 14.46 Most Active Players: Distribution by Amount Invested (USD Million)
- Table 14.47 Funding and Investment Analysis: Distribution of Funding Instances by Area of Application
- Table 14.48 Funding and Investment Analysis: Distribution of Instances by Focus Area
- Table 14.49 Funding and Investment Analysis: Distribution by Geography
- Table 14.50 Funding and Investment Analysis: Distribution of Instances by Type of Cancer
- Table 14.51 Most Active Investors: Distribution by Number of Instances
- Table 14.52 Funding and Investment Analysis: Distribution by Type of Lead Investors
- Table 14.53 Funding and Investment Analysis: Summary of Amount Invested (USD Million)
- Table 14.54 Global Artificial Intelligence in Oncology Market Till 2035, Conservative, Base and Optimistic Scenarios, Till 2035 (USD Billion)
- Table 14.55 Artificial Intelligence in Oncology Market: Distribution by Type of Cancer, Till 2035
- Table 14.56 Artificial Intelligence in Oncology Market for Breast Cancer, Conservative, Base and Optimistic Scenarios, Till 2035 (USD Billion)
- Table 14.57 Artificial Intelligence in Oncology Market for Lung Cancer, Conservative, Base and Optimistic Scenarios, Till 2035 (USD Billion)
- Table 14.58 Artificial Intelligence in Oncology Market for Prostate Cancer, Conservative, Base and Optimistic Scenarios, Till 2035 (USD Billion)
- Table 14.59 Artificial Intelligence in Oncology Market for Colorectal Cancer, Conservative, Base and Optimistic Scenarios, Till 2035 (USD Billion)
- Table 14.60 Artificial Intelligence in Oncology Market for Brain Tumor, Conservative, Base and Optimistic Scenarios, Till 2035 (USD Billion)
- Table 14.61 Artificial Intelligence in Oncology Market for Solid Malignancies, Conservative, Base and Optimistic Scenarios, Till 2035 (USD Billion)
- Table 14.62 Artificial Intelligence in Oncology Market for Other Cancers, Conservative, Base and Optimistic Scenarios, Till 2035 (USD Billion)
- Table 14.63 Artificial Intelligence in Oncology Market: Distribution by Type of End-Users, Till 2035
- Table 14.64 Artificial Intelligence in Oncology Market for Hospitals, Conservative, Base and Optimistic Scenarios, Till 2035 (USD Billion)
- Table 14.65 Artificial Intelligence in Oncology Market for Pharmaceutical Companies, Conservative, Base and Optimistic Scenarios, Till 2035 (USD Billion)
- Table 14.66 Artificial Intelligence in Oncology Market for Research Institutes, Conservative, Base and Optimistic Scenarios, Till 2035 (USD Billion)
- Table 14.67 Artificial Intelligence in Oncology Market for Other End-Users, Conservative, Base and Optimistic Scenarios, Till 2035 (USD Billion)
- Table 14.68 Artificial Intelligence in Oncology Market: Distribution by Key Geographical Regions, Till 2035
- Table 14.69 Artificial Intelligence in Oncology Market for North America, Conservative, Base and Optimistic Scenarios, Till 2035 (USD Billion)
- Table 14.70 Artificial Intelligence in Oncology Market for Europe, Conservative, Base and Optimistic Scenarios, Till 2035 (USD Billion)
- Table 14.71 Artificial Intelligence in Oncology Market for Asia Pacific, Conservative, Base and Optimistic Scenarios, Till 2035 (USD Billion)
- Table 14.72 Artificial Intelligence in Oncology Market for Rest of the World, Conservative, Base and Optimistic Scenarios, Till 2035 (USD Billion)
List of Figures
- Figure 2.1 Executive Summary: Market Landscape
- Figure 2.2 Executive Summary: Patent Analysis
- Figure 2.3 Executive Summary: Partnerships and Collaboration Analysis
- Figure 2.4 Executive Summary: Funding and Investment Analysis
- Figure 2.5 Executive Summary: Market Forecast and Opportunity Analysis
- Figure 3.1 Historical Evolution of AI
- Figure 3.2 Relationship between AI, ML and DL
- Figure 3.3 Type of Artificial Intelligence
- Figure 3.4 Artificial Intelligence Software Solutions: Distribution by Oncology-related Field
- Figure 3.5 Artificial Intelligence Software Solutions: Distribution by Various Types of Cancers Detected
- Figure 4.1 AI in Oncology Software providers: Distribution by Year of Establishment
- Figure 4.2 AI in Oncology Software providers: Distribution by Company Size
- Figure 4.3 AI in Oncology Software providers: Distribution by Location of Headquarters (Region-wise)
- Figure 4.4 AI in Oncology Software providers: Distribution by Location of Headquarters (Country-wise)
- Figure 4.5 AI in Oncology Software providers: Distribution by Type of End-User
- Figure 4.6 AI in Oncology Software providers: Distribution by Year of Establishment, Company Size and Location of Headquarters
- Figure 4.7 AI in Oncology- based Software Solutions: Distribution by Type of Service(s) Offered
- Figure 4.8 AI in Oncology- based Software Solutions: Distribution by Type of AI Technology Used
- Figure 4.9 AI in Oncology- based Software Solutions: Distribution by Type of Platform
- Figure 4.10 AI in Oncology- based Software Solutions: Distribution by Type of Service(s) Offered and Type of end-user
- Figure 4.11 AI in Oncology Software Solutions: Distribution by Type of Platform and Type of AI Technology Used
- Figure 4.12 AI in Oncology-based Software Solutions: Distribution by Type of Service(s) Offered, Location of Headquarters and Type of AI Technology Used
- Figure 5.1 Roche Diagnostics: Annual Revenues, Since 2017 (CHF Billion)
- Figure 5.2 Roche Diagnostics: Service Portfolio
- Figure 5.3 IBM Watson Health: Annual Revenues, Since 2017 (USD Billion)
- Figure 5.4 IBM Watson Health: Service Portfolio
- Figure 5.5 CancerCenter.ai: Service Portfolio
- Figure 5.6 GE Healthcare: Annual Revenues, Since 2017 (USD Billion)
- Figure 5.7 PathAI: Service Portfolio
- Figure 5.8 BERG: Service Portfolio
- Figure 5.9 Median Technologies: Annual Revenues, Since 2017 (EUR Million)
- Figure 5.10 iCAD: Annual Revenues, Since 2017 (USD Million)
- Figure 5.11 iCAD: Distribution of Revenues by Business Units (USD Million)
- Figure 5.12 JLK Inspection: Service Portfolio
- Figure 6.1 Company Competitiveness Analysis: Small Companies in North America
- Figure 6.2 Company Competitiveness Analysis: Small Companies in Europe
- Figure 6.3 Company Competitiveness Analysis: Small Companies in Asia Pacific
- Figure 6.4 Company Competitiveness Analysis: Mid-sized companies in North America
- Figure 6.5 Company Competitiveness Analysis: Mid-sized companies in Europe
- Figure 6.6 Company Competitiveness Analysis: Mid-sized companies in Asia Pacific
- Figure 6.7 Company Competitiveness Analysis: Large Companies in North America and Europe
- Figure 7.1 Patent Analysis: Distribution by Type of Patents
- Figure 7.2 Patent Analysis: Cumulative Distribution by Publication Year
- Figure 7.3 Patent Analysis: Year-wise Distribution of Filed Patent Applications and Granted Patents
- Figure 7.4 Patent Analysis: Distribution by Jurisdiction
- Figure 7.5 Patent Analysis: Cumulative Distribution by Type of Industry
- Figure 7.6 Patent Analysis: Distribution by Patent Age
- Figure 7.7 Patent Analysis: Distribution by Legal Status
- Figure 7.8 Patent Analysis: Distribution by CPC Symbols
- Figure 7.9 Leading Industry Players: Distribution by Number of Patents
- Figure 7.10 Leading Non-Industry Players: Distribution by Number of Patents
- Figure 7.11 Patent Analysis: Distribution by Key Inventors
- Figure 7.12 Patent Analysis (Top 10 CPC Symbols): Benchmarking by Leading Industry Players
- Figure 7.13 AI in Oncology: Patent Valuation Analysis
- Figure 8.1 Partnerships and Collaborations: Distribution by Year of Partnership, 2017- 2022
- Figure 8.2 Partnerships and Collaborations: Distribution by Type of Partnership
- Figure 8.3 Partnerships and Collaborations: Distribution by Year and Type of Partnership
- Figure 8.4 Partnerships and Collaborations: Distribution by Company Size and Type of Partnership
- Figure 8.5 Most Active Partners: Distribution by Number of Partnerships
- Figure 8.6 Most Active Players: Distribution by Type of Partnership
- Figure 8.7 Partnerships and Collaborations: Distribution by Type of Cancer
- Figure 8.8 Partnerships and Collaborations: Distribution by Type of Partner
- Figure 8.9 Partnerships and Collaborations: Distribution by Year and Type of Partner
- Figure 8.10 Partnerships and Collaborations: Intercontinental and Intracontinental Agreement
- Figure 8.11 Partnerships and Collaborations: Local and International Agreement
- Figure 8.12 Partnerships and Collaborations: Distribution by Country
- Figure 8.13 Partnerships and Collaborations: Distribution by Region
- Figure 9.1 Funding and Investment Analysis: Cumulative Year-wise Distribution by Number of Instances,
- Figure 9.2 Funding and Investment Analysis: Cumulative Year-wise Distribution by Amount Invested, (USD Billion)
- Figure 9.3 Funding and Investment Analysis: Distribution of Instances by Type of Funding
- Figure 9.4 Funding and Investment Analysis: Distribution of Amount Invested by Year and Type of Funding, (USD Million)
- Figure 9.5 Funding and Investment Analysis: Distribution by Amount Invested and Type of Funding (USD Billion)
- Figure 9.6 Funding and Investment Analysis: Distribution of Funding Instances by Area of Application
- Figure 9.7 Funding and Investment Analysis: Distribution of Instances by Focus Area
- Figure 9.8 Funding and Investment Analysis: Distribution of Instances by Type of Cancer
- Figure 9.9 Funding and Investment Analysis: Distribution by Geography
- Figure 9.10 Most Active Players: Distribution by Number of Instances
- Figure 9.11 Most Active Players: Distribution by Amount Invested (USD Million)
- Figure 9.12 Funding and Investment Analysis: Distribution by Type of Investors
- Figure 9.13 Most Active Investors: Distribution by Number of Instances
- Figure 9.14 Funding and Investment Analysis: Summary of Amount Invested, (USD Billion)
- Figure 9.15 Funding and Investment Analysis: Concluding Remarks
- Figure 10.1 Red Ocean Strategy vs Blue Ocean Strategy
- Figure 10.2 Blue Ocean Strategy: Strategy Canvas
- Figure 10.3 Blue Ocean Strategy: Eliminate-Raise-Reduce-Create (ERRC) Grid
- Figure 10.4 Blue Ocean Strategy: Pioneer-Migrator-Settler (PMS) Map
- Figure 10.5 Blue Ocean Strategy: Three Tiers of Noncustomers
- Figure 10.6 Blue Ocean Strategy: Sequence of Blue Ocean Strategy
- Figure 10.7 Blue Ocean Strategy: Buyer Utility Map
- Figure 10.8 Blue Ocean Strategy: The Price Corridor of the Mass
- Figure 11.1 Global Artificial Intelligence in Oncology Market, Till 2035 (USD Billion)
- Figure 11.2 Artificial Intelligence in Oncology Market: Distribution by Type of Cancer, Till 2035 (USD Billion)
- Figure 11.3 Artificial Intelligence in Oncology Market for Breast Cancer, Till 2035 (USD Billion)
- Figure 11.4 Artificial Intelligence in Oncology Market for Lung Cancer, Till 2035 (USD Billion)
- Figure 11.5 Artificial Intelligence in Oncology Market for Prostate Cancer, Till 2035 (USD Billion)
- Figure 11.6 Artificial Intelligence in Oncology Market for Colorectal Cancer, Till 2035 (USD Billion)
- Figure 11.7 Artificial Intelligence in Oncology Market for Brain Tumor, Till 2035 (USD Billion)
- Figure 11.8 Artificial Intelligence in Oncology Market for Solid Malignancies, Till 2035 (USD Billion)
- Figure 11.9 Artificial Intelligence in Oncology Market for Other Cancers, Till 2035 (USD Billion)
- Figure 11.10 Artificial Intelligence in Oncology Market: Distribution by Type of End-User, Till 2035 (USD Billion)
- Figure 11.11 Artificial Intelligence in Oncology Market for Hospitals, Till 2035 (USD Billion)
- Figure 11.12 Artificial Intelligence in Oncology Market for Pharmaceutical Companies, Till 2035 (USD Billion)
- Figure 11.13 Artificial Intelligence in Oncology Market for Research Institutes, Till 2035 (USD Billion)
- Figure 11.14 Artificial Intelligence in Oncology Market for Other End-Users, Till 2035 (USD Billion)
- Figure 11.15 Artificial Intelligence in Oncology Market: Distribution by Geography, Till 2035 (USD Billion)
- Figure 11.16 Artificial Intelligence in Oncology Market for North America, Till 2035 (USD Billion)
- Figure 11.17 Artificial Intelligence in Oncology Market for Europe, Till 2035 (USD Billion)
- Figure 11.18 Artificial Intelligence in Oncology Market for Asia Pacific, Till 2035 (USD Billion)
- Figure 11.19 Artificial Intelligence in Oncology Market for Rest of the World, Till 2035 (USD Billion)
- Figure 12.1 Concluding Remarks: AI in Oncology Market Landscape
- Figure 12.2 Concluding Remarks: Patent Analysis
- Figure 12.3 Concluding Remarks: Partnerships and Collaborations Analysis
- Figure 12.4 Concluding Remarks: Funding and Investment Analysis
- Figure 12.5 Concluding Remarks: Market Forecast and Opportunity Analysis
 全球肿瘤人工智慧市场:预测至 2032 年—按组件、癌症类型、技术、应用、最终用户和地区分類的分析
 肿瘤学人工智慧市场(按产品类型、技术、癌症类型、应用、最终用户和部署模式)—全球预测,2025-2030 年
 肿瘤学人工智慧市场-全球产业规模、份额、趋势、机会和预测,按成分、癌症类型、治疗类型、地区和竞争细分,2020-2030 年
 全球肿瘤人工智慧市场:按成分、按癌症类型、按治疗类型、按最终用户、按地区
 癌症领域人工智慧的全球市场(~2030年):公司类型(整合套件)、应用(药物发现、新药设计、诊断、精准医疗、基因组学)、技术(CNN、NLP)、癌症类型(肺癌)、最终按使用者(医院/製药公司)/地区
 肿瘤学人工智慧 (AI) 市场:未来预测(2024-2029)
 肿瘤市场中的人工智慧 - 全球产业分析、规模、份额、成长、趋势和预测,2024-2034 年
 肿瘤学人工智慧市场、份额、规模、趋势、产业分析报告:按癌症类型、成分、治疗类型、地区和细分市场预测,2024-2032年