


 |
市场调查报告书
商品编码
1821505
抗肥胖药市场:2035年前的产业趋势和全球预测 - 各分子类型,-+化合物,各作用机制,各促效剂类型,各作用途径,各给药途径,各地区,预测销售额,主要企业Anti-Obesity Drugs Market: Industry Trends and Global Forecasts, till 2035 - Distribution by Type of Molecule, Active Compound Used, Mechanism of Action, Agonist, Action Pathway, Route of Administration, Regions, Sales Forecast and Key Players |
||||||
减肥药市场:概览
预计到2035年,全球减肥药市场规模将从目前的196亿美元成长至1,049亿美元,预测期内复合年增长率达18.3%。
市场区隔按以下参数细分市场规模与市场机会:
分子类型
- 生技药品
- 低分子
使用活性化合物
- Tirzepatide
- Semaglutide
- Retatrutide
- Survodutide
- Cagrilintide and Semaglutide
- Orforglipron
- Liraglutide
- 其他的活性化合物
作用机制
- GLP-1促效剂/GIP促效剂
- GLP-1促效剂/GCGR促效剂
- GLP-1促效剂
- GLP-1促效剂/Amylin类比
- GLP-1/GCGR/GIP促效剂
- 其他的作用机制
促效剂类型
- 单一促效剂
- 双重促效剂
- 三重促效剂
作用途径
- 中枢性作用
- 末梢性作用
- 中枢性作用和末梢性作用
给药途径
- 口服
- 非口服
地区
- 北美
- 欧洲
- 亚洲
- 南美
- 中东·北非
医药品预测销售额
- Contrave/Mysimba
- Feisumei
- Imcivree
- LOMAIRA
- QSYMIA
- Saxenda
- Wegovy/Ozempic
- Zepbound/Mounjaro
- BI 456906
- CagriSema
- HM11260C
- HRS-9531
- IBI362
- LM-008
- LY3437943
- LY3502970
- TG103
- Semaglutide 7.2 mg (Subcutaneous)
- Semaglutide (Oral)
- XW003
减肥药市场成长与趋势
全球肥胖症已成为一个迫切问题,刺激了减肥药市场的发展。推动这一趋势的因素包括肥胖症的流行、可支配收入的增加以及医疗服务可近性的改善。近年来,越来越多的减肥药获得批准,拓宽了患者的治疗选择。这是一个令人不安的统计数据:大约40%的美国成年人被归类为肥胖,其体重指数 (BMI) 为30或更高。
减肥药物透过调节食慾、脂肪吸收和代谢过程来达到减肥的目的。这些药物包括各种旨在帮助控制肥胖及其相关症状的治疗方案。随着全球肥胖率的上升以及人们对糖尿病、心血管疾病和某些癌症等相关健康风险的认识不断提高,对有效减肥药物的需求日益增长。值得注意的是,近年来许多新型减重药物已获得监管部门的批准,这扩大了患者的选择,并为外科手术减重提供了替代方案。
减重药物对于增强减重效果至关重要,尤其对于有严重肥胖相关健康问题的患者。此外,这些药物还可以透过预防肥胖相关併发症来改善生活品质并降低医疗成本。药物配方和给药系统的创新,以及新型化合物的整合,正在加速开发更安全、更有效的减肥药物。个人化医疗和药物基因组学日益受到重视,进一步提升了根据患者个体需求量身定制治疗的潜力。此外,远距医疗服务和数位治疗应用的兴起,正在促进患者更好地参与并更好地遵守治疗计划。
公私部门正在积极投资减重领域的研发,促进创新并开发尖端疗法。随着肥胖作为一种需要长期管理的慢性疾病越来越受到关注,预计减肥药物市场将在未来几年经历显着增长,并为利益相关者提供重大机会。
减肥药市场关键洞见
本报告深入探讨了减肥药物市场的现状,并指出了该行业的潜在成长机会。主要发现包括:
- 目前,市面上或正在研发的减肥药物近225种,其中约50%为口服药物。
- 目前,约55%的减重药物处于临床开发阶段,其中大多数正在评估单药治疗的效果。
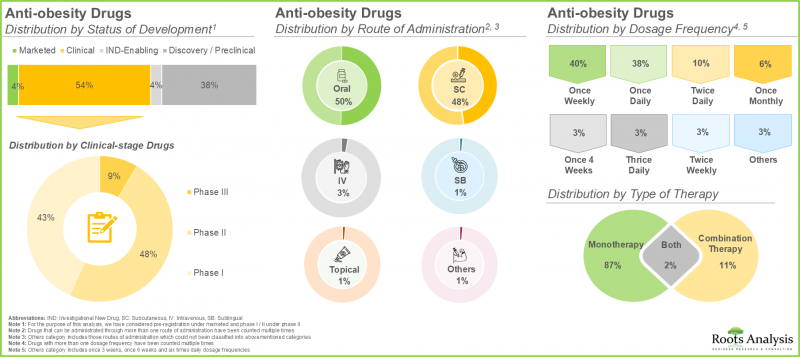
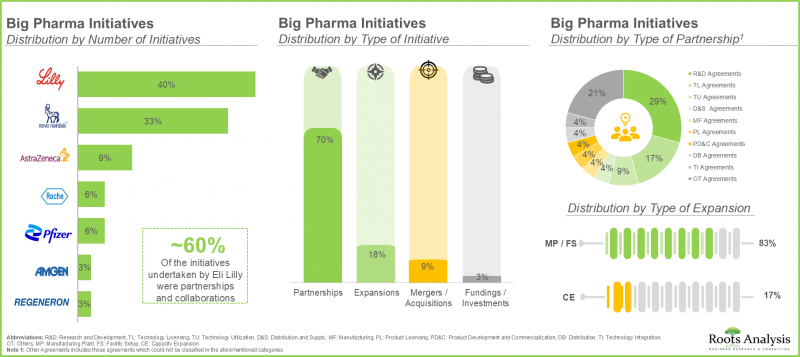
- 相当一部分(70%)的大型製药公司已经建立了各种合作伙伴关係,以扩大其减肥药物组合。这些合作关係中,大多数(约30%)是研发协议。
- 患者对肥胖相关健康风险以及肥胖流行病的认识不断提高,推动了抗肥胖药物市场的发展,预计该市场在短期内将实现稳定增长。
- 预计到2035年,抗肥胖药物市场的复合年增长率 (CAGR) 将达到21.1%,其中北美市场预计将占大部分市场占有率 (60%)。
- 目前,中枢作用的抗肥胖药物占市场主导地位,但预计到2035年,肠外给药将占大部分市场占有率 (85%)。
抗肥胖药市场:主要市场区隔
依分子类型划分,抗肥胖药物市场分为多种分子类型,包括生物製剂和小分子药物。小分子药物因其疗效确切、易于服用、生产成本低、易于获取且安全性得到确认,占了大部分市场占有率(54%)。然而,随着生物製剂成为一种有前景且更有效的治疗肥胖相关生物途径的替代方案,这种情况预计将有所改变。
从分子角度来看,减肥药市场细分为各种活性化合物,包括索马鲁肽、雷他肽、萨尔沃度肽、卡格列肽、奥格列酮、利拉鲁肽等。由于其在体重管理和糖尿病控制方面的强效作用,索马鲁肽目前占减肥药市场的主导地位。然而,随着研究的进展,替泽帕肽因其作为GLP-1和GIP受体激动剂的双重作用而备受关注,并在临床试验中展现出卓越的减肥效果。这种创新方法针对多种代谢途径,为肥胖症提供了更全面的治疗方案。由于其更高的疗效和改善患者预后的潜力,预计替泽帕肽将在未来几年最终占并成为最大的市场占有率。
依作用机制,抗肥胖/减肥药物市场可细分为GLP-1激动剂/GIP激动剂、GLP-1激动剂/GCGR激动剂、GLP-1激动剂、GLP-1激动剂/胰淀素类似物、GLP-1/GCGR/GIP激动剂以及其他作用机转。 GLP-1市场目前占主导地位,因为它的作用机制已得到充分证实,能够透过改善血糖控制来显着减轻体重。其增加饱足感和抑制食慾的能力是肥胖治疗的基石。然而,GLP-1和GIP双激动剂由于能够靶向多种代谢途径,预计将以相对较高的复合年增长率增长。临床研究表明,与单独使用GLP-1激动剂相比,双激动剂能够带来更显着的减重效果和代谢改善。
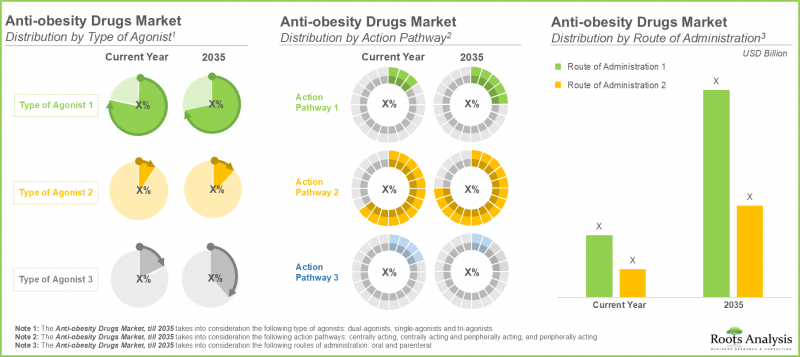
市场细分为各种类型的激动剂,包括单激动剂、双激动剂和三重激动剂。目前,单一激动剂因其易于使用、可提高患者依从性而占减重药物的最大市场占有率(68%)。这些药物拥有悠久的临床成功历史,医疗保健提供者可以基于大量数据放心地开立处方。随后,双激动剂有望显着增长,因为它们可以同时针对多种生理机制来应对肥胖的复杂性。这使得能够根据个别患者的需求和病情制定更个人化的治疗方案。随着医疗保健向个人化医疗转变,双激动剂预计将变得更加普及,从而促使对其开发的投资增加。
市场涵盖各种作用途径,包括中枢作用途径、週边作用途径、中枢和周边同时作用途径。目前,中枢作用药物占减肥药市场最大占有率(86%),预计在整个预测期内都将占主导地位。这是因为它们能够透过与中枢神经系统直接相互作用来调节食慾和能量消耗。此外,中枢作用药物已建立起安全性,进一步巩固了其在临床实践中的地位。此外,由于中枢作用途径提供了一种全面的体重管理方法,其市场对中枢作用途径的依赖程度可能持续较高。儘管替代途径的研究仍在进行中,但由于确凿的临床证据支持其有效性,中枢作用途径在市场上的主导地位仍然强劲。因此,儘管新的疗法可能不断涌现,但预期中枢作用途径的趋势仍将持续,这反映了其在肥胖管理中的基础作用。
根据给药途径,减肥药市场分为口服和非口服途径。研究表明,非口服药物由于起效更快、生物利用度更高,占了大部分市场占有率(98%)。肠外给药可确保药物绕过胃肠道,减少吸收差异,增强疗效。对于需要精准剂量和稳定血浆浓度以达到最佳减肥效果的药物而言,肠外给药具有优势。此外,注射药物也越来越受到青睐。这一趋势日益倾向于肠外给药。因此,虽然口服给药方案仍然存在,但肠外给药在未来很可能仍将是减重药物的主导。
全球市场规模细分为多个地区,包括北美、欧洲、亚太地区和拉丁美洲。根据我们的预测,北美占减肥药物市场的主导占有率(70%),预计在整个预测期内都将维持这一水准。这得归功于该地区先进的医疗基础设施、对药物研究的大量投资以及完善的监管框架,这些框架有利于新疗法的开发和批准。值得注意的是,预计到2035年,亚太地区的减重药物市场将以相对较高的复合年增长率(40%)成长。
抗体受託製造市场参与企业案例
- Boehringer Ingelheim
- Eli Lilly
- Novo Nordisk
- Eli Lilly
- Pfizer
- Regeneron
- Kallyope
- CinFina Pharma
- Viking Therapeutics
- AstraZeneca
- Novo Nordisk
- Roche
- Adocia
- Boehringer Ingelheim
- Zealand Pharma
- Hanmi Pharm
- Jiangsu Hengrui Pharmaceuticals
- Gmax Biopharma
- PegBio
- QL Biopharm
- Sciwind Biosciences
抗肥胖药物市场研究报告
- 市场规模和机会分析:本报告按主要细分市场对全球抗肥胖药物市场进行了全面分析,包括[A]分子类型、[B]所用活性成分、[C]作用机制、[D]激动剂类型、[E]作用途径、[F]给药途径和[G]地区。
- 市场格局:基于若干相关参数,对参与抗肥胖药物市场的公司进行详细评估,包括[A]市场发展状况、[B]分子类型、[C]作用机制、[D]激动剂类型、[E]给药途径、[F]给药频率和[G]治疗类型。
- 竞赛分析:对减重药物进行全面的竞争分析,检视[A]公司实力、[B]产品线组合和其他因素。
- 公司简介:减肥药物市场主要服务提供者的详细简介,重点关注[A]公司概况、[B]财务资讯(如有)、[C]产品线组合以及[D]近期发展和未来前景。
- 大型製药公司举措:本节回顾大型製药公司所进行的各种减肥举措,并确定各种参数的趋势,包括:[A]举措数量、[B]举措年份、[C]举措类型、[D]合作类型和[D]扩张类型。
目录
第1章 背景
第2章 调查手法
第3章 市场动态
- 章概要
- 预测调查手法
- 市场评估组成架构
- 预测工具和技巧
- 重要的考虑事项
- 主要市场区隔
- 坚牢的品管
- 限制事项
第4章 经济及其他项目具体考量
- 章概要
- 市场动态
第5章 摘要整理
第6章 简介
- 抗肥胖药概要
- 长期肥胖相关的健康风险
- 目前经过认证的抗肥胖药的种类
- 抗肥胖药伴随的课题
- 未来展望
第7章 市场形势:抗肥胖药
- 市场形势:抗肥胖药
- 开发商的形势:抗肥胖药
第8章 公司简介:北美抗肥胖药开发企业
- 章概要
- 详细的企业简介
- Eli Lilly
- Pfizer
- Regeneron
- 简洁的企业简介
- CinFina Pharma
- Kallyope
- Viking Therapeutics
第9章 公司简介:欧洲抗肥胖药开发企业
- 章概要
- 详细的企业简介
- AstraZeneca
- Novo Nordisk
- Roche
- 简洁的企业简介
- Adocia
- Boehringer Ingelheim
- Zealand Pharma
第10章 公司简介:亚太地区及其他地区抗肥胖药开发企业
- 章概要
- 详细的企业简介
- Hanmi Pharmaceuticals
- Jiangsu Hengrui Pharmaceuticals
- 简洁的企业简介
- Gmax Biopharma
- PegBio
- QL Biopharm
- Sciwind Biosciences
第11章 大型製药公司的配合措施
- 调查手法
- 大型製药公司:重点关注的措施肥胖
第12章 市场影响分析:促进因素,阻碍因素,机会,课题
第13章 全球抗肥胖药市场
- 预测研究方法与关键假设
- 全球抗肥胖药物市场:历史趋势(2019年至今)与预测估计(截至2035年)
- 主要细分市场
第14章 抗肥胖药市场(各分子类型)
第15章 抗肥胖药市场(各使用的活性化合物)
第16章 抗肥胖药市场(各作用机制)
第17章 抗肥胖药市场(各促效剂类型)
第18章 抗肥胖药市场(各作用途径)
第19章 抗肥胖药市场(各给药途径)
第20章 抗肥胖药市场(各地区)
第21章 抗肥胖药市场,成药及第三阶段临床试验药的销售额预测
- 成药:预测销售额
- Contrave/Mysimba
- Feisumei
- Imcivree
- LOMAIRA
- QSYMIA
- Saxenda
- Wegovy/Ozempic
- Zepbound/Mounjaro
- 第三阶段医药品:预测销售额
- BI 456906
- CagriSema
- HM11260C
- HRS-9531
- IBI362
- LM-008
- LY3437943
- LY3502970
- TG103
- Semaglutide 7.2 mg (Subcutaneous)
- Semaglutide (Oral)
- XW003
第22章 抗肥胖药市场(各主要企业)
第23章 附录1:表格形式资料
第24章 附录2:企业·团体一览
Anti-Obesity Drugs Market: Overview
As per Roots Analysis, the global anti-obesity drugs market is estimated to grow from USD 19.6 billion in the current year and USD 104.9 billion by 2035, representing a CAGR of 18.3% during the forecast period.
The market sizing and opportunity analysis has been segmented across the following parameters:
Type of Molecule
- Biologics
- Small Molecules
Active Compound Used
- Tirzepatide
- Semaglutide
- Retatrutide
- Survodutide
- Cagrilintide and Semaglutide
- Orforglipron
- Liraglutide
- Other Active Compounds
Mechanism of Action
- GLP-1 Agonist / GIP Agonist
- GLP-1 Agonist / GCGR Agonist
- GLP-1 Agonist
- GLP-1 Agonist / Amylin Analogue
- GLP-1 / GCGR / GIP Agonist
- Other Mechanisms of Action
Type of Agonist
- Single-Agonist
- Dual-Agonist
- Tri-Agonist
Action Pathway
- Centrally Acting
- Peripherally Acting
- Centrally Acting and Peripherally Acting
Route of Administration
- Oral
- Parenteral
Geographical Regions
- North America
- Europe
- Asia
- Latin America
- Middle East and North Africa
Sales Forecast of Drugs
- Contrave / Mysimba
- Feisumei
- Imcivree
- LOMAIRA
- QSYMIA
- Saxenda
- Wegovy / Ozempic
- Zepbound / Mounjaro
- BI 456906
- CagriSema
- HM11260C
- HRS-9531
- IBI362
- LM-008
- LY3437943
- LY3502970
- TG103
- Semaglutide 7.2 mg (Subcutaneous)
- Semaglutide (Oral)
- XW003
Anti-Obesity drugs Market: Growth and Trends
The urgent need to address obesity epidemic globally has resulted in the boost of the anti-obesity drugs market. Factors such as increasing obesity prevalence, rising disposable incomes, and greater access to healthcare services are propelling this trend. The recent years have witnessed a rise in the approval of anti-obesity drugs, thereby expanding treatment options for patients. This is a result of the alarming statistics of approximately 40% of adults in the U.S. being classified as obese, with a body mass index (BMI) of 30 or higher.
The anti-obesity drugs target weight loss by regulating appetite, fat absorption, and metabolic processes. These drugs include various therapeutic options designed to assist individuals in managing obesity and related conditions. As global obesity rates increase and the awareness of associated health risks, including diabetes, cardiovascular diseases, and certain cancers rise, the need for effective anti-obesity medications has escalated. It is worth mentioning that, in the recent years, many new anti-obesity drugs have gained regulatory approval, expanding options for patients and offering alternatives to surgical procedures for weight loss.
Anti-obesity medications are vital in enhancing weight loss results, especially for patients with severe obesity-related health issues. Further, these drugs contribute to improved quality of life and can lower healthcare expenses by preventing complications related to obesity. Innovations in drug formulation and delivery systems, along with the integration of novel compounds, have resulted in the development of safer and more effective anti-obesity medications. The growing emphasis on personalized medicine and pharmacogenomics further enhances the potential for tailored treatments that address individual patient needs. Additionally, the rise in telehealth services and digital therapeutics applications is facilitating better patient engagement and adherence to treatment plans.
Public and private sectors are actively providing investments in order to conduct research and development in the anti-obesity space, along with fostering innovation and developing cutting-edge therapies. As the focus on obesity as a chronic disease that needs long-term management increases, the anti-obesity drugs market is poised for substantial growth, presenting significant opportunities for stakeholders in the coming years.
Anti-Obesity Drugs Market: Key Insights
The report delves into the current state of the anti-obesity drugs market and identifies potential growth opportunities within the industry. Some key findings from the report include:
- Currently, close to 225 drugs are marketed / being developed for the management of obesity; around 50% of these can be administered through the oral route.
- Around 55% of the anti-obesity drugs are presently in their clinical stage of development; of these, majority of these drugs are being evaluated as monotherapy.
- A sizeable proportion (70%) of big pharma players have entered into various partnerships in order to expand their anti-obesity drug portfolios; majority of these partnerships (~30%) were research and development agreements.
- The growing awareness among patients about the health risks associated with obesity coupled with its increasing prevalence, is driving the anti-obesity market and positioning it for steady growth in the foreseeable future.
- The anti-obesity drugs market is anticipated to grow at an annualized rate (CAGR) of 21.1%, till 2035; North America is expected to capture the majority share (~60%) of the market by 2035.
- Currently, the centrally acting anti-obesity drugs dominate the market; notably, parenteral route of administration is expected to capture the majority share (~85%) in the market by 2035.
Anti-Obesity Drugs Market: Key Segments
Small Molecules is the Fastest Growing Segment of the Anti-obesity Drugs Market
In terms of type of molecule, the anti-obesity drugs market is segmented into different type of molecules, such as biologics and small molecules. Majority (54%) of the market share is captured small molecules owing to their proven efficacy, ease of administration, lower production costs, accessibility and established safe drug profiles. However, the landscape is expected to change as biologics emerge as a promising and more effective alternative for the underlying biological pathways associated with obesity.
Semaglutide is Likely to Hold the Largest Share of the Anti-obesity Drugs Market During the Forecast Period
In terms of type of molecule, the anti-obesity drugs market is segmented into various active compounds used, such as semaglutide, retatrutide, survodutide, cagrilintide, orforglipron, liraglutide and other active compounds. Owing to its strong efficacy in weight management and diabetes control, majority of the anti-obesity drugs market is currently captured by semaglutide. However, as research progresses, tirzepatide is gaining attention for its dual action as both a GLP-1 and GIP receptor agonist, demonstrating superior weight loss results in clinical trials. This innovative approach targets various metabolic pathways, offering a more comprehensive treatment for obesity. With its potential for greater efficacy and improved patient outcomes, tirzepatide is expected to rise in prominence, ultimately securing the largest market share in the years to come.
Anti-Obesity Drugs Market for GLP-1 Agonist is Likely to grow at a Relatively Faster Pace During the Forecast Period
In terms of mechanism of action, the anti-obesity drugs / weight loss drugs market is segmented into GLP-1 agonist / GIP agonist, GLP-1 agonist / GCGR agonist, GLP-1 agonist, GLP-1 agonist / amylin analogue, GLP-1 / GCGR / GIP agonist and other mechanisms of action. The current market is dominated by GLP-1 market segment. This is attributed to their well-established mechanism of action, which improve glycemic control, thereby promoting significant weight loss. Their ability to enhance satiety and reduce appetite is the foundation in obesity treatment. However, dual GLP-1 and GIP agonists are anticipated to grow at a comparatively higher CAGR because of their ability to target multiple metabolic pathways. Clinical studies suggest that dual agonists can yield greater weight loss and improved metabolic profiles compared to GLP-1 agonists alone.
Anti-Obesity Drugs Market for Single Agonist is Likely to Grow at a Higher CAGR During the Forecast Period
The market is segmented into different types of agonists, including single-agonist, dual-agonist and tri-agonist. Owing to the ease of use in order to facilitate patient adherence, the single agonist segment currently captures the maximum anti-obesity drugs market share (68%). These medications have a long-standing history of clinical success, which enables healthcare providers to confidently prescribe them based on extensive data. Following it, the dual agonist segment will capture a prominent market share, driven by its capability to address the complexities of obesity by targeting multiple physiological mechanisms simultaneously. This allows for more tailored treatments that can adapt to individual patient needs and conditions. Dual agonists are set to become more popular as healthcare shifts toward personalized medicine, thus resulting in greater investments in their development.
Anti-Obesity Drugs Catering to Centrally Acting Pathways is Likely to Dominate the Anti-Obesity Drugs Market During the Forecast Period
The market caters to a variety of action pathways, including centrally acting, peripherally acting and centrally and peripherally acting pathways. Centrally acting segment currently captures the highest anti-obesity drugs market share (86%) and is expected to dominate the market during the forecast period. This is a result of its effectiveness in modulating appetite and energy expenditure through direct interactions with the central nervous system. Additionally, centrally acting agents have a well-established safety profile, which further solidifies their position in clinical practice. Further, the reliance on centrally acting pathways is likely to remain strong, as they provide a comprehensive approach to managing weight. Despite ongoing research into alternative pathways, robust clinical evidence supporting the efficacy of centrally acting agents ensures their continued dominance in the market. Consequently, while new treatments may emerge, the trend towards centrally acting pathways is expected to persist, reflecting their fundamental role in obesity management.
Currently, Parenteral Route Hold the Largest Share of the Anti-Obesity Drugs Market
In terms of route of administration, the anti-obesity drugs market is segmented across oral and parenteral routes. Our research suggests that parenteral route captures the majority share (98%) in the market owing to its rapid onset of action and higher bioavailability compared to oral formulations. Parenteral delivery ensures the medications to bypass the gastrointestinal tract, reducing variability in absorption and enhancing therapeutic effectiveness. It is advantageous for agents that require precise dosing and consistent plasma levels to achieve optimal weight loss outcomes. Moreover, the growing preference for injectable formulations reinforces the trend toward parenteral administration. Consequently, although oral options remain available, the dominance of parenteral administration in the anti-obesity landscape is likely to persist well into the future as well.
North America Accounts for the Largest Share of the Market
The global market value is segmented across various geographies, including North America, Europe, Asia-Pacific, and Latin America. According to our projections, North America region accounts for the major anti-obesity drugs market share (70%), which is likely to remain the same during the forecast period. This is complemented by the availability of advanced healthcare infrastructure, significant investment in pharmaceutical research, and robust regulatory frameworks in this region that facilitate the development and approval of new therapies. It is worth highlighting that the market for anti-obesity drugs in Asia-Pacific is expected to grow at a relatively higher CAGR (~40%), till 2035.
Example Players in the Antibody Contract Manufacturing Market
- Boehringer Ingelheim
- Eli Lilly
- Novo Nordisk
- Other Drug Developers
- Eli Lilly
- Pfizer
- Regeneron
- Kallyope
- CinFina Pharma
- Viking Therapeutics
- AstraZeneca
- Novo Nordisk
- Roche
- Adocia
- Boehringer Ingelheim
- Zealand Pharma
- Hanmi Pharm
- Jiangsu Hengrui Pharmaceuticals
- Gmax Biopharma
- PegBio
- QL Biopharm
- Sciwind Biosciences
Anti-Obesity Market: Research Coverage
- Market Sizing and Opportunity Analysis: The report features a thorough analysis of the global anti-obesity drugs market, in terms of the key market segments, including [A] type of molecule [B] active compound used [C] mechanism of action [D] type of agonist [E] action pathway [F] route of administration and [G] geographical regions.
- Market Landscape: An in-depth assessment of the companies involved in anti-obesity market, based on several relevant parameters, such as including [A] status of development, [B] type of molecule, [C] mechanism of action [D] type of agonist [E] route of administration [F] dosage frequency and [G] type of therapy.
- Company Competitiveness Analysis: A comprehensive competitive analysis of ant-obesity drugs, examining factors, such as [A] company strength and [B] pipeline portfolio.
- Company Profiles: Detailed profiles of key service providers engaged in the anti-obesity drugs market, focused on [A] overview of the company, [B] financial information (if available), [C] pipeline portfolio, and [D] recent developments and an informed future outlook.
- Big Pharma Initiatives A review of the various anti-obesity initiatives undertaken by big pharma players, highlighting trends across various parameters [A] number of initiatives, [B] year of initiative, [C] type of initiative, [D] type of partnership and [D] type of expansion.
Key Questions Answered in this Report
- How many companies are currently engaged in this market?
- Which are the leading companies in this market?
- What factors are likely to influence the evolution of this market?
- What is the current and future market size?
- What is the CAGR of this market?
- How is the current and future market opportunity likely to be distributed across key market segments?
Reasons to Buy this Report
- The report provides a comprehensive market analysis, offering detailed revenue projections of the overall market and its specific sub-segments. This information is valuable to both established market leaders and emerging entrants.
- Stakeholders can leverage the report to gain a deeper understanding of the competitive dynamics within the market. By analyzing the competitive landscape, businesses can make informed decisions to optimize their market positioning and develop effective go-to-market strategies.
- The report offers stakeholders a comprehensive overview of the market, including key drivers, barriers, opportunities, and challenges. This information empowers stakeholders to stay abreast of market trends and make data-driven decisions to capitalize on growth prospects.
Additional Benefits
- Complimentary Excel Data Packs for all Analytical Modules in the Report
- 15% Free Content Customization
- Detailed Report Walkthrough Session with Research Team
- Free Updated report if the report is 6-12 months old or older
TABLE OF CONTENTS
1. BACKGROUND
- 1.1. Context
- 1.2. Project Objectives
2. RESEARCH METHODOLOGY
- 2.1. Chapter Overview
- 2.2. Research Assumptions
- 2.3. Project Methodology
- 2.4. Forecast Methodology
- 2.5. Robust Quality Control
- 2.6. Key Factors
- 2.6.1. Demographics
- 2.6.2. Economic Factors
- 2.6.3. Competitive Landscape
- 2.6.4. Government Regulations and Healthcare Policies
- 2.6.5. R&D Investment
- 2.6.6. Technological Factors
- 2.6.7. Industry Consolidation
- 2.6.8. Supply Chain
- 2.6.9. Market Access
- 2.6.10. COVID Impact / Related Factors
- 2.6.11. Market Access
- 2.6.12. COVID Impact / Related Factors
- 2.6.13. Patient Advocacy and Influence
- 2.6.14. Healthcare Infrastructure
3. MARKET DYNAMICS
- 3.1. Chapter Overview
- 3.2. Forecast Methodology
- 3.2.1. Top-Down Approach
- 3.2.2. Botton-Up Approach
- 3.2.3. Hybrid Approach
- 3.3. Market Assessment Framework
- 3.3.1. Total Addressable Market (TAM)
- 3.3.2. Serviceable Addressable Market (SAM)
- 3.3.3. Serviceable Obtainable Market (SOM)
- 3.3.4. Currently Acquired Market (CAM)
- 3.4. Forecasting Tools and Techniques
- 3.4.1. Qualitative Forecasting
- 3.4.2. Correlation
- 3.4.3. Regression
- 3.4.4. Extrapolation
- 3.4.5. Convergence
- 3.4.6. Sensitivity Analysis
- 3.4.7. Scenario Planning
- 3.4.8. Data Visualization
- 3.4.9. Time Series Analysis
- 3.4.10. Forecast Error Analysis
- 3.5. Key Considerations
- 3.5.1. Demographics
- 3.5.2. Government Regulations
- 3.5.3. Reimbursement Scenarios
- 3.5.4. Market Access
- 3.5.5. Supply Chain
- 3.5.6. Industry Consolidation
- 3.5.7. Pandemic / Unforeseen Disruptions Impact
- 3.6. Key Market Segments
- 3.7. Robust Quality Control
- 3.8. Limitations
4. ECONOMIC AND OTHER PROJECT SPECIFIC CONSIDERATIONS
- 4.1. Chapter Overview
- 4.2. Market Dynamics
- 4.2.1. Time Period
- 4.2.1.1. Historical Trends
- 4.2.1.2. Current and Forecasted Estimates
- 4.2.2. Currency Coverage
- 4.2.2.1. Overview of Major Currencies Affecting the Market
- 4.2.2.2. Impact of Currency Fluctuations on the Industry
- 4.2.3. Foreign Exchange Impact
- 4.2.3.1. Evaluation of Foreign Exchange Rates and Their Impact on Market
- 4.2.3.2. Strategies for Mitigating Foreign Exchange Risk
- 4.2.4. Recession
- 4.2.4.1. Historical Analysis of Past Recessions and Lessons Learnt
- 4.2.4.2. Assessment of Current Economic Conditions and Potential Impact on the Market
- 4.2.5. Inflation
- 4.2.5.1. Measurement and Analysis of Inflationary Pressures in the Economy
- 4.2.5.2. Potential Impact of Inflation on the Market Evolution
- 4.2.1. Time Period
5. EXECUTIVE SUMMARY
6. INTRODUCTION
- 6.1. Overview of Anti-Obesity Drugs
- 6.2. Health Risks Linked with Long-term Obesity
- 6.3. Currently Approved Anti-Obesity Drug Classes
- 6.4. Challenges Associated with Anti-Obesity Drugs
- 6.5. Future Perspectives
7. MARKET LANDSCAPE: ANTI-OBESITY DRUGS
- 7.1. Market Landscape: Anti-Obesity Drugs
- 7.1.1. Analysis by Status of Development
- 7.1.2. Analysis by Type of Molecule
- 7.1.3. Analysis by Mechanism of Action
- 7.1.4. Analysis by Type of Agonist
- 7.1.5. Analysis by Route of Administration
- 7.1.6. Analysis by Dosage Frequency
- 7.1.7. Analysis by Type of Therapy
- 7.2. Developer Landscape: Anti-Obesity Drugs
- 7.2.1. Analysis by Year of Establishment
- 7.2.2. Analysis by Company Size
- 7.2.3. Analysis by Location of Headquarters
- 7.2.4. Analysis by Headquarters (Country) and Status of Development
- 7.2.5. Most Active Developers: Analysis by Number of Drug Candidates
8. COMPANY PROFILES: ANTI-OBESITY DRUG DEVELOPERS BASED IN NORTH AMERICA
- 8.1. Chapter Overview
- 8.2. Detailed Company Profiles
- 8.2.1. Eli Lilly
- 8.2.1.1. Company Details
- 8.2.1.2. Pipeline Portfolio
- 8.2.1.3. Financial Details
- 8.2.1.4. Recent Developments and Future Outlook
- 8.2.2. Pfizer
- 8.2.3. Regeneron
- 8.2.1. Eli Lilly
- 8.3. Brief Company Profiles
- 8.3.1. CinFina Pharma
- 8.3.1.1. Company Details
- 8.3.1.2. Pipeline Portfolio
- 8.3.2. Kallyope
- 8.3.3. Viking Therapeutics
- 8.3.1. CinFina Pharma
9. COMPANY PROFILES: ANTI-OBESITY DRUG DEVELOPERS BASED IN EUROPE
- 9.1. Chapter Overview
- 9.2. Detailed Company Profiles
- 9.2.1. AstraZeneca
- 9.2.1.1. Company Details
- 9.2.1.2. Pipeline Portfolio
- 9.2.1.3. Financial Details
- 9.2.1.4. Recent Developments and Future Outlook
- 9.2.2. Novo Nordisk
- 9.2.3. Roche
- 9.2.1. AstraZeneca
- 9.3. Brief Company Profiles
- 9.3.1. Adocia
- 9.3.1.1. Company Details
- 9.3.1.2. Pipeline Portfolio
- 9.3.2. Boehringer Ingelheim
- 9.3.3. Zealand Pharma
- 9.3.1. Adocia
10. COMPANY PROFILES: ANTI-OBESITY DRUG DEVELOPERS BASED IN ASIA-PACIFIC AND REST OF THE WORLD
- 10.1. Chapter Overview
- 10.2. Detailed Company Profiles
- 10.2.1. Hanmi Pharmaceuticals
- 10.2.1.1. Company Details
- 10.2.1.2. Pipeline Portfolio
- 10.2.1.3. Financial Details
- 10.2.1.4. Recent Developments and Future Outlook
- 10.2.2. Jiangsu Hengrui Pharmaceuticals
- 10.2.1. Hanmi Pharmaceuticals
- 10.3. Brief Company Profiles
- 10.3.1. Gmax Biopharma
- 10.3.1.1. Company Details
- 10.3.1.2. Pipeline Portfolio
- 10.3.2. PegBio
- 10.3.3. QL Biopharm
- 10.3.4. Sciwind Biosciences
- 10.3.1. Gmax Biopharma
11. BIG PHARMA INITIATIVES
- 11.1. Methodology
- 11.2. Big Pharma Players: Anti-obesity focused Initiatives
- 11.2.1. Analysis of Big Pharma Players by Number of Initiatives
- 11.2.2. Analysis by Year of Initiative
- 11.2.3. Analysis by Big Pharma Player by Year of Initiative and Number of Initiatives
- 11.2.4. Analysis by Type of Initiative
- 11.2.5. Analysis by Year and Type of Initiative
- 11.2.6. Analysis by Big Pharma Player and Type of Initiative
- 11.2.7. Analysis by Big Pharma Player and Number of Partnerships
- 11.2.8. Analysis by Type of Partnership
- 11.2.9. Analysis by Type of Expansion
- 11.2.10. Analysis by Big Pharma Player by Region and Number of Initiatives
- 11.2.11. Benchmarking of Big Pharma Players
12. MARKET IMPACT ANALYSIS: DRIVERS, RESTRAINTS, OPPORTUNITIES AND CHALLENGES
- 12.1. Chapter Overview
- 12.2. Market Drivers
- 12.3. Market Restraints
- 12.4. Market Opportunities
- 12.5. Market Challenges
13. GLOBAL ANTI-OBESITY DRUGS MARKET
- 13.1. Forecast Methodology and Key Assumptions
- 13.2. Global Anti-Obesity Drugs Market, Historical Trends (Since 2019) and Forecasted Estimates (Till 2035) (USD Billion)
- 13.2.1. Scenario Analysis
- 13.2.1.1. Conservative Scenario
- 13.2.1.2. Optimistic Scenario
- 13.2.1. Scenario Analysis
- 13.3. Key Market Segmentations
14. ANTI-OBESITY DRUGS MARKET, BY TYPE OF MOLECULE
- 14.1. Anti-Obesity Drugs Market: Distribution by Type of Molecule
- 14.1.1. Anti-Obesity Drugs Market for Biologics, Historical Trends (since 2019) and Forecasted Estimates (till 2035)
- 14.1.2. Anti-Obesity Drugs Market for Small Molecules, Historical Trends (since 2019) and Forecasted Estimates (till 2035)
15. ANTI-OBESITY DRUGS MARKET, BY ACTIVE COMPOUND USED
- 15.1. Anti-Obesity Drugs Market: Distribution by Active Compound Used
- 15.1.1. Anti-Obesity Drugs Market for Tirzepatide, Historical Trends (since 2019) and Forecasted Estimates (till 2035)
- 15.1.2. Anti-Obesity Drugs Market for Semaglutide, Historical Trends (since 2019) and Forecasted Estimates (till 2035)
- 15.1.3. Anti-Obesity Drugs Market for Retatrutide, Historical Trends (since 2019) and Forecasted Estimates (till 2035)
- 15.1.4. Anti-Obesity Drugs Market for Survodutide, Historical Trends (since 2019) and Forecasted Estimates (till 2035)
- 15.1.5. Anti-Obesity Drugs Market for Cagrilintide and Semglutide, Historical Trends (since 2019) and Forecasted Estimates (till 2035)
- 15.1.6. Anti-Obesity Drugs Market for Orforglipron, Historical Trends (since 2019) and Forecasted Estimates (till 2035)
- 15.1.7. Anti-Obesity Drugs Market for Liraglutide, Historical Trends (since 2019) and Forecasted Estimates (till 2035)
- 15.1.8. Anti-Obesity Drugs Market for other active compounds used, Historical Trends (since 2019) and Forecasted Estimates (till 2035)
16. ANTI-OBESITY DRUGS MARKET, BY MECHANISM OF ACTION
- 16.1. Anti-Obesity Drugs Market: Distribution by Mechanism of Action
- 16.1.1. Anti-Obesity Drugs Market for GLP-1 Agonist / GIP Agonist, Historical Trends (since 2019) and Forecasted Estimates (till 2035)
- 16.1.2. Anti-Obesity Drugs Market for GLP-1 Agonist, Historical Trends (since 2019) and Forecasted Estimates (till 2035)
- 16.1.3. Anti-Obesity Drugs Market for GLP-1 Agonist / GCGR Agonist, Historical Trends (since 2019) and Forecasted Estimates (till 2035)
- 16.1.4. Anti-Obesity Drugs Market for GLP-1 / GCGR / GIP Agonist, Historical Trends (since 2019) and Forecasted Estimates (till 2035)
- 16.1.5. Anti-Obesity Drugs Market for GLP-1 Agonist / Amylin Analogue, Historical Trends (since 2019) and Forecasted Estimates (till 2035)
- 16.1.6. Anti-Obesity Drugs Market for Other Mechanisms of Action, Historical Trends (since 2019) and Forecasted Estimates (till 2035)
17. ANTI-OBESITY DRUGS MARKET, BY TYPE OF AGONIST
- 17.1. Anti-Obesity Drugs Market: Distribution by Type of Agonist
- 17.1.1. Anti-Obesity Drugs Market for Single-Agonist, Historical Trends (since 2019) and Forecasted Estimates (till 2035)
- 17.1.2. Anti-Obesity Drugs Market for Dual-Agonist, Historical Trends (since 2019) and Forecasted Estimates (till 2035)
- 17.1.3. Anti-Obesity Drugs Market for Tri-Agonist, Historical Trends (since 2019) and Forecasted Estimates (till 2035)
18. ANTI-OBESITY DRUGS MARKET, BY ACTION PATHWAY
- 18.1. Anti-Obesity Drugs Market: Distribution by Action Pathway
- 18.1.1. Anti-Obesity Drugs Market for Centrally Acting Drugs, Historical Trends (since 2019) and Forecasted Estimates (till 2035)
- 18.1.2. Anti-Obesity Drugs Market for Peripherally Acting Drugs, Historical Trends (since 2019) and Forecasted Estimates (till 2035)
- 18.1.3. Anti-Obesity Drugs Market for Centrally Acting and Peripherally Acting Drugs, Historical Trends (since 2019) and Forecasted Estimates (till 2035)
19. ANTI-OBESITY DRUGS MARKET, BY ROUTE OF ADMINISTRATION
- 19.1. Anti-Obesity Drugs Market: Distribution by Route of Administration
- 19.1.1. Anti-Obesity Drugs Market for Oral Administration, Historical Trends (since 2019) and Forecasted Estimates (till 2035)
- 19.1.2. Anti-Obesity Drugs Market for Parenteral Administration, Historical Trends (since 2019) and Forecasted Estimates (till 2035)
20. ANTI-OBESITY DRUGS MARKET, BY GEOGRAPHICAL REGIONS
- 20.1. Anti-Obesity Drugs Market: Distribution by Geographical Regions
- 20.1.1. Anti-Obesity Drugs Market in North America, Historical Trends (since 2019) and Forecasted Estimates (till 2035)
- 20.1.2. Anti-Obesity Drugs Market in Europe, Historical Trends (since 2019) and Forecasted Estimates (till 2035)
- 20.1.3. Anti-Obesity Drugs Market in Asia-Pacific, Historical Trends (since 2019) and Forecasted Estimates (till 2035)
- 20.1.4. Anti-Obesity Drugs Market in Latin America, Historical Trends (since 2019) and Forecasted Estimates (till 2035)
21. ANTI-OBESITY DRUGS MARKET, SALES FORECAST OF MARKETED AND PHASE III DRUGS
- 21.1. Marketed Drugs: Sales Forecast
- 21.1.1. Contrave / Mysimba (Naltrexone, Bupropion)
- 21.1.2. Feisumei (Beinaglutide)
- 21.1.3. Imcivree (Setmelanotide)
- 21.1.4. LOMAIRA (Phentermine Hydrochloride)
- 21.1.5. QSYMIA (Phentermine and Topiramate)
- 21.1.6. Saxenda (Liraglutide)
- 21.1.7. Wegovy / Ozempic (Semaglutide)
- 21.1.8. Zepbound / Mounjaro (Tirzepatide)
- 21.2. Phase III Drugs: Sales Forecast
- 21.2.1. BI 456906 (Survodutide)
- 21.2.2. CagriSema (Cagrilintide and Semaglutide)
- 21.2.3. HM11260C (Efpeglenatide)
- 21.2.4. HRS-9531
- 21.2.5. IBI362 (Mazdutide)
- 21.2.6. LM-008
- 21.2.7. LY3437943 (Retatrutide)
- 21.2.8. LY3502970 (Orforglipron)
- 21.2.9. TG103
- 21.2.10. Semaglutide 7.2 mg (Subcutaneous)
- 21.2.11. Semaglutide (Oral)
- 21.2.12. XW003
22. ANTI-OBESITY DRUGS MARKET, BY KEY PLAYERS
- 22.1. Anti-Obesity Drugs Market: Distribution of Key Players
23. APPENDIX 1: TABULATED DATA
24. APPENDIX 2: LIST OF COMPANIES AND ORGANIZATIONS
List of Tables
- Table 7.1 List of Anti-Obesity Drugs
- Table 7.2 List of Anti-Obesity Drug Developers
- Table 8.1 Eli Lily: Pipeline Portfolio
- Table 8.2 Eli Lily: Recent Developments and Future Outlook
- Table 8.3 Pfizer: Pipeline Portfolio
- Table 8.4 Pfizer: Recent Developments and Future Outlook
- Table 8.5 Regeneron: Pipeline Portfolio
- Table 8.6 Regeneron: Recent Developments and Future Outlook
- Table 8.7 CinFina Pharma: Pipeline Portfolio
- Table 8.8 Kallyope: Pipeline Portfolio
- Table 8.9 Viking Therapeutics: Pipeline Portfolio
- Table 9.1 AstraZeneca: Pipeline Portfolio
- Table 9.2 AstraZeneca: Recent Developments and Future Outlook
- Table 9.3 Novo Nordisk: Pipeline Portfolio
- Table 9.4 Novo Nordisk: Recent Developments and Future Outlook
- Table 9.5 Roche: Pipeline Portfolio
- Table 9.6 Roche: Recent Developments and Future Outlook
- Table 9.7 Adocia: Pipeline Portfolio
- Table 9.8 Boehringer Ingelheim: Pipeline Portfolio
- Table 9.9 Zealand Pharma: Pipeline Portfolio
- Table 10.1 Hanmi Pharmaceuticals: Pipeline Portfolio
- Table 10.2 Hanmi Pharmaceuticals: Recent Developments and Future Outlook
- Table 10.3 Jiangsu Hengrui Pharmaceuticals: Pipeline Portfolio
- Table 10.4 Jiangsu Hengrui Pharmaceuticals: Recent Developments and Future Outlook
- Table 10.5 Gmax Biopharma: Pipeline Portfolio
- Table 10.6 PegBio: Pipeline Portfolio
- Table 10.7 QL Biopharm: Pipeline Portfolio
- Table 10.8 Sciwind Biosciences: Pipeline Portfolio
- Table 11.1 Big Pharma Players: List of Anti-obesity Focused Initiatives
- Table 13.1 Anti-obesity Market: List of Forecasted Drugs
- Table 23.1 Anti-Obesity Drugs: Distribution by Status of Development
- Table 23.2 Anti-Obesity Drugs: Distribution by Type of Molecule
- Table 23.3 Anti-Obesity Drugs: Distribution by Mechanism of Action
- Table 23.4 Anti-Obesity Drugs: Distribution by Type of Agonist
- Table 23.5 Anti-Obesity Drugs: Distribution by Route of Administration
- Table 23.6 Anti-Obesity Drugs: Distribution by Dosage Frequency
- Table 23.7 Anti-Obesity Drugs: Distribution by Type of Therapy
- Table 23.8 Anti-Obesity Drug Developers: Distribution by Year of Establishment
- Table 23.9 Anti-Obesity Drug Developers: Distribution by Company Size
- Table 23.10 Anti-Obesity Drug Developers: Distribution by Location of Headquarters
- Table 23.11 Anti-Obesity Drug Developers: Distribution by Headquarters (Country) and Status of Development
- Table 23.12 Most Active Developers: Distribution by Number of Drugs
- Table 23.13 Eli Lilly: Annual Revenues (USD Billion)
- Table 23.14 Pfizer: Annual Revenues (USD Billion)
- Table 23.15 Regeneron: Annual Revenues (USD Billion)
- Table 23.16 AstraZeneca: Annual Revenues (USD Billion)
- Table 23.17 Novo Nordisk: Annual Revenues (DKK Billion)
- Table 23.18 Roche: Annual Revenues (CHF Billion)
- Table 23.19 Hanmi Pharmaceuticals: Annual Revenues (KRW Billion)
- Table 23.20 Jiangsu Hengrui Pharmaceuticals: Annual Revenues (CNY Billion)
- Table 23.21 Big Pharma Initiatives: Distribution of Big Pharma Players by Number of Initiatives
- Table 23.22 Big Pharma Initiatives: Distribution by Year of Initiative
- Table 23.23 Big Pharma Initiatives: Distribution by Big Pharma Players by Year and Number of Initiatives
- Table 23.24 Big Pharma Initiatives: Distribution by Type of Initiative
- Table 23.25 Big Pharma Initiatives: Distribution by Year and Type of Initiative
- Table 23.26 Big Pharma Initiatives: Distribution by Big Pharma Players and Type of Initiative
- Table 23.27 Big Pharma Initiatives: Distribution by Type of Partnership
- Table 23.28 Big Pharma Initiatives: Distribution by Type of Expansion
- Table 23.29 Big Pharma Initiatives: Distribution by Big Pharma Players by Region and Number of Initiatives
- Table 23.30 Global Anti-Obesity Drug Market, Historical Trends (Since 2019) and Forecasted Estimates (Till 2035)
- Table 23.31 Global Anti-obesity Drugs Market, till 2035 (USD Billion): Conservative Scenario
- Table 23.32 Global Anti-obesity Drugs Market, till 2035 (USD Billion): Optimistic Scenario
- Table 23.33 Anti-obesity Drugs Market: Distribution by Type of Molecule
- Table 23.34 Anti-obesity Market for Biologics, till 2035 (USD Billion)
- Table 23.35 Anti-obesity Market for Small Molecules, till 2035 (USD Billion)
- Table 23.36 Anti-obesity Drugs Market: Distribution by Active Compound Used
- Table 23.37 Anti-obesity Market for Tirzepatide, till 2035 (USD Billion)
- Table 23.38 Anti-obesity Market for Semaglutide, till 2035 (USD Billion)
- Table 23.39 Anti-obesity Market for Retatrutide, till 2035 (USD Billion)
- Table 23.40 Anti-obesity Market for Survodutide, till 2035 (USD Billion)
- Table 23.41 Anti-obesity Market for Cagrilintide / Semaglutide, till 2035 (USD Billion)
- Table 23.42 Anti-obesity Market for Orforglipron, till 2035 (USD Billion)
- Table 23.43 Anti-obesity Market for Liraglutide, till 2035 (USD Billion)
- Table 23.44 Anti-obesity Market for Other Compounds, till 2035 (USD Billion)
- Table 23.45 Anti-obesity Drugs Market: Distribution by Mechanism of Action
- Table 23.46 Anti-obesity Market for GLP-1 Agonist / GIP Agonist, till 2035 (USD Billion)
- Table 23.47 Anti-obesity Market for GLP-1 Agonist, till 2035 (USD Billion)
- Table 23.48 Anti-obesity Market for GLP-1 / GCGR / GIP Agonist, till 2035 (USD Billion)
- Table 23.49 Anti-obesity Market for GLP-1 Agonist / GCGR Agonist, till 2035 (USD Billion)
- Table 23.50 Anti-obesity Market for GLP-1 Agonist / Amylin Analogue, till 2035 (USD Billion)
- Table 23.51 Anti-obesity Market for Other Mechanisms of Action, till 2035 (USD Billion)
- Table 23.52 Anti-obesity Market: Distribution by Type of Agonist
- Table 23.53 Anti-obesity Market for Single-Agonist, till 2035 (USD Billion)
- Table 23.54 Anti-obesity Market for Dual-Agonist, till 2035 (USD Billion)
- Table 23.55 Anti-obesity Market for Tri-Agonist, till 2035 (USD Billion)
- Table 23.56 Anti-obesity Drugs Market: Distribution by Action Pathway
- Table 23.57 Anti-obesity Market for Centrally Acting Drugs, till 2035 (USD Billion)
- Table 23.58 Anti-obesity Market for Peripherally Acting Drugs, till 2035 (USD Billion)
- Table 23.59 Anti-obesity Market for Centrally and Peripherally Acting, till 2035 (USD Billion)
- Table 23.60 Anti-obesity Drugs Market: Distribution by Route of Administration
- Table 23.61 Anti-obesity Market for Parenteral Administration, till 2035 (USD Billion)
- Table 23.62 Anti-obesity Market for Oral Administration, till 2035 (USD Billion)
- Table 23.63 Anti-obesity Drugs Market: Distribution by Geography
- Table 23.64 Anti-obesity Market in North America, till 2035 (USD Billion)
- Table 23.65 Anti-obesity Market in North America (country-wise), till 2035 (USD Billion)
- Table 23.66 Anti-obesity Market in Europe, till 2035 (USD Billion)
- Table 23.67 Anti-obesity Market in Europe (country-wise), till 2035 (USD Billion)
- Table 23.68 Anti-obesity Market in Asia-Pacific, till 2035 (USD Billion)
- Table 23.69 Anti-obesity Market in Asia-Pacific (country-wise), till 2035 (USD Billion)
- Table 23.70 Anti-obesity Market in Latin America, till 2035 (USD Billion)
- Table 23.71 Anti-obesity Market in Latin America (country-wise), till 2035 (USD Billion)
- Table 23.72 Contrave / Mysimba (Naltrexone, Bupropion) Sales Forecast, till 2035 (USD Billion)
- Table 23.73 Feisumei (Beinaglutide) Sales Forecast, till 2035 (USD Billion)
- Table 23.74 Imcivree (Setmelanotide) Sales Forecast, till 2035 (USD Billion)
- Table 23.75 LOMAIRA (Phentermine Hydrochloride) Sales Forecast, till 2035 (USD Billion)
- Table 23.76 QSYMIA (Phentermine and Topiramate) Sales Forecast, till 2035 (USD Billion)
- Table 23.77 Saxenda (Liraglutide) Sales Forecast, till 2035 (USD Billion)
- Table 23.78 Wegovy / Ozempic (Semaglutide) Sales Forecast, till 2035 (USD Billion)
- Table 23.79 Zepbound / Mounjaro (Tirzepatide) Sales Forecast, till 2035 (USD Billion)
- Table 23.80 BI 456906 (Survodutide) Sales Forecast, till 2035 (USD Billion)
- Table 23.81 CagriSema (Cagrilintide and Semaglutide) Sales Forecast, till 2035 (USD Billion)
- Table 23.82 HM11260C (Efpeglenatide) Sales Forecast, till 2035 (USD Billion)
- Table 23.83 HRS-9531 Sales Forecast, till 2035 (USD Billion)
- Table 23.84 IBI362 (Mazdutide) Sales Forecast, till 2035 (USD Billion)
- Table 23.85 LM-008 Sales Forecast, till 2035 (USD Billion)
- Table 23.86 LY3437943 (Retatrutide) Sales Forecast, till 2035 (USD Billion)
- Table 23.87 LY3502970 (Orforglipron) Sales Forecast, till 2035 (USD Billion)
- Table 23.88 TG103 Sales Forecast, till 2035 (USD Billion)
- Table 23.89 Semaglutide 7.2 mg (Subcutaneous) Sales Forecast, till 2035 (USD Billion)
- Table 23.90 Semaglutide (Oral) Sales Forecast, till 2035 (USD Billion)
- Table 23.91 XW003 Sales Forecast, till 2035 (USD Billion)
- Table 23.92 Anti-obesity Drugs Market: Distribution by Key Players, 2020 (USD Billion)
- Table 23.93 Anti-obesity Drugs Market: Distribution by Key Players, Current Year (USD Billion)
- Table 23.94 Anti-obesity Drugs Market: Distribution by Key Players, 2035 (USD Billion)
List of Figures
- Figure 2.1 Research Methodology: Project Methodology
- Figure 2.2 Research Methodology: Forecast Methodology
- Figure 3.1 Lessons Learnt from Past Recessions
- Figure 6.1 Health Risks Linked with Long-term Obesity
- Figure 6.2 Currently Approved Anti-Obesity Drug Classes
- Figure 7.1 Anti-Obesity Drugs: Distribution by Status of Development
- Figure 7.2 Anti-Obesity Drugs: Distribution by Type of Molecule
- Figure 7.3 Anti-Obesity Drugs: Distribution by Mechanism of Action
- Figure 7.4 Anti-Obesity Drugs: Distribution by Type of Agonist
- Figure 7.5 Anti-Obesity Drugs: Distribution by Route of Administration
- Figure 7.6 Anti-Obesity Drugs: Distribution by Dosage Frequency
- Figure 7.7 Anti-Obesity Drugs: Distribution by Type of Therapy
- Figure 7.8 Anti-Obesity Drug Developers: Distribution by Year of Establishment
- Figure 7.9 Anti-Obesity Drug Developers: Distribution by Company Size
- Figure 7.10 Anti-Obesity Drug Developers: Distribution by Location of Headquarters
- Figure 7.11 Anti-Obesity Drug Developers: Distribution by Headquarters (Country) and Status of Development
- Figure 7.12 Most Active Developers: Distribution by Number of Drug Candidates
- Figure 8.1 Eli Lilly: Annual Revenues (USD Billion)
- Figure 8.2 Pfizer: Annual Revenues (USD Billion)
- Figure 8.3 Regeneron: Annual Revenues (USD Billion)
- Figure 9.1 AstraZeneca: Annual Revenues (USD Billion)
- Figure 9.2 Novo Nordisk: Annual Revenues (DKK Billion)
- Figure 9.3 Roche: Annual Revenues (CHF Billion)
- Figure 10.1 Hanmi Pharmaceuticals: Annual Revenues (KRW Billion)
- Figure 10.2 Jiangsu Hengrui Pharmaceuticals: Annual Revenues (CNY Billion)
- Figure 11.1 Big Pharma Initiatives: Distribution of Big Pharma Players by Number
of Initiatives
- Figure 11.2 Big Pharma Initiatives: Distribution by Year of Initiative
Figure 11.3Big Pharma Initiatives: Distribution by Big Pharma Players by Year and Number of Initiatives
- Figure 11.4 Big Pharma Initiatives: Distribution by Type of Initiative
- Figure 11.5 Big Pharma Initiatives: Distribution by Year and Type of Initiative
- Figure 11.6 Big Pharma Initiatives: Distribution by Big Pharma Players and Type of Initiative
- Figure 11.7 Big Pharma Initiatives: Distribution by Type of Partnership
- Figure 11.8 Big Pharma Initiatives: Distribution by Type of Expansion
- Figure 11.9 Big Pharma Initiatives: Distribution of Big Pharma Players by Region and Number of Initiatives
- Figure 11.10 Benchmarking of Big Pharma Players
- Figure 12.1 Anti-Obesity Drugs: Market Drivers
- Figure 12.2 Anti-Obesity Drugs: Market Restraints
- Figure 12.3 Anti-Obesity Drugs: Market Opportunities
- Figure 12.4 Anti-Obesity Drugs: Market Challenges
- Figure 13.1 Global Anti-Obesity Drug Market, Historical Trends (Since 2019) and Forecasted Estimates (till 2035)
- Figure 13.2 Global Anti-obesity Drugs Market, till 2035 (USD Billion) (USD Billion): Conservative Scenario
- Figure 13.3 Global Anti-obesity Drugs Market, till 2035 (USD Billion) (USD Billion): Optimistic Scenario
- Figure 14.1 Anti-obesity Drugs Market: Distribution by Type of Molecule
- Figure 14.2 Anti-obesity Market for Biologics, till 2035 (USD Billion)
- Figure 14.3 Anti-obesity Market for Small Molecules, till 2035 (USD Billion)
- Figure 15.1 Anti-obesity Drugs Market: Distribution by Active Compound Used
- Figure 15.2 Anti-obesity Market for Tirzepatide, till 2035 (USD Billion)
- Figure 15.3 Anti-obesity Market for Semaglutide, till 2035 (USD Billion)
- Figure 15.4 Anti-obesity Market for Retatrutide, till 2035 (USD Billion)
- Figure 15.5 Anti-obesity Market for Survodutide, till 2035 (USD Billion)
- Figure 15.6 Anti-obesity Market for Cagrilintide / Semaglutide, till 2035 (USD Billion)
- Figure 15.7 Anti-obesity Market for Orforglipron, till 2035 (USD Billion)
- Figure 15.8 Anti-obesity Market for Liraglutide, till 2035 (USD Billion)
- Figure 15.9 Anti-obesity Market for Other Compounds, till 2035 (USD Billion)
- Figure 16.1 Anti-obesity Drugs Market: Distribution by Mechanism of Action
- Figure 16.2 Anti-obesity Market for GLP-1 Agonist / GIP Agonist, till 2035 (USD Billion)
- Figure 16.3 Anti-obesity Market for GLP-1 Agonist, till 2035 (USD Billion)
- Figure 16.4 Anti-obesity Market for GLP-1 / GCGR / GIP Agonist, till 2035 (USD Billion)
- Figure 16.5 Anti-obesity Market for GLP-1 Agonist / GCGR Agonist, till 2035 (USD Billion)
- Figure 16.6 Anti-obesity Market for GLP-1 Agonist / Amylin Analogue, till 2035 (USD Billion)
- Figure 16.7 Anti-obesity Market for Other Mechanisms of Action, till 2035 (USD Billion)
- Figure 17.1 Anti-obesity Market: Distribution by Type of Agonist
- Figure 17.2 Anti-obesity Market for Single-Agonist, till 2035 (USD Billion)
- Figure 17.3 Anti-obesity Market for Dual-Agonist, till 2035 (USD Billion)
- Figure 17.4 Anti-obesity Market for Tri-Agonist, till 2035 (USD Billion)
- Figure 18.1 Anti-obesity Drugs Market: Distribution by Action Pathway
- Figure 18.2 Anti-obesity Market for Centrally Acting Drugs, till 2035 (USD Billion)
- Figure 18.3 Anti-obesity Market for Peripherally Acting Drugs, till 2035 (USD Billion)
- Figure 18.4 Anti-obesity Market for Centrally and Peripherally Acting Drugs, till 2035 (USD Billion)
- Figure 19.1 Anti-obesity Drugs Market: Distribution by Route of Administration
- Figure 19.2 Anti-obesity Market for Parenteral Administration, till 2035 (USD Billion)
- Figure 19.3 Anti-obesity Market for Oral Administration, till 2035 (USD Billion)
- Figure 20.1 Anti-obesity Drugs Market: Distribution by Geographical Regions
- Figure 20.2 Anti-obesity Market in North America, till 2035 (USD Billion)
- Figure 20.3 Anti-obesity Market in North America (country-wise), till 2035 (USD Billion)
- Figure 20.4 Anti-obesity Market in Europe, till 2035 (USD Billion)
- Figure 20.5 Anti-obesity Market in Europe (country-wise), till 2035 (USD Billion)
- Figure 20.6 Anti-obesity Market in Asia-Pacific, till 2035 (USD Billion)
- Figure 20.7 Anti-obesity Market in Asia-Pacific (country-wise), till 2035 (USD Billion)
- Figure 20.8 Anti-obesity Market in Latin America, till 2035 (USD Billion)
- Figure 20.9 Anti-obesity Market in Latin America (country-wise), till 2035 (USD Billion)
- Figure 21.1 Contrave / Mysimba (Naltrexone, Bupropion) Sales Forecast, till 2035 (USD Billion)
- Figure 21.2 Feisumei (Beinaglutide) Sales Forecast, till 2035 (USD Billion)
- Figure 21.3 Imcivree (Setmelanotide) Sales Forecast, till 2035 (USD Billion)
- Figure 21.4 LOMAIRA (Phentermine Hydrochloride) Sales Forecast, till 2035 (USD Billion)
- Figure 21.5 QSYMIA (Phentermine and Topiramate) Sales Forecast, till 2035 (USD Billion)
- Figure 21.6 Saxenda (Liraglutide) Sales Forecast, till 2035 (USD Billion)
- Figure 21.7 Wegovy / Ozempic (Semaglutide) Sales Forecast, till 2035 (USD Billion)
- Figure 21.8 Zepbound / Mounjaro (Tirzepatide) Sales Forecast, till 2035 (USD Billion)
- Figure 21.9 BI 456906 (Survodutide) Sales Forecast, till 2035 (USD Billion)
- Figure 21.10 CagriSema (Cagrilintide and Semaglutide) Sales Forecast, till 2035 (USD Billion)
- Figure 21.11 HM11260C (Efpeglenatide) Sales Forecast, till 2035 (USD Billion)
- Figure 21.12 HRS-9531 Sales Forecast, till 2035 (USD Billion)
- Figure 21.13 IBI362 (Mazdutide) Sales Forecast, till 2035 (USD Billion)
- Figure 21.14 LM-008 Sales Forecast, till 2035 (USD Billion)
- Figure 21.15 LY3437943 (Retatrutide) Sales Forecast, till 2035 (USD Billion)
- Figure 21.16 LY3502970 (Orforglipron) Sales Forecast, till 2035 (USD Billion)
- Figure 21.17 TG103 Sales Forecast, till 2035 (USD Billion)
- Figure 21.18 Semaglutide 7.2 mg (Subcutaneous) Sales Forecast, till 2035 (USD Billion)
- Figure 21.19 Semaglutide (Oral) Sales Forecast, till 2035 (USD Billion)
- Figure 21.20 XW003 Sales Forecast, till 2035 (USD Billion)
- Figure 22.1 Anti-obesity Drugs Market: Distribution by Key Players, 2020 (USD Billion)
- Figure 22.2 Anti-obesity Drugs Market: Distribution by Key Players, Current Year (USD Billion)
- Figure 22.3 Anti-obesity Drugs Market: Distribution by Key Players, 2035 (USD Billion)
 抗肥胖药物市场:依产品类型、剂型、给药途径及最终用户划分-2026-2032年全球市场预测
 抗肥胖药物市场分析及至2035年预测:类型、产品、服务、技术、组件、应用、剂型、最终用户、设备、模式
 抗肥胖药物市场规模、份额、趋势及预测(依药物类别、药物类型、通路及地区划分,2026-2034年)
 抗肥胖药物市场-全球产业规模、份额、趋势、机会与预测:按作用机制、药物类型、地区和竞争格局划分,2021-2031年
 抗肥胖药物市场-2026-2031年预测
 抗肥胖药的全球市场:治疗类型·药物类型·作用机制·给药途径·通路·各地区 (~2035年)
 抗肥胖药物市场(依药物类别、药物类型和地区划分)
 2021 - 2031 年抗肥胖药物市场规模及预测、全球及地区份额、趋势及成长机会分析报告,涵盖:按类型、药物类别、应用、给药途径、配销通路和地理划分
 抗肥胖药物市场规模、份额、成长分析(按药物类型、作用、剂量和地区划分)- 产业预测,2025 年至 2032 年
 抗肥胖药物市场、机会、成长动力、产业趋势分析与预测,2024-2032