


 |
市场调查报告书
商品编码
1993586
超材料市场(至 2035 年):依超材料类型、产品形式、应用、企业规模、终端用户产业和地区划分:产业趋势和全球预测Metamaterials Market, till 2035: Distribution by Type of Metamaterial, Product Form, Applications, Type of Enterprise, End Use Industry, and Geographical Regions: Industry Trends and Global Forecasts |
||||||
超材料市场展望
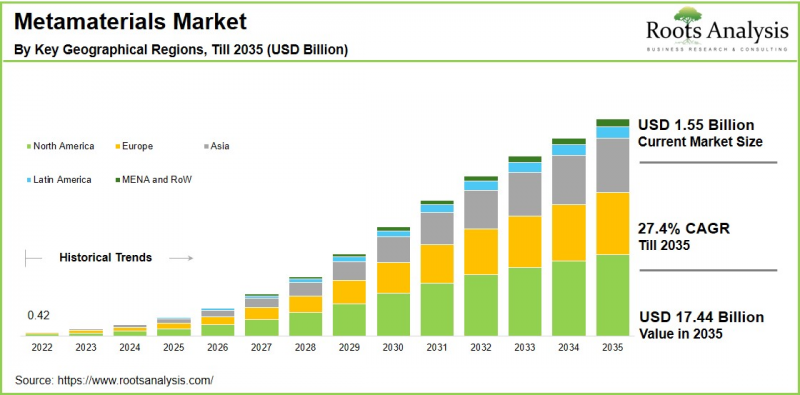
预计到 2035 年,全球超材料市场将以 27.4% 的复合年增长率增长,从目前的 15.5 亿美元增长至 174.4 亿美元。
自 1888 年问世以来,金属一直是天线设计中的关键材料。然而,传统金属天线在跨多个频段高效工作的能力有限,这通常会导致能量损失和性能受限。 为了克服这些局限性,业界已转向开发专门用于操控电磁波(包括无线电波和可见光)的超材料。
超材料是透过週期性排列奈米级和微米级结构而製成的,这些结构具有独特的波吸收、折射或偏转特性。 其高精度、模组化架构和先进功能使其在汽车、航空航太和国防等领域中越来越广泛的应用,这些领域对可控的高性能应用至关重要。此外,超材料能够在很宽的频段范围内有效运作,使其特别适用于下一代无线通讯系统,包括 5G 和新兴的 6G 网路。 超材料市场正在成为全球向创新和技术进步转型以提高效率的重要驱动力。在超材料製造过程中使用各种原材料,进一步扩展了其功能,开闢了新的应用领域,并提升了其在多个高科技行业的战略重要性。
高阶主管策略洞察
推动超材料市场成长的关键市场驱动因素
超材料市场的成长主要受通讯、航太、国防和汽车产业对先进电磁波控制日益增长的需求所驱动。包括 5G 和新兴的 6G 基础设施在内的下一代无线网路的快速扩张,显着加速了对能够提高讯号强度、频宽效率和天线小型化的高性能材料的需求。
此外,国防现代化计画投资的增加也推动了超材料在雷达吸收和先进感测应用的应用。 在航空航太和汽车领域,轻量化、紧凑化和节能化零件的需求正进一步推动市场扩张。此外,奈米製造技术和材料科学的持续进步,以及研发活动的日益活跃,也促进了该市场的成长。
超材料市场:产业竞争格局
超材料市场是一个高度分散的市场,既有成熟的製造商,也有新兴企业。老牌企业和新企业都在积极推动技术进步和市场扩张。尤其值得一提的是,超过70%的主要企业提供以超材料为基础的产品,反映出这些先进材料的商业化进程正在不断加速。 此外,这些公司中有 50% 为航空航天和国防工业提供产品,近 40% 的製造商为各种终端用户行业提供基于超材料的天线和雷达。
超材料的演进:产业新趋势
在超材料产业,材料科学、奈米製造和电磁工程的快速发展正在推动几个新趋势的涌现。 其中一个关键趋势是将超材料越来越多地整合到下一代通讯系统中,特别是 5G 和 6G 网络,以提高讯号效率并实现天线小型化。人们对可调谐和可编程超材料的兴趣也日益浓厚,这类超材料能够即时动态地控制电磁特性。这将有助于其在智慧感测器、自适应光学和先进成像系统等领域的扩展应用。此外,轻量化、小型和节能型组件的开发正在加速其在航空航太、国防和汽车产业的应用。
区域分析:亚太地区引领超材料市场
根据我们的分析,亚太地区今年将占超材料市场最大的占有率。这主要得益于该地区强大的製造业基础、快速的技术应用以及对先进通讯和国防能力的持续投资。此外,该地区在5G部署方面处于领先地位,并积极推进下一代6G技术的研究,从而对能够提升天线效率的高性能材料产生了显着需求。中国、日本、韩国和印度等国家都受惠于其强大的半导体製造生态系统、政府主导的研发计画以及不断扩展的航空航太和国防计画。此外,主要电子产品製造商的存在以及研究机构与产业参与者之间日益密切的合作,也进一步加速了该地区的商业化进程。
超材料市场面临的主要挑战
阻碍超材料应用的主要挑战包括高昂的研发成本,以及奈米和微米尺度上复杂的设计和製造流程。此外,缺乏超材料产品的标准化测试框架和监管指南可能会减缓该市场的成长。终端用户认知度低以及整合到现有系统中的复杂性也是限制其普及的因素。此外,先进原材料和专用製造设备的成本相对较高,尤其是在价格敏感型应用领域,这可能会限制市场成长。
超材料市场:主要市场区隔
超材料类型
- 电磁超材料
- 光学超材料
- 热超材料
- 声学超材料
- 其他超材料
产品形式
- 薄膜
- 块体材料
应用
- 天线和雷达
- 超透镜
- 时钟元件
- 其他
公司关键字
- 大型企业
- 中小企业
终端用户产业
- 消费性电子
- 航空航太与国防
- 汽车
- 能源和电力
- 医疗
- 其他行业
地区
- 北美洲
- 美国
- 加拿大
- 其他北美洲国家
- 欧洲
- 德国
- 英国
- 法国
- 西班牙
- 义大利
- 其他欧洲国家
- 亚洲
- 中国
- 日本
- 印度
- 韩国
- 其他亚洲国家
- 拉丁美洲
- 巴西
- 阿根廷
- 其他拉丁美洲国家
- 中东、非洲等地区
- 澳大利亚
- 土耳其
- 沙乌地阿拉伯
- 英国阿联酋
- 以色列
- 埃及
- 纽西兰
超材料市场主要公司
- ALCAN Systems
- Echodyne
- Kymeta
- Meta Materials
- MetaLenz
- MinWave
- Moxtek
- Multiwave Technologies
- Fractal Antenna Systems
- Murata Manufacturing
- Matrix (Guangzhou) Metamaterials
超材料市场:报告范围
本超材料市场报告深入分析以下几个面向:
- 市场规模与机会分析:对超材料市场进行详细分析,重点在于以下关键市场细分:[A] 超材料类型,[B] 产品形式,[C] 应用,[D] 公司形式,[E] 最终用户产业,以及 [F] 地区。
- 竞争格局:基于相关参数(例如 [A] 成立年份、[B] 公司规模、[C] 总部所在地和 [D] 所有权结构)对进入超材料市场的公司进行全面分析。
- 公司简介:详细介绍进入超材料市场的主要公司,包括 [A] 总部所在地、[B] 公司规模、[C] 企业理念、[D] 业务运营、[E] 管理团队、[F] 联繫方式、[G] 财务资讯、[H] 业务板块、[I] 产品和技术组合、[J] 近期发展以及未来财务资讯。
- 专利分析:基于相关参数(例如 [A] 专利类型、[B] 专利公开年份、[C] 专利年龄和 [D] 主要公司)对超材料领域已提交和已註册的专利进行深入分析。
目录
第一章:专案概述
第二章:研究方法
第三章:市场动态
第四章:宏观经济指标
第五章:摘要整理
第六章:引言
- 超材料概述
- 超材料的类型
- 超材料的优势
- 超材料的主要应用领域
- 超材料的未来发展趋势
第七章:市场格局:主要超材料製造商
第八章:企业竞争力
分析- 研究方法与关键参数
- 评分标准
- 主要超材料製造商:2x2 矩阵
- 主要公司
第9章 企业简介
- ALCAN Systems
- Echodyne
- Kymeta
- Meta Materials
- MetaLenz
- MinWave
- Moxtek
- Multiwave Technologies
- Fractal Antenna Systems
- Murata Manufacturing
- Matrix(广州)Metamaterials
第 10 章:大趋势
第11章价值链分析
第十二章:伙伴关係与合作
- 章节概要
- 伙伴关係模式
- 元材料:伙伴关係与合作
第十三章:专利分析
第十四章:出版品分析
第十五章:市场影响分析
第十六章:全球超材料市场
第十七章:依超材料类型划分的市场机遇
第十八章:依材料类型划分的市场机遇
第十九章:依产品形态划分的市场机遇
第二十章:依应用划分的市场机遇
第二十一章:依实体类型划分的市场机遇
第二十二章:依最终用户产业划分的市场机遇
第二十三章:依主要地区划分的市场机遇
第二十四章:附录一:表格数据
第二十五章:附录二:公司与组织列表
Metamaterials Market Outlook
As per Roots Analysis, the global metamaterials market size is estimated to grow from USD 1.55 billion in current year to USD 17.44 billion by 2035, at a CAGR of 27.4% during the forecast period, till 2035.
Metals have served as a crucial material for antenna design since their introduction in 1888. However, conventional metallic antennas are limited in their ability to efficiently operate across multiple frequencies, often resulting in energy losses and constrained performance. To address these limitations, the industry has advanced toward the development of metamaterials, specifically designed to manipulate electromagnetic waves, including radio waves and visible light.
Metamaterials are fabricated using periodic arrangements of nano and microscale structures that exhibit unique wave-absorbing, refracting, or redirecting properties. Their high precision, modular architecture, and advanced functional capabilities have driven adoption across sectors such as automotive, aerospace, and defense, where controlled and high-performance applications are critical. Further, the ability of metamaterials to function effectively across a broad frequency spectrum makes them particularly suitable for next-generation wireless communication systems, including 5G and emerging 6G networks.
The metamaterials market is emerging as a key driver in the global transition toward innovation and technological advancement aimed at enhancing efficiency. The use of diverse raw materials in metamaterial fabrication has further expanded their functional capabilities, unlocking new application areas and reinforcing their strategic importance across multiple high-technology industries.
Strategic Insights for Senior Leaders
Key Drivers Propelling Growth of Metamaterials Market
The growth of the metamaterials market is primarily driven by the increasing demand for advanced electromagnetic wave control across telecommunications, aerospace, defense, and automotive industries. The rapid expansion of next-generation wireless networks, including 5G and emerging 6G infrastructure, has significantly accelerated the need for high-performance materials capable of enhancing signal strength, bandwidth efficiency, and antenna miniaturization.
Additionally, rising investments in defense modernization programs are fostering the adoption of metamaterials for radar absorption and advanced sensing applications. In the aerospace and automotive sectors, the push toward lightweight, compact, and energy-efficient components is further supporting market expansion. Moreover, continuous advancements in nanofabrication techniques and material science, coupled with growing research and development initiatives, are also contributing to the growth of this market.
Metamaterials Market: Competitive Landscape of Companies in this Industry
The metamaterials market is highly fragmented, characterized by the presence of both established manufacturers and emerging entrants. Both established industry players and new entrants are actively contributing to technological advancements and market expansion. Notably, more than 70% of leading manufacturers offer metamaterial-based products, reflecting the growing commercialization of these advanced materials. Further, 50% of these companies supply products for the aerospace and defense industry and nearly 40% of manufacturers provide metamaterial-based antennas and radars for various end-use industries.
Metamaterials Evolution: Emerging Trends in the Industry
The metamaterials industry is witnessing several emerging trends driven by rapid advancements in material science, nanofabrication, and electromagnetic engineering. A key trend is the increasing integration of metamaterials into next-generation communication systems, particularly for 5G and 6G networks, to enhance signal efficiency, and antenna miniaturization. There is also growing interest in tunable and programmable metamaterials that enable dynamic control of electromagnetic properties in real time. This helps in expanding their applicability in smart sensors, adaptive optics, and advanced imaging systems. Further, the development of lightweight, compact, and energy-efficient components is accelerating adoption across aerospace, defense, and automotive sectors.
Regional Analysis: Asia-Pacific Lead the Metamaterials Market
According to our analysis, in the current year, the metamaterials market in Asia-Pacific captures the largest share. This is due to its strong manufacturing base, rapid technological adoption, and sustained investments in advanced communications and defense capabilities. Further, the region has been at the forefront of 5G deployment and is actively progressing toward next-generation 6G research, creating significant demand for high-performance materials that enhance antenna efficiency. Countries such as China, Japan, South Korea, and India benefit from robust semiconductor manufacturing ecosystems, strong government R&D initiatives, and expanding aerospace and defense programs. Additionally, the presence of leading electronics manufacturers and increasing collaborations between research institutions and industry players further accelerate commercialization in this region.
Key Challenges in Metamaterials Market
Key challenges hindering the adoption of metamaterials include high research and development costs, coupled with complex design and fabrication processes at the nano - and microscale levels. Further, the lack of standardized testing frameworks and regulatory guidelines for metamaterial-based products may slow the growth of this market. Further, limited awareness among end users, along with integration complexities in existing systems, further constrain adoption. Moreover, the relatively high cost of advanced raw materials and specialized manufacturing equipment can restrict market growth, particularly in price-sensitive applications.
Metamaterials Market: Key Market Segmentation
Type of Metamaterial
- Electromagnetic Metamaterial
- Optical Metamaterial
- Thermal Metamaterial
- Acoustic Metamaterial
- Other Metamaterials
Product Form
- Thin Films
- Bulk Materials
Application
- Antenna and Radar
- Super Lens
- Clocking Devices
- Other Applications
Type of Enterprise
- Large Enterprises
- Small and Medium Enterprises (SMEs)
End Use Industry
- Consumer Electronics
- Aerospace and Defense
- Automotive
- Energy and Power
- Medical
- Other Industries
Geographical Regions
- North America
- US
- Canada
- Mexico
- Europe
- Germany
- UK
- France
- Spain
- Italy
- Rest of Europe
- Asia
- China
- Japan
- India
- South Korea
- Rest of Asia
- Latin America
- Brazil
- Argentina
- Rest of Latin America
- Middle East and Africa, and Rest of the World
- Australia
- Turkey
- Saudi Arabia
- United Arab Emirates
- Israel
- Egypt
- New Zealand
Example Players in Metamaterials Market
- ALCAN Systems
- Echodyne
- Kymeta
- Meta Materials
- MetaLenz
- MinWave
- Moxtek
- Multiwave Technologies
- Fractal Antenna Systems
- Murata Manufacturing
- Matrix (Guangzhou) Metamaterials
Metamaterials Market: Report Coverage
The report on the metamaterials market features insights on various sections, including:
- Market Sizing and Opportunity Analysis: An in-depth analysis of the metamaterials market, focusing on key market segments, including [A] type of metamaterial, [B] product form, [C] applications, [D] type of enterprise, [E] end use industry, and [F] geographical regions.
- Competitive Landscape: A comprehensive analysis of the companies engaged in the metamaterials market, based on several relevant parameters, such as [A] year of establishment, [B] company size, [C] location of headquarters and [D] ownership structure.
- Company Profiles: Elaborate profiles of prominent players engaged in the metamaterials market, providing details on [A] location of headquarters, [B] company size, [C] company mission, [D] company footprint, [E] management team, [F] contact details, [G] financial information, [H] operating business segments, [I] product / technology portfolio, [J] recent developments, and an informed future outlook.
- Patent Analysis: An insightful analysis of patents filed / granted in the metamaterials domain, based on relevant parameters, including [A] type of patent, [B] patent publication year, [C] patent age and [D] leading players.
Key Questions Answered in this Report
- What is the current and future market size?
- Who are the leading companies in this market?
- What are the growth drivers that are likely to influence the evolution of this market?
- What are the key partnership and funding trends shaping this industry?
- Which region is likely to grow at higher CAGR till 2035?
- How is the current and future market opportunity likely to be distributed across key market segments?
Reasons to Buy this Report
- Detailed Market Analysis: The report provides a comprehensive market analysis, offering detailed revenue projections of the overall market and its specific sub-segments. This information is valuable to both established market leaders and emerging entrants.
- In-depth Analysis of Trends: Stakeholders can leverage the report to gain a deeper understanding of the competitive dynamics within the market. Each report maps ecosystem activity across partnerships, funding, and patent landscapes to reveal growth hotspots and white spaces in the industry.
- Opinion of Industry Experts: The report features extensive interviews and surveys with key opinion leaders and industry experts to validate market trends mentioned in the report.
- Decision-ready Deliverables: The report offers stakeholders with strategic frameworks (Porter's Five Forces, value chain, SWOT), and complimentary Excel / slide packs with customization support.
Additional Benefits
- Complimentary Dynamic Excel Dashboards for Analytical Modules
- Exclusive 15% Free Content Customization
- Personalized Interactive Report Walkthrough with Our Expert Research Team
- Free Report Updates for Versions Older than 6-12 Months
TABLE OF CONTENTS
1. PROJECT OVERVIEW
- 1.1. Context
- 1.2. Project Objectives
2. RESEARCH METHODOLOGY
- 2.1. Chapter Overview
- 2.2. Research Assumptions
- 2.2.1. Market Landscape and Market Trends
- 2.2.2. Market Forecast and Opportunity Analysis
- 2.2.3. Comparative Analysis
- 2.3. Database Building
- 2.3.1. Data Collection
- 2.3.2. Data Validation
- 2.3.3. Data Analysis
- 2.4. Project Methodology
- 2.4.1. Secondary Research
- 2.4.1.1. Annual Reports
- 2.4.1.2. Academic Research Papers
- 2.4.1.3. Company Websites
- 2.4.1.4. Investor Presentations
- 2.4.1.5. Regulatory Filings
- 2.4.1.6. White Papers
- 2.4.1.7. Industry Publications
- 2.4.1.8. Conferences and Seminars
- 2.4.1.9. Government Portals
- 2.4.1.10. Media and Press Releases
- 2.4.1.11. Newsletters
- 2.4.1.12. Industry Databases
- 2.4.1.13. Roots Proprietary Databases
- 2.4.1.14. Paid Databases and Sources
- 2.4.1.15. Social Media Portals
- 2.4.1.16. Other Secondary Sources
- 2.4.2. Primary Research
- 2.4.2.1. Types of Primary Research
- 2.4.2.1.1. Qualitative Research
- 2.4.2.1.2. Quantitative Research
- 2.4.2.1.3. Hybrid Approach
- 2.4.2.2. Advantages of Primary Research
- 2.4.2.3. Techniques for Primary Research
- 2.4.2.3.1. Interviews
- 2.4.2.3.2. Surveys
- 2.4.2.3.3. Focus Groups
- 2.4.2.3.4. Observational Research
- 2.4.2.3.5. Social Media Interactions
- 2.4.2.4. Key Opinion Leaders Considered in Primary Research
- 2.4.2.4.1. Company Executives (CXOs)
- 2.4.2.4.2. Board of Directors
- 2.4.2.4.3. Company Presidents and Vice Presidents
- 2.4.2.4.4. Research and Development Heads
- 2.4.2.4.5. Technical Experts
- 2.4.2.4.6. Subject Matter Experts
- 2.4.2.4.7. Scientists
- 2.4.2.4.8. Doctors and Other Healthcare Providers
- 2.4.2.5. Ethics and Integrity
- 2.4.2.5.1. Research Ethics
- 2.4.2.5.2. Data Integrity
- 2.4.2.1. Types of Primary Research
- 2.4.3. Analytical Tools and Databases
- 2.4.1. Secondary Research
- 2.5. Robust Quality Control
3. MARKET DYNAMICS
- 3.1. Chapter Overview
- 3.2. Forecast Methodology
- 3.2.1. Top-down Approach
- 3.2.2. Bottom-up Approach
- 3.2.3. Hybrid Approach
- 3.3. Market Assessment Framework
- 3.3.1. Total Addressable Market (TAM)
- 3.3.2. Serviceable Addressable Market (SAM)
- 3.3.3. Serviceable Obtainable Market (SOM)
- 3.3.4. Currently Acquired Market (CAM)
- 3.4. Forecasting Tools and Techniques
- 3.4.1. Qualitative Forecasting
- 3.4.2. Correlation
- 3.4.3. Regression
- 3.4.4. Extrapolation
- 3.4.5. Convergence
- 3.4.6. Sensitivity Analysis
- 3.4.7. Scenario Planning
- 3.4.8. Data Visualization
- 3.4.9. Time Series Analysis
- 3.4.10. Forecast Error Analysis
- 3.5. Key Considerations
- 3.5.1. Demographics
- 3.5.2. Government Regulations
- 3.5.3. Reimbursement Scenarios
- 3.5.4. Market Access
- 3.5.5. Supply Chain
- 3.5.6. Industry Consolidation
- 3.5.7. Pandemic / Unforeseen Disruptions Impact
- 3.6. Limitations
4. MACRO-ECONOMIC INDICATORS
- 4.1. Chapter Overview
- 4.2. Market Dynamics
- 4.2.1. Time Period
- 4.2.1.1. Historical Trends
- 4.2.1.2. Current and Forecasted Estimates
- 4.2.2. Currency Coverage
- 4.2.2.1. Major Currencies Affecting the Market
- 4.2.2.2. Factors Affecting Currency Fluctuations
- 4.2.2.3. Impact of Currency Fluctuations on the Industry
- 4.2.3. Foreign Currency Exchange Rate
- 4.2.3.1. Impact of Foreign Exchange Rate Volatility on the Market
- 4.2.3.2. Strategies for Mitigating Foreign Exchange Risk
- 4.2.4. Recession
- 4.2.4.1. Assessment of Current Economic Conditions and Potential Impact on the Market
- 4.2.4.2. Historical Analysis of Past Recessions and Lessons Learnt
- 4.2.5. Inflation
- 4.2.5.1. Measurement and Analysis of Inflationary Pressures in the Economy
- 4.2.5.2. Potential Impact of Inflation on the Market Evolution
- 4.2.6. Interest Rates
- 4.2.6.1. Interest Rates and Their Impact on the Market
- 4.2.6.2. Strategies for Managing Interest Rate Risk
- 4.2.7. Commodity Flow Analysis
- 4.2.7.1. Type of Commodity
- 4.2.7.2. Origins and Destinations
- 4.2.7.3. Value and Weights
- 4.2.7.4. Modes of Transportation
- 4.2.8. Global Trade Dynamics
- 4.2.8.1. Import Scenario
- 4.2.8.2. Export Scenario
- 4.2.8.3. Trade Policies
- 4.2.8.4. Strategies for Mitigating the Risks Associated with Trade Barriers
- 4.2.8.5. Impact of Trade Barriers on the Market
- 4.2.9. War Impact Analysis
- 4.2.9.1. Russian-Ukraine War
- 4.2.9.2. Israel-Hamas War
- 4.2.10. COVID Impact / Related Factors
- 4.2.10.1. Global Economic Impact
- 4.2.10.2. Industry-specific Impact
- 4.2.10.3. Government Response and Stimulus Measures
- 4.2.10.4. Future Outlook and Adaptation Strategies
- 4.2.11. Other Indicators
- 4.2.11.1. Fiscal Policy
- 4.2.11.2. Consumer Spending
- 4.2.11.3. Gross Domestic Product (GDP)
- 4.2.11.4. Employment
- 4.2.11.5. Taxes
- 4.2.11.6. Stock Market Performance
- 4.2.11.7. Cross-Border Dynamics
- 4.2.1. Time Period
- 4.3. Conclusion
5. EXECUTIVE SUMMARY
6. INTRODUCTION
- 6.1. Overview of the Metamaterials
- 6.2. Types of Metamaterials
- 6.3. Advantages of Metamaterials
- 6.4. Key Application Areas of Metamaterials
- 6.5. Future Trends in Metamaterials
7. MARKET LANDSCAPE: LEADING METAMATERIALS MANUFACTURERS
- 7.1. Methodology and Key Parameters
- 7.2. Analysis by Year of Establishment
- 7.3. Analysis by Company Size
- 7.4. Analysis by Location of Headquarters
- 7.5. Analysis by Type of Solution
- 7.6. Analysis by Type of Metamaterial
- 7.7. Analysis by Application
- 7.8. Analysis by End-use Industry
8. COMPANY COMPETITIVENESS ANALYSIS
- 8.1. Methodology and Key Parameters
- 8.2. Scoring Criteria
- 8.3. Leading Metamaterials Manufacturers: 2x2 Matrix
- 8.4. Leading Players
9. COMPANY PROFILES
- 9.1. ALCAN Systems*
- 9.1.1. Company Overview
- 9.1.2. Management Team
- 9.1.3. Metamaterials Portfolio
- 9.1.4. Recent Developments and Future Outlook
- Similar details are presented for other below mentioned companies based on information in the public domain
- 9.2. Echodyne
- 9.3. Kymeta
- 9.4. Meta Materials
- 9.5. MetaLenz
- 9.6. MinWave
- 9.7. Moxtek
- 9.8. Multiwave Technologies
- 9.9. Fractal Antenna Systems
- 9.10. Murata Manufacturing
- 9.11. Matrix (Guangzhou) Metamaterials
10. MEGA TRENDS
11. VALUE CHAIN ANALYSIS
12. PARTNERSHIPS AND COLLABORATIONS
- 12.1. Chapter Overview
- 12.2. Partnership Models
- 12.3. Metamaterials: Partnerships and Collaborations
- 12.3.1. Analysis by Year of Partnership
- 12.3.2. Analysis by Type of Partnership
- 12.3.3. Analysis by Year and Type of Partnership
- 12.3.4. Most Active Players: Analysis by Number of Partnerships
- 12.3.5. Analysis by Geography
- 12.3.5.1. Analysis by Country
- 12.3.5.2. Analysis by Continent
13. PATENT ANALYSIS
- 13.1. Methodology
- 13.2. Key Parameters
- 13.3. Metamaterials Market: Patent Analysis
- 13.3.1. Analysis by Application Year
- 13.3.2. Analysis by Type of Patent
- 13.3.3. Analysis by Patent Jurisdiction
- 13.3.4. Analysis by Publication Year
- 13.3.5. Analysis by Type of Patent and Publication Year
- 13.3.6. Leading Industry Players: Analysis by Number of Patents
- 13.3.7. Leading Individual Patent Assignees: Analysis by Number of Patents
- 13.3.8. Analysis by Type of Applicant
- 13.3.9. Analysis by Patent Age
- 13.3.10. Patent Valuation
14. PUBLICATION ANALYSIS
- 14.1. Chapter Overview
- 14.2. Analysis by Year of Publication
- 14.3. Analysis by Key Focus Areas
- 14.4. Analysis by Key Journal
15. MARKET IMPACT ANALYSIS
16. GLOBAL METAMATERIALS MARKET
- 16.1. Key Assumptions and Methodology
- 16.2. Global Metamaterials Market, Historical Trends (Since 2022) and Forecasted Estimates (Till 2035)
- 16.2.1. Scenario Analysis
- 16.2.1.1. Conservative Scenario
- 16.2.1.2. Optimistic Scenario
- 16.2.1. Scenario Analysis
- 16.3. Key Market Segmentations
17. MARKET OPPORTUNITIES BASED ON TYPE OF METAMATERIAL
- 17.1. Key Assumptions and Methodology
- 17.2. Metamaterials Market, by Type of Metamaterials
- 17.2.1. Metamaterials Market for Acoustic Metamaterials, Historical Trends (Since 2022) and Forecasted Estimates (Till 2035)
- 17.2.2. Metamaterials Market for Electromagnetic Metamaterials, Historical Trends (Since 2022) and Forecasted Estimates (Till 2035)
- 17.2.3. Metamaterials Market for Optical Metamaterials, Historical Trends (Since 2022) and Forecasted Estimates (Till 2035)
- 17.2.4. Metamaterials Market for Thermal Metamaterials, Historical Trends (Since 2022) and Forecasted Estimates (Till 2035)
- 17.2.5. Metamaterials Market for Other Metamaterials, Historical Trends (Since 2022) and Forecasted Estimates (Till 2035)
18. MARKET OPPORTUNITIES BASED ON TYPE OF MATERIAL USED
- 18.1. Key Assumptions and Methodology
- 18.2. Metamaterials Market, by Type of Material Used
- 18.2.1. Metamaterials Market for Polyurethane, Historical Trends (Since 2022) and Forecasted Estimates (Till 2035)
- 18.2.2. Metamaterials Market for Polystyrene, Historical Trends (Since 2022) and Forecasted Estimates (Till 2035)
- 18.2.3. Metamaterials Market for Silicone, Historical Trends (Since 2022) and Forecasted Estimates (Till 2035)
- 18.2.4. Metamaterials Market for Polyolefins, Historical Trends (Since 2022) and Forecasted Estimates (Till 2035)
- 18.2.5. Metamaterials Market for Other Materials, Historical Trends (Since 2022) and Forecasted Estimates (Till 2035)
19. MARKET OPPORTUNITIES BASED ON PRODUCT FORM
- 19.1. Key Assumptions and Methodology
- 19.2. Metamaterials Market, by Product Form
- 19.2.1. Metamaterials Market for Bulk Materials, Historical Trends (Since 2022) and Forecasted Estimates (Till 2035)
- 19.2.2. Metamaterials Market for Thin Films, Historical Trends (Since 2022) and Forecasted Estimates (Till 2035)
20. MARKET OPPORTUNITIES BASED ON APPLICATION
- 20.1. Key Assumptions and Methodology
- 20.2. Metamaterials Market, by Application
- 20.2.1. Metamaterials Market for Antenna and Radar, Historical Trends (Since 2022) and Forecasted Estimates (Till 2035)
- 20.2.2. Metamaterials Market for Cloaking Devices, Historical Trends (Since 2022) and Forecasted Estimates (Till 2035)
- 20.2.3. Metamaterials Market for Super Lens, Historical Trends (Since 2022) and Forecasted Estimates (Till 2035)
- 20.2.4. Metamaterials Market for Other Applications, Historical Trends (Since 2022) and Forecasted Estimates (Till 2035)
21. MARKET OPPORTUNITIES BASED ON TYPE OF ENTERPRISE
- 21.1. Key Assumptions and Methodology
- 21.2. Metamaterials Market, by Type of Enterprise
- 21.2.1. Metamaterials Market for Large Enterprises, Historical Trends (Since 2022) and Forecasted Estimates (Till 2035)
- 21.2.2. Metamaterials Market for Small and Medium Enterprises (SMEs), Historical Trends (Since 2022) and Forecasted Estimates (Till 2035)
22. MARKET OPPORTUNITIES BASED ON END USE INDUSTRY
- 22.1. Key Assumptions and Methodology
- 22.2. Metamaterials Market, by End Use Industry
- 22.2.1. Metamaterials Market for Aerospace and Defense, Historical Trends (Since 2022) and Forecasted Estimates (Till 2035)
- 22.2.2. Metamaterials Market for Automotive, Historical Trends (Since 2022) and Forecasted Estimates (Till 2035)
- 22.2.3. Metamaterials Market for Consumer Electronics, Historical Trends (Since 2022) and Forecasted Estimates (Till 2035)
- 22.2.4. Metamaterials Market for Energy and Power, Historical Trends (Since 2022) and Forecasted Estimates (Till 2035)
- 22.2.5. Metamaterials Market for Medical, Historical Trends (Since 2022) and Forecasted Estimates (Till 2035)
- 22.2.6. Metamaterials Market for Other End-use Industry, Historical Trends (Since 2022) and Forecasted Estimates (Till 2035)
23. MARKET OPPORTUNITIES BASED ON KEY GEOGRAPHICAL REGIONS
- 23.1. Key Assumptions and Methodology
- 23.2. Metamaterials Market, by Key Geographical Regions
- 23.2.1. Metamaterials Market in North America, Historical Trends (Since 2022) and Forecasted Estimates (Till 2035)
- 23.2.1.1. Metamaterials Market in the US, Historical Trends (Since 2022) and Forecasted Estimates (Till 2035)
- 23.2.1.2. Metamaterials Market in Canada, Historical Trends (Since 2022) and Forecasted Estimates (Till 2035)
- 23.2.1.3. Metamaterials Market in Mexico, Historical Trends (Since 2022) and Forecasted Estimates (Till 2035)
- 23.2.2. Metamaterials Market in Europe, Historical Trends (Since 2022) and Forecasted Estimates (Till 2035)
- 23.2.2.1. Metamaterials Market in Germany, Historical Trends (Since 2022) and Forecasted Estimates (Till 2035)
- 23.2.2.2. Metamaterials Market in the UK, Historical Trends (Since 2022) and Forecasted Estimates (Till 2035)
- 23.2.2.3. Metamaterials Market in France, Historical Trends (Since 2022) and Forecasted Estimates (Till 2035)
- 23.2.2.4. Metamaterials Market in Spain, Historical Trends (Since 2022) and Forecasted Estimates (Till 2035)
- 23.2.2.5. Metamaterials Market in Italy, Historical Trends (Since 2022) and Forecasted Estimates (Till 2035)
- 23.2.2.6. Metamaterials Market in Rest of Europe, Historical Trends (Since 2022) and Forecasted Estimates (Till 2035)
- 23.2.3. Metamaterials Market in Asia, Historical Trends (Since 2022) and Forecasted Estimates (Till 2035)
- 23.2.3.1. Metamaterials Market in China, Historical Trends (Since 2022) and Forecasted Estimates (Till 2035)
- 23.2.3.2. Metamaterials Market in Japan, Historical Trends (Since 2022) and Forecasted Estimates (Till 2035)
- 23.2.3.3. Metamaterials Market in India, Historical Trends (Since 2022) and Forecasted Estimates (Till 2035)
- 23.2.3.4. Metamaterials Market in South Korea, Historical Trends (Since 2022) and Forecasted Estimates (Till 2035)
- 23.2.3.5. Metamaterials Market in Rest of Asia, Historical Trends (Since 2022) and Forecasted Estimates (Till 2035)
- 23.2.4. Metamaterials Market in Latin America, Historical Trends (Since 2022) and Forecasted Estimates (Till 2035)
- 23.2.4.1. Metamaterials Market in Brazil, Historical Trends (Since 2022) and Forecasted Estimates (Till 2035)
- 23.2.4.2. Metamaterials Market in Argentina, Historical Trends (Since 2022) and Forecasted Estimates (Till 2035)
- 23.2.4.3. Metamaterials Market in Rest of Latin America, Historical Trends (Since 2022) and Forecasted Estimates (Till 2035)
- 23.2.5. Metamaterials Market in Middle East and North Africa and Rest oof the World, Historical Trends (Since 2022) and Forecasted Estimates (Till 2035)
- 23.2.5.1. Metamaterials Market in Australia, Historical Trends (Since 2022) and Forecasted Estimates (Till 2035)
- 23.2.5.2. Metamaterials Market in Turkey, Historical Trends (Since 2022) and Forecasted Estimates (Till 2035)
- 23.2.5.3. Metamaterials Market in Saudi Arabia, Historical Trends (Since 2022) and Forecasted Estimates (Till 2035)
- 23.2.5.4. Metamaterials Market in United Arab Emirates, Historical Trends (Since 2022) and Forecasted Estimates (Till 2035)
- 23.2.5.5. Metamaterials Market in Israel, Historical Trends (Since 2022) and Forecasted Estimates (Till 2035)
- 23.2.5.6. Metamaterials Market in Egypt, Historical Trends (Since 2022) and Forecasted Estimates (Till 2035)
- 23.2.5.7. Metamaterials Market in New Zealand, Historical Trends (Since 2022) and Forecasted Estimates (Till 2035)
- 23.2.1. Metamaterials Market in North America, Historical Trends (Since 2022) and Forecasted Estimates (Till 2035)
24. APPENDIX 1: TABULATED DATA
25. APPENDIX 2: LIST OF COMPANIES AND ORGANIZATIONS
 声波超材料市场:按应用、类型、材料和频率范围划分,全球预测(2026-2032年)
 超材料市场:依类型、产品、波控制、应用和最终用户划分-全球预测至2036年
 2034年全球电磁超材料市场机会与策略
 全球超材料市场按应用、最终用户、产品、类型和地区划分-预测至2032年2026年全球超材料市场报告
 超材料市场规模、份额和趋势分析报告:按产品、应用、最终用途、地区和细分市场预测(2026-2033 年)平面超透镜市场按类型、材质、波长和应用划分 - 全球预测 2026-2032红外线超透镜市场:按应用、终端用户产业、类型、材料、波长和製造工艺划分-2026-2032年全球预测
 声波超材料市场,全球预测至2032年:依超材料结构、材料平台、功能、目标频率范围、最终用户和地区划分
 超材料市场规模、份额、成长及全球产业分析:按类型、应用和地区划分的洞察与预测(2026-2034 年)