


 |
市场调查报告书
商品编码
1830068
抗老化药市场:2040年前的产业趋势和全球预测:各分子类型,各老龄化类型,各地区,医药品预测销售额Anti-Aging Drugs Market: Industry Trends and Global Forecasts, Till 2040: Distribution by Type of Molecule, Type of Aging, and Geographical Regions and Sales Forecast of Drugs |
||||||
抗老化药物市场:概览
预计到2040年,抗老化药物市场规模将从目前的7,900万美元成长至28.7亿美元,预测期内复合年增长率达27%。
市场区隔根据以下参数细分市场规模与市场机会:
分子类型
- 生技药品
- 低分子
老龄化类型
- 细胞老龄化
- 免疫老龄化
- 代谢老龄化
- 其他
地区
- 北美
- 欧洲
- 亚太地区
- 其他地区
抗老药物市场成长与趋势
全球研究人员和创新者正致力于开发能够透过针对老化病理生理机制来延长个体寿命的疗法。全球众多新创公司以及学术和研究机构正在探索处于不同发展阶段的抗衰老疗法。值得注意的是,抗衰老药物公司正在采用各种方法,例如改进严格的临床试验服务以加快市场审批程序,以及采用人工智慧来开发更好的抗衰老药物。此外,抗衰老领域的技术进步,例如器官晶片(一种有希望替代传统测试方法的技术),已经推动了有针对性且有效的长寿药物的开发。由于老龄人口的成长、持续的研发计划以及不断增加的资金投入,预计抗衰老药物市场在可预见的未来将经历显着增长。
由于老龄人口不断增长、研发计划持续推进以及资金投入不断增加,预计抗衰老药物市场在可预见的未来将经历显着增长。
抗老药物市场关键洞察
本报告分析了抗衰老药物市场的现状,并探讨了该行业的潜在成长机会。本报告的主要发现包括:
- 目前,全球有超过 65 种抗老化药物正在研发中,其中大多数开发者是位于北美的小型公司。
- 这些疗法由多种生物製剂和小分子化合物组成,目前处于不同的研发阶段。
- 超过 55% 的合作协议是在过去两年内签署的。
- 自 2018 年以来,私人和公共投资者已投资 40 亿美元。
- 最近有 660 多项与抗衰老药物相关的专利被提交或授予,表明该领域的智力资本正在不断扩大。
- 过去四年,已发表了 230 多篇与抗衰老药物相关的论文。
- 被预测市场被预想以年率15%以上增长,整体机会分子类型,老龄化类型,主要的各地区很好地被分散。
- 被预测欧洲和亚太地区,2040年之前获得市场占有率的75%以上。
抗老药物市场的主要细分市场
小分子药物在整个抗老化药物市场中占比最大。
依分子类型,抗老药物市场分为生物製剂和小分子药物。我们预测,小分子药物今年可能会占大部分市场。此外,在预测期内,该细分市场预计将保持相对较高的复合年增长率。
预计未来几年亚太地区将引领抗老药物市场。
依地区划分,抗老药物市场分为北美、欧洲、亚太地区及世界其他地区。目前,北美占了市场的大部分占有率,预计这一趋势将保持不变。此外,在预测期内,亚太市场可望维持相对较高的复合年增长率。
抗老化药市场参与企业案例
- AgelessRx
- ANOVA Institute of Regenerative Medicine
- Betterhumans
- BioAge Labs
- bioXcellerator
- Cambrian Biopharma
- Gero.ai, Mayo Clinic
- Rejuvenate Bio
- UT Health San Antonio
抗老化药市场调查对象
- 市场规模与机会分析:本报告从以下关键细分市场的角度,对全球抗衰老药物市场进行了全面分析:[A] 分子类型、[B] 老化类型、[C] 区域分析和 [药品销售预测]。
- 市场格局:基于若干相关参数,对抗老化药物市场相关公司进行深入评估,例如:A) 成立年份,B) 公司规模,C) 总部所在地,D) 发展阶段,E) 老化类型,F) 分子类型,G) 作用机制,H) 开发商类型等。
- 竞争分析:对抗老化药物市场进行全面的竞争分析,考察因素包括:A) 开发商实力,B) 产品组合实力,以及 C) 产品组合多样性。
- 公司简介:抗衰老药物市场主要开发商的详细简介,重点关注:A) 公司概况,B) 财务资讯(如有),C) 药品组合,以及 D) 近期发展和明智的未来展望。
- 专利分析:根据各种参数(例如 A] 专利类型、[B] 专利出版年份、[C] 地区、[D] CPC 符号、[E] 申请人类型、[F] 新兴重点领域、[G] 专利年龄、[H] 专利基准、[I] 专利特征和 [J] 专利估值)对抗衰老药物提交/授予的各种专利市场进行深入分析。
- 文章分析:基于 A] 出版年份、[B] 出版类型、[C] 地区等各种参数,对该领域所有已发表的出版物进行深入分析。
目录
第1章 序文
第2章 摘要整理
第3章 简介
- 老龄化概要
- 老龄化类型
- 老龄化的原因
- 抗老化药市场作用机制
- 老龄化伴随的疾病
- 老龄化关联的重要的事实
- 抗老化药的未来展望
第4章 市场形势
- 抗老化药:市场形势
- 抗老化药:开发形势
第5章 企业竞争力分析
- 章概要
- 前提主要的参数
- 调查手法
- 抗老化药:企业竞争力分析
第6章 伙伴关係和合作
- 章概要
- 抗老化药:伙伴关係和合作
第7章 与资金筹措投资
- 章概要
- 与抗老化药:资金筹措投资
第8章 专利分析
- 章概要
- 与范围调查手法
- 抗老化药:专利分析
- 抗老化药:专利基准
- 抗老化药:专利评估
第9章 出版物的分析
- 章概要
- 与范围调查手法
- 抗老化药:出版物的分析
第10章 波特的五力分析
第11章 企业简介
- AgelessRx
- ANOVA Institute for Regenerative Medicine
- Betterhumans
- BioAge Labs
- bioXcellerator
- Cambrian Biopharma
- Gero.ai
- Mayo Clinic
- Rejuvenate Bio
- UT Health San Antonio
第12章 与市场预测机会分析
- 预测调查手法主要的前提条件
- 全球抗老化药市场,2022-2040年
- 抗老化药市场:各分子类型分析
- 抗老化vs市场:各老龄化类型分析
- 抗老化药市场:各地区分析
- 抗老化药:个别产品预测销售额
第13章 执行洞察
第14章 附录I:表资料
第15章 附录I1:企业及组织的一览
Anti-Aging Drugs Market: Overview
As per Roots Analysis, the anti-aging drugs market is estimated to grow from USD 79 million in the current year to USD 2,807 million by 2040, representing a higher CAGR of 27% during the forecast period.
The market sizing and opportunity analysis has been segmented across the following parameters:
Type of Molecule
- Biologics
- Small Molecules
Type of Aging
- Cellular Aging
- Immune Aging
- Metabolic Aging
- Others
Geographical Regions
- North America
- Europe
- Asia Pacific
- Rest of the World
Anti-Aging Therapeutics Market: Growth and Trends
Researchers and innovators worldwide are focusing their efforts on the development of therapeutics that can extend life expectancy of an individual by targeting the pathophysiology of aging. Numerous start-ups and academic / research institutes globally are exploring a variety of anti-aging therapies at various stages of development. It is worth mentioning that anti-aging drug providing companies are using various methods, such as advancements in rigorous clinical trial services to expedite market approval procedure and incorporation of artificial intelligence to develop better anti-aging drugs. Additionally, technological advancements like organ-on-chip (promising alternative to conventional testing procedures) in the anti-aging domain has resulted in the development of targeted and effective longevity drugs. With the growing geriatric population, the ongoing R&D initiatives and the increasing funding investments, the anti-aging therapeutics market is expected to experience significant growth in the foreseen future.
With the growing geriatric population, the ongoing R&D initiatives and the increasing funding investments, the anti-aging therapeutics market is expected to experience significant growth in the foreseen future.
Anti-Aging Therapeutics Market: Key Insights
The report delves into the current state of the anti-aging therapeutics market and identifies potential growth opportunities within industry. Some key findings from the report include:
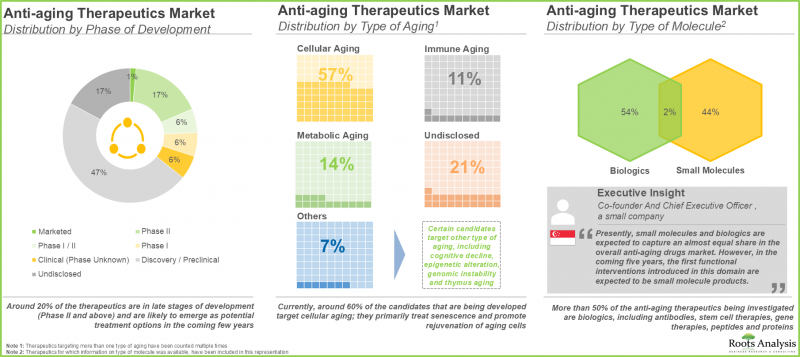
- Presently, more than 65 anti-aging therapeutics are being developed worldwide; majority of the developers are small firms based in North America.
- These therapeutics, ranging from a variety of biologics and small molecules, are currently being investigated across different phases of development.
- More than 55% of partnership agreements were inked in the past two years.
- ~USD 4 billion has been invested by both private and public investors, since 2018
- Over 660 patents related to anti-aging therapeutics have recently been filed / granted, indicating the growing intellectual capital in this domain.
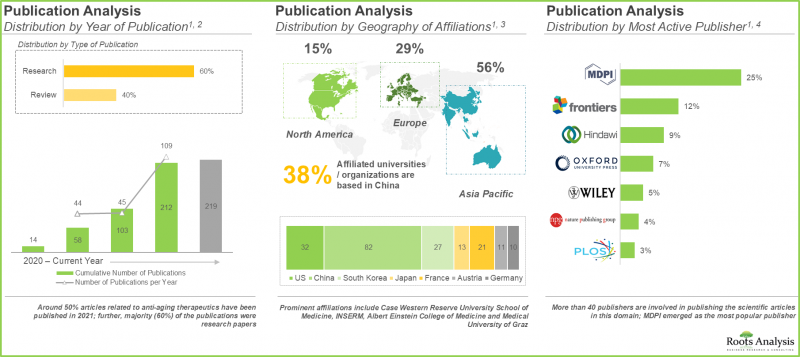
- 230+ articles related to anti-aging therapeutics have been published over the last four years.
- The market is expected to grow at an annualized rate of over 15%; the overall opportunity is anticipated to be well distributed across different types of molecules, types of aging and key geographical regions.
- Europe and Asia Pacific are anticipated to capture more than 75% of the market share, by 2040.
Anti-Aging Therapeutics Market: Key Segments
Small Molecules Holds the Largest Market Share of the Overall Anti-Aging Therapeutics Market
In terms of type of molecule, the anti-aging therapeutics market is segmented across biologics and small molecules. Our estimates suggest that small molecules are likely to capture most of the market share in the current year. Further, this segment is likely to grow at a relatively higher CAGR during the forecast period.
Asia-Pacific is Expected to Propel in the Anti-aging Drugs Market in the Coming Years
In terms of geographical regions, the anti-aging therapeutics market is segmented across North America, Europe, Asia-Pacific and rest of the world. Currently, North America captures the majority of the market, and this trend is likely to remain the same in the future. Further, the market in Asia-Pacific is likely to grow at a relatively higher CAGR during the forecast period.
Example Players in the Anti-aging Therapeutics Market
- AgelessRx
- ANOVA Institute of Regenerative Medicine
- Betterhumans
- BioAge Labs
- bioXcellerator
- Cambrian Biopharma
- Gero.ai, Mayo Clinic
- Rejuvenate Bio
- UT Health San Antonio
Anti-Aging Therapeutics Market: Research Coverage
- Market Sizing and Opportunity Analysis: The report features a thorough analysis of the global anti-aging therapeutics market, in terms of the key market segments, namely [A] type of molecule [B] type of aging, [C] geographical regions and [C] sales forecast of drugs.
- Market Landscape: An in-depth assessment of the companies involved in anti-aging therapeutics market, based on several relevant parameters, such as [A] year of establishment, [B] company size, [C] location of headquarters, [D] phase of development, [E] type of aging, [F] type of molecule, [G] mechanism of action, [H] type of developer.
- Company Competitiveness Analysis: A comprehensive competitive analysis of anti-aging therapeutics market, examining factors, such as [A] developer strength and [B] portfolio strength and [C] portfolio diversity.
- Company Profiles: Detailed profiles of key developers engaged in the anti-aging therapeutics market, focused on [A] overview of the company, [B] financial information (if available), [C] drug portfolio, and [D] recent developments and an informed future outlook.
- Patent Analysis: An insightful analysis of the various patents filed / granted in anti-aging therapeutics market, based on various parameters, such as [A] type of patent [B] patent publication year [C] geography, [D] CPC Symbols, [E] type of applicant, [F] emerging focus area, [G] patent age, [H] patent benchmarking [I] patent characteristics [J] patent valuation.
- Publication Analysis: An insightful analysis of the overall publications reported in this domain, based on various parameters, such as [A] year of publication [B] type of publication and [C] geography.
Key Questions Answered in this Report
- How many companies are currently engaged in this market?
- Which are the leading companies in this market?
- What factors are likely to influence the evolution of this market?
- What is the current and future market size?
- What is the CAGR of this market?
- How is the current and future market opportunity likely to be distributed across key market segments?
Reasons to Buy this Report
- The report provides a comprehensive market analysis, offering detailed revenue projections of the overall market and its specific sub-segments. This information is valuable to both established market leaders and emerging entrants.
- Stakeholders can leverage the report to gain a deeper understanding of the competitive dynamics within the market. By analyzing the competitive landscape, businesses can make informed decisions to optimize their market positioning and develop effective go-to-market strategies.
- The report offers stakeholders a comprehensive overview of the market, including key drivers, barriers, opportunities, and challenges. This information empowers stakeholders to stay abreast of market trends and make data-driven decisions to capitalize on growth prospects.
Additional Benefits
- Complimentary Excel Data Packs for all Analytical Modules in the Report
- 15% Free Content Customization
- Detailed Report Walkthrough Session with Research Team
- Free Updated report if the report is 6-12 months old or older
TABLE OF CONTENTS
1. PREFACE
- 1.1. Introduction
- 1.2. Key Market Insights
- 1.3. Scope of the Report
- 1.4. Research Methodology
- 1.5. Frequently Asked Questions
- 1.6. Chapter Outlines
2. EXECUTIVE SUMMARY
3. INTRODUCTION
- 3.1. Overview of Aging
- 3.2. Types of Aging
- 3.3. Causes of Aging
- 3.4 Mechanism of Action of Anti-aging drugs market
- 3.5 Age-related Diseases
- 3.6 Key Facts Associated with Aging
- 3.7 Future Perspectives of Anti-aging drugs
4. MARKET LANDSCAPE
- 4.1. Anti-aging Drugs: Overall Market Landscape
- 4.1.1. Analysis by Phase of Development
- 4.1.2. Analysis by Type of Aging
- 4.1.3. Analysis by Phase of Development and Type of Aging
- 4.1.4. Analysis by Type of Molecule
- 4.1.5. Analysis by Mechanism of Action
- 4.1.6. Analysis by Type of Developers
- 4.2. Anti-aging Drugs: Developer Landscape
- 4.2.1. Analysis by Year of Establishment
- 4.2.2. Analysis by Company Size and Location of Headquarters
- 4.2.3. Leading Developers by Number of Therapeutics
- 4.2.4. Regional Landscape of Developers
5. COMPANY COMPETITIVENESS ANALYSIS
- 5.1. Chapter Overview
- 5.2. Assumptions and Key Parameters
- 5.3. Methodology
- 5.4. Anti-aging Drugs: Company Competitiveness Analysis
- 5.4.1. Small Companies
- 5.4.2. Mid-sized and Large Companies
6. PARTNERSHIPS AND COLLABORATIONS
- 6.1. Chapter Overview
- 6.2. Anti-aging Drugs: Partnerships and Collaborations
- 6.2.1 Analysis by Year of Partnership
- 6.2.2. Analysis by Type of Partnership
- 6.2.3. Analysis by Year and Type of Partnership
- 6.2.4. Leading Players: Analysis by Number of Partnerships
- 6.2.5. Analysis by Type of Partner
- 6.2.6. Analysis by Type of Agreement
- 6.2.7. Analysis by Region
- 6.2.7.1. Intercontinental and Intracontinental Deals
- 6.2.7.2. International and Local Deals
7. FUNDING AND INVESTMENTS
- 7.1. Chapter Overview
- 7.2. Anti-aging Drugs: Funding and Investments
- 7.2.1. Analysis of Instances by Year
- 7.2.2. Analysis of Amount Invested by Year
- 7.2.3 Analysis of Instances by Type of Funding
- 7.2.4. Analysis of Amount Invested by Type of Funding
- 7.2.5. Analysis by Type of Investor
- 7.2.6. Analysis by Focus Area
- 7.2.7. Analysis of Amount Invested by Region
- 7.2.8. Analysis of Amount Invested by Country
- 7.2.9. Most Active Investors: Analysis by Number of Instances
- 7.2.10. Most Active Players: Analysis by Number of Instances
- 7.2.11. Most Active Players: Analysis by Amount Invested
8. PATENT ANALYSIS
- 8.1. Chapter Overview
- 8.2. Scope and Methodology
- 8.3. Anti-aging Drugs: Patent Analysis
- 8.3.1. Analysis by Type of Patent
- 8.3.2. Analysis by Patent Publication Year
- 8.3.3. Analysis of Granted Patents by Year
- 8.3.4. Analysis by Geography
- 8.3.5. Analysis by CPC Symbols
- 8.3.6. Analysis by Type of Applicant
- 8.3.7. Analysis by Emerging Focus Areas
- 8.3.8. Analysis by Patent Age
- 8.3.9. Leading Industry Players: Analysis by Number of Patents
- 8.3.10. Leading Non-Industry Players: Analysis by Number of Patents
- 8.3.11. Leading Individual Assignees: Analysis by Number of Patents
- 8.4. Anti-aging Drugs: Patent Benchmarking
- 8.4.1. Analysis by Patent Characteristics
- 8.5. Anti-aging Drugs: Patent Valuation
9. PUBLICATION ANALYSIS
- 9.1. Chapter Overview
- 9.2. Scope and Methodology
- 9.3. Anti-aging Drugs: Publication Analysis
- 9.3.1. Analysis by Year of Publication
- 9.3.2. Analysis by Type of Publication
- 9.3.3. Most Popular Journals: Analysis by Number of Publications
- 9.3.4. Most Popular Journals: Analysis by Impact Factor
- 9.3.5. Analysis by Most Popular Keywords
- 9.3.6. Most Popular Funding Institutes: Analysis by Number of Publications
- 9.3.7. Most Active Publisher: Analysis by Number of Publications
- 9.3.8. Most Popular Affiliation: Analysis by Number of Publications
- 9.3.9. Analysis by Geography
10. PORTER'S FIVE FORCES ANALYSIS
- 10.1. Chapter Overview
- 10.2. Methodology and Key Parameters
- 10.3. Porter's Five Forces
- 10.3.1. Threat of New Entrants
- 10.3.2. Bargaining Power of End Users
- 10.3.3. Bargaining Power of Drug Developers
- 10.3.4. Threat of Substitute Products
- 10.3.5. Rivalry Among Existing Competitors
11. COMPANY PROFILES
- 11.1. AgelessRx
- 11.1.1. Company Overview
- 11.1.2. Product Portfolio
- 11.1.3. Recent Developments and Future Outlook
- 11.2. ANOVA Institute for Regenerative Medicine
- 11.2.1. Company Overview
- 11.2.2. Product Portfolio
- 11.2.3. Recent Developments and Future Outlook
- 11.3. Betterhumans
- 11.3.1. Company Overview
- 11.3.2. Product Portfolio
- 11.3.3. Recent Developments and Future Outlook
- 11.4. BioAge Labs
- 11.4.1. Company Overview
- 11.4.2. Product Portfolio
- 11.4.3. Recent Developments and Future Outlook
- 11.5. bioXcellerator
- 11.5.1. Company Overview
- 11.5.2. Product Portfolio
- 11.5.3. Recent Developments and Future Outlook
- 11.6. Cambrian Biopharma
- 11.6.1. Company Overview
- 11.6.2. Product Portfolio
- 11.6.3. Recent Developments and Future Outlook
- 11.7. Gero.ai
- 11.7.1. Company Overview
- 11.7.2. Product Portfolio
- 11.7.3. Recent Developments and Future Outlook
- 11.8. Mayo Clinic
- 11.8.1. Company Overview
- 11.8.2. Product Portfolio
- 11.8.3. Recent Developments and Future Outlook
- 11.9. Rejuvenate Bio
- 11.9.1. Company Overview
- 11.9.2. Product Portfolio
- 11.9.3. Recent Developments and Future Outlook
- 11.10. UT Health San Antonio
- 11.10.1. Company Overview
- 11.10.2. Product Portfolio
- 11.10.3. Recent Developments and Future Outlook
12. MARKET FORECAST AND OPPORTUNITY ANALYSIS
- 12.1. Forecast Methodology and Key Assumptions
- 12.2. Global Anti-aging Drugs Market, 2022-2040
- 12.2.1. Anti-aging Drugs Market: Analysis by Type of Molecule
- 12.2.2. Anti-aging v Market: Analysis by Type of Aging
- 12.2.3. Anti-aging Drugs Market: Analysis by Geography
- 12.2.3.1. Anti-aging Drugs Market in North America, 2022-2040
- 12.2.3.2. Anti-aging Drugs Market in Europe, 2022-2040
- 12.2.3.3. Anti-aging Drugs Market in Asia Pacific, 2022-2040
- 12.2.3.4. Anti-aging Drugs Market in Rest of the World, 2022-2040
- 12.2.4. Anti-aging Drugs: Forecast of Individual Product Sales
- 12.2.4.1. bioXgel (PRP) (bioXcellerator): Estimated Sales Revenues
- 12.2.4.2. AR-100 (Rejenevie Therapeutics): Estimated Sales Revenues
- 12.2.4.3. BGE-117 (BioAge Labs): Estimated Sales Revenues
- 12.2.4.4. Dasatinib and Quercetin (TruDiagnostic): Estimated Sales Revenues
- 12.2.4.5. MYMD-1 (MyMD Pharmaceuticals): Estimated Sales Revenues
- 12.2.4.6. TRIIM Treatment (Intervene Immune): Estimated Sales Revenues
- 12.2.4.7. Rapamycin (AgelessRx): Estimated Sales Revenues
- 12.2.4.8. Sarconeos (BIO101) (Biophytis): Estimated Sales Revenues
13. EXECUTIVE INSIGHTS
- 13.1. Chapter Overview
- 13.2. Gero.ai
- 13.2.1 Company Snapshot
- 13.2.2. Interview Transcript: Co-founder and Chief Executive Officer
- 13.3. Betterhumans
- 13.3.1. Company Snapshot
- 13.3.2. Interview Transcript: President
- 13.4. CytoMed Therapeutics
- 13.4.1. Company Snapshot
- 13.4.2. Interview Transcript: Chief Operating Officer
- 13.5. Cambrian Biopharma
- 13.5.1 Company Snapshot
- 13.5.2. Interview Transcript: Senior Director of Global Corporate Communications
- 13.6. Landmark Medical Centre
- 13.6.1 Company Snapshot
- 13.6.2. Interview Transcript: Director and Consultant Obstetrician and Gynaecologist
14. APPENDIX I: TABULATED DATA
15. APPENDIX I1: LIST OF COMAPANIES AND ORGANIZATIONS
List of Tables
- Table 4.1 List of Anti-aging Drugs
- Table 4.2 List of Anti-aging Drugs Developers
- Table 6.1 Anti-aging Drugs: List of Partnerships and Collaborations
- Table 7.1 Anti-aging Drugs: List of Funding and Investments
- Table 8.1 Anti-aging Drugs: List of Patents
- Table 8.2 Patent Analysis: Categorization based on Weighted Valuation Scores
- Table 9.1 Anti-aging Drugs: List of Publications
- Table 11.1 AgelessRx: Product Portfolio
- Table 11.2 AgelessRx: Recent Developments and Future Outlook
- Table 11.3 ANOVA Institute for Regenerative Medicine: Product Portfolio
- Table 11.4 Betterhumans: Product Portfolio
- Table 11.5 Betterhumans: Recent Developments and Future Outlook
- Table 11.6 BioAge Labs: Product Portfolio
- Table 11.7 BioAge Labs: Recent Developments and Future Outlook
- Table 11.8 bioXcellerator: Product Portfolio
- Table 11.9 Cambrian Biopharma: Product Portfolio
- Table 11.10 Cambrian Biopharma: Recent Developments and Future Outlook
- Table 11.11 Gero.ai: Product Portfolio
- Table 11.12 Gero.ai: Recent Developments and Future Outlook
- Table 11.13 Mayo Clinic: Product Portfolio
- Table 11.14 Mayo Clinic: Recent Developments and Future Outlook
- Table 11.15 Rejuvenate Bio: Product Portfolio
- Table 11.16 Rejuvenate Bio: Recent Developments and Future Outlook
- Table 11.17 UT Health San Antonio: Product Portfolio
- Table 11.18 UT Health San Antonio: Recent Developments and Future Outlook
- Table 14.1 Market Landscape: Distribution by Phase of Development
- Table 14.2 Market Landscape: Distribution by Type of Aging
- Table 14.3 Market Landscape: Distribution by Phase of Development and Type of Aging
- Table 14.4 Market Landscape: Distribution by Type of Molecule
- Table 14.5 Market Landscape: Distribution by Mechanism of Action
- Table 14.6 Developer Landscape: Distribution by Type of Developers
- Table 14.7 Developer Landscape: Distribution by Year of Establishment
- Table 14.8 Developer Landscape: Distribution by Company Size and Location of Headquarters
- Table 14.9 Leading Developers: Distribution by Number of Therapeutics
- Table 14.10 Partnerships and Collaborations: Distribution by Year of Partnership
- Table 14.11 Partnerships and Collaborations: Distribution by Type of Partnership
- Table 14.12 Partnerships and Collaborations: Distribution by Year and Type of Partnership
- Table 14.13 Leading Players: Distribution by Number of Partnerships
- Table 14.14 Partnerships and Collaborations: Distribution by Type of Partner
- Table 14.15 Partnerships and Collaborations: Distribution by Type of Agreement
- Table 14.16 Partnerships and Collaborations: Intercontinental and Intracontinental Deals
- Table 14.17 Partnerships and Collaborations: International and Local Deals
- Table 14.18 Funding and Investments: Distribution of Instances by Year
- Table 14.19 Funding and Investments: Distribution of Amount Invested by Year
- Table 14.20 Funding and Investments: Year-wise Distribution of Amount Invested by Type of Funding
- Table 14.21 Funding and Investments: Distribution of Instances by Type of Funding
- Table 14.22 Funding and Investments: Distribution of Amount Invested by Type of Funding
- Table 14.23 Funding and Investments: Distribution by Type of Investor
- Table 14.24 Funding and Investments: Distribution by Focus Area
- Table 14.25 Funding and Investments: Distribution of Amount Invested by Region
- Table 14.26 Funding and Investments: Distribution of Amount Invested by Country
- Table 14.27 Most Active Investors: Distribution by Number of Instances
- Table 14.28 Most Active Players: Distribution by Number of Instances
- Table 14.29 Most Active Players: Distribution by Amount Invested
- Table 14.30 Patent Analysis: Distribution by Type of Patent
- Table 14.31 Patent Analysis: Distribution by Patent Publication Year
- Table 14.32 Patent Analysis: Distribution of Granted Patents by Year
- Table 14.33 Patent Analysis: Distribution by Geography
- Table 14.34 Patent Analysis: Distribution by Type of Applicant
- Table 14.35 Patent Analysis: Distribution by Patent Age
- Table 14.36 Leading Industry Players: Distribution by Number of Patents
- Table 14.37 Leading Non-Industry Players: Distribution by Number of Patents
- Table 14.38 Leading Individual Assignees: Distribution by Number of Patents
- Table 14.39 Anti-aging Drugs: Patent Valuation
- Table 14.40 Publication Analysis: Distribution by Year of Publication
- Table 14.41 Publication Analysis: Distribution by Type of Publication
- Table 14.42 Most Popular Journals: Distribution by Number of Publications
- Table 14.43 Most Popular Journals: Distribution by Impact Factor
- Table 14.44 Most Popular Funding Institutes: Distribution by Number of Publications
- Table 14.45 Most Active Publisher: Distribution by Number of Publications
- Table 14.46 Most Popular Affiliation: Distribution by Number of Publications
- Table 14.47 Publication Analysis: Distribution by Geography
- Table 14.48 Global Anti-aging Drugs Market, Conservative, Base and Optimistic Scenarios, 2035-2040 (USD Million)
- Table 14.49 Anti-aging Drugs Market: Distribution by Type of Molecule, 2022 and 2040 (USD Million)
- Table 14.50 Anti-aging Drugs Market: Distribution by Type of Aging, 2022 and 2040 (USD Million)
- Table 14.51 Anti-aging Drugs Market: Distribution by Geography, 2022 and 2040 (USD Million)
- Table 14.52 Anti-aging Drugs Market in North America, 2022-2040 (USD Million)
- Table 14.53 Anti-aging Drugs Market in Europe, 2022-2040 (USD Million)
- Table 14.54 Anti-aging Drugs Market in Asia Pacific, 2022-2040 (USD Million)
- Table 14.55 Anti-aging Drugs Market in Rest of the World, 2022-2040 (USD Million)
- Table 14.56 bioXgel (PRP) (bioXcellerator): Sales Forecast, Conservative, Base and Optimistic Scenarios, till 2040 (USD Million)
- Table 14.57 AR-100 (Rejenevie Therapeutics): Sales Forecast, Conservative, Base and Optimistic Scenarios, till 2040 (USD Million)
- Table 14.58 BGE-117 (BioAge Labs): Sales Forecast, Conservative, Base and Optimistic Scenarios, till 2040 (USD Million)
- Table 14.59 Dasatinib and Quercetin (TruDiagnostic): Sales Forecast, Conservative, Base and Optimistic Scenarios, till 2040 (USD Million)
- Table 14.60 MYMD-1 (MyMD Pharmaceuticals): Sales Forecast, Conservative, Base and Optimistic Scenarios, till 2040 (USD Million)
- Table 14.61 TRIIM Treatment (Intervene Immune): Sales Forecast, Conservative, Base and Optimistic Scenarios, till 2040 (USD Million)
- Table 14.62 Rapamycin (AgelessRx): Sales Forecast, Conservative, Base and Optimistic Scenarios, till 2040 (USD Million)
- Table 14.63 Sarconeos (BIO101) (Biophytis): Sales Forecast, Conservative, Base and Optimistic Scenarios, till 2040 (USD Million)
List of Figures
- Figure 2.1 Executive Summary: Overall Market Landscape
- Figure 2.2 Executive Summary: Partnerships and Collaborations
- Figure 2.3 Executive Summary: Funding and Investment Analysis
- Figure 2.4 Executive Summary: Patent Analysis
- Figure 2.5 Executive Summary: Publication Analysis
- Figure 2.6 Executive Summary: Market Forecast
- Figure 3.1 Types of Aging
- Figure 3.2 Causes of Aging
- Figure 3.3 Mechanism of Action of Anti-aging Drugs
- Figure 3.4 Age-related Diseases
- Figure 4.1 Anti-aging Drugs: Distribution by Phase of Development
- Figure 4.2 Anti-aging Drugs: Distribution by Type of Aging
- Figure 4.3 Anti-aging Drugs: Distribution by Phase of Development and Type of Aging
- Figure 4.4 Anti-aging Drugs: Distribution by Type of Molecule
- Figure 4.5 Anti-aging Drugs: Distribution by Mechanism of Action
- Figure 4.6 Anti-aging Drugs Developers: Distribution by Type of Developers
- Figure 4.7 Anti-aging Drugs Developers: Distribution by Year of Establishment
- Figure 4.8 Anti-aging Therapeutics Developers: Distribution by Company Size and Location of Headquarters
- Figure 4.9 Leading Developers: Distribution by Number of Therapeutics
- Figure 4.10 Anti-aging Drugs Developers: Regional Landscape
- Figure 5.1 Company Competitiveness Analysis: Small Companies
- Figure 5.2 Company Competitiveness Analysis: Mid-sized and Large Companies
- Figure 6.1 Partnerships and Collaborations: Distribution by Year of Partnership
- Figure 6.2 Partnerships and Collaborations: Distribution by Type of Partnership
- Figure 6.3 Partnerships and Collaborations: Distribution by Year and Type of Partnership
- Figure 6.4 Leading Players: Distribution by Number of Partnerships
- Figure 6.5 Partnerships and Collaborations: Distribution by Type of Partner
- Figure 6.6 Partnerships and Collaborations: Distribution by Type of Agreement
- Figure 6.7 Partnerships and Collaborations: Intercontinental and Intracontinental Deals
- Figure 6.8 Partnerships and Collaborations: International and Local Deals
- Figure 7.1 Funding and Investments: Distribution of Instances by Year
- Figure 7.2 Funding and Investments: Distribution of Amount Invested by Year
- Figure 7.3 Funding and Investments: Year-wise Distribution of Amount Invested by Type of Funding
- Figure 7.4 Funding and Investments: Distribution of Instances by Type of Funding
- Figure 7.5 Funding and Investments: Distribution of Amount Invested by Type of Funding
- Figure 7.6 Funding and Investments: Distribution by Type of Investor
- Figure 7.7 Funding and Investments: Distribution by Focus Area
- Figure 7.8 Funding and Investments: Distribution of Amount Invested by Region
- Figure 7.9 Funding and Investments: Distribution of Amount Invested by Country
- Figure 7.10 Most Active Investors: Distribution by Number of Instances
- Figure 7.11 Most Active Players: Distribution by Number of Instances
- Figure 7.12 Most Active Players: Distribution by Amount Invested
- Figure 8.1 Patent Analysis: Distribution by Type of Patent
- Figure 8.2 Patent Analysis: Distribution by Patent Publication Year
- Figure 8.3 Patent Analysis: Distribution of Granted Patents by Year
- Figure 8.4 Patent Analysis: Distribution by Geography
- Figure 8.5 Patent Analysis: Distribution by CPC Symbols
- Figure 8.6 Patent Analysis: Distribution by Type of Applicant
- Figure 8.7 Patent Analysis: Emerging Focus Area
- Figure 8.8 Patent Analysis: Distribution by Patent Age
- Figure 8.9 Leading Industry Players: Distribution by Number of Patents
- Figure 8.10 Leading Non-Industry Players: Distribution by Number of Patents
- Figure 8.11 Leading Individual Assignees: Distribution by Number of Patents
- Figure 8.12 Patent Benchmarking: Distribution of Leading Industry Players by Patent Characteristics (CPC Symbols)
- Figure 8.13 Anti-aging Drugs: Patent Valuation
- Figure 9.1 Publication Analysis: Distribution by Year of Publication
- Figure 9.2 Publication Analysis: Distribution by Type of Publication
- Figure 9.3 Most Popular Journals: Distribution by Number of Publications
- Figure 9.4 Most Popular Journals: Distribution by Impact Factor
- Figure 9.5 Publication Analysis: Most Popular Keywords
- Figure 9.6 Most Popular Funding Institutes: Distribution by Number of Publications
- Figure 9.7 Most Active Publisher: Distribution by Number of Publications
- Figure 9.8 Most Popular Affiliation: Distribution by Number of Publications
- Figure 9.9 Publication Analysis: Distribution by Geography
- Figure 10.1 Anti-aging Drugs: Porter's Five Forces Analysis
- Figure 12.1 Global Anti-aging Drugs Market, 2035-2040 (USD Million)
- Figure 12.2 Anti-aging Drugs Market: Distribution by Type of Molecule, 2022 and 2040 (USD Million)
- Figure 12.3 Anti-aging Drugs Market: Distribution by Type of Aging, 2022 and 2040 (USD Million)
- Figure 12.4 Anti-aging Drugs Market: Distribution by Geography, 2022 and 2040 (USD Million)
- Figure 12.5 Anti-aging Drugs Market in North America, 2022-2040 (USD Million)
- Figure 12.6 Anti-aging Drugs Market in Europe, 2022-2040 (USD Million)
- Figure 12.7 Anti-aging Drugs Market in Asia Pacific, 2022-2040 (USD Million)
- Figure 12.8 Anti-aging Drugs Market in Rest of the World, 2022-2040 (USD Million)
- Figure 12.9 bioXgel (PRP) (bioXcellerator): Sales Forecast, Conservative, Base and Optimistic Scenarios, till 2040 (USD Million)
- Figure 12.10 AR-100 (Rejenevie Therapeutics): Sales Forecast, Conservative, Base and Optimistic Scenarios, till 2040 (USD Million)
- Figure 12.11 BGE-117 (BioAge Labs): Sales Forecast, Conservative, Base and Optimistic Scenarios, till 2040 (USD Million)
- Figure 12.12 Dasatinib and Quercetin (TruDiagnostic): Sales Forecast, Conservative, Base and Optimistic Scenarios, till 2040 (USD Million)
- Figure 12.13 MYMD-1 (MyMD Pharmaceuticals): Sales Forecast, Conservative, Base and Optimistic Scenarios, till 2040 (USD Million)
- Figure 12.14 TRIIM Treatment (Intervene Immune): Sales Forecast, Conservative, Base and Optimistic Scenarios, till 2040 (USD Million)
- Figure 12.15 Rapamycin (AgelessRx): Sales Forecast, Conservative, Base and Optimistic Scenarios, till 2040 (USD Million)
- Figure 12.16 Sarconeos (BIO101) (Biophytis): Sales Forecast, Conservative, Base and Optimistic Scenarios, till 2040 (USD Million)
 长寿和抗衰老疗法市场规模、份额和成长分析(按治疗方法、应用、通路和地区划分)—产业预测(2026-2033 年)
 抗衰老龄化药物:全球市场份额和排名、总收入和需求预测(2025-2031)
 全球抗衰老贴片市场:2032 年预测 - 按类型、释放机制、贴片技术、分销管道、应用和地区进行分析2032 年长寿与抗老疗法市场预测:按疗法类型、应用、最终用户和地区进行的全球分析全球抗衰老药物市场:2032 年预测 - 按药物类型、作用机制、给药途径、应用、最终用户和地区进行分析
 2026-2032 年抗衰老药物市场(按类型、治疗和地区划分)