


 |
市场调查报告书
商品编码
1849800
细胞治疗包装市场:2035年前的产业趋势全球预测:各包装治疗类型,各包装设计,各产业规模,主要地区Cell Therapy Packaging Market by Type of Therapy Packed, Package Engineering Design, Scale of Operation and Key Geographical Regions: Industry Trends and Global Forecasts, Till 2035 |
||||||
全球细胞疗法包装市场预计将从目前的 4.04 亿美元增长至 2035 年的 12.25 亿美元,预测期内复合年增长率 (CAGR) 为 11.7%。
市场区隔包括基于以下参数的市场规模和机会分析:
依疗法类型包装
- T细胞治疗
- 树突状细胞疫苗
- 干细胞治疗
- NK细胞治疗
- 其他的先进治疗药
事业规模
- 临床规模
- 商业规模
包装设计
- 一次包装
- 二次包装
主要地区
- 北美
- 欧洲
- 亚太地区
- 其他地区
细胞疗法包装市场成长与趋势
多年来,製药业在药物研发方面取得了许多进展。该领域正从通用治疗方案转向更个人化的治疗方式,将个人化细胞疗法应用于各种疾病适应症。这一转变也为製药包装产业带来了显着变化。细胞疗法药物的包装往往比小分子药物或其他生物製剂更为复杂。为了在超低温和严格的品质标准下维持细胞的无菌性和活性,需要特定的填充、储存和运输条件。细胞疗法管理的复杂性使得研发人员必须制定包装和运输这些疗法的策略计画。
近期,多家开发商与产业利害关係人建立了策略合作伙伴关係,以确保细胞疗法的无菌性和质量,从而保障治疗介入措施的保存、运输和完整性。值得注意的是,服务供应商正在不断改进包装技术,超越传统包装产品,以满足冷炼和超低温环境的要求,从而维持这些新型尖端疗法的稳定性。自动化、人工智慧驱动的分析、封闭式生产系统、CRISPR基因编辑和改进的病毒载体技术等创新技术提高了效率,降低了污染风险,降低了成本,并实现了复杂疗法的规模化生产。因此,预计在预测期内,对细胞疗法的需求不断增长将显着推动细胞疗法包装服务市场的成长。
细胞疗法包装市场关键洞见
本研究报告分析了细胞疗法包装市场的现状,并指出了潜在的成长机会。报告的主要发现包括:
- 多家公司声称具备包装各种类型细胞疗法的能力。 其中,94% 的公司在产品开发的各个阶段提供多种附加服务。
- 该领域利害关係人提供的服务中,近 90% 是细胞疗法的被动包装,其中近 50% 提供低温范围内的干式运输箱作为被动包装系统。
- 超过30家公司提供各种形式的细胞疗法包装服务,其中大多数公司总部位于北美。
- 近50%的细胞疗法包装产品是用于储存和保护药物的包装袋,其中71%的产品提供低温包装。
- 为了追求竞争优势,该领域的利害关係人正在积极提升现有能力并加强其包装相关服务组合。
- 自2016年以来,该领域的合作活动显着增加,最近的大多数合作都集中在包装技术/平台的整合上。
- 随着未来预计会有更多细胞疗法获得批准,开发商可能会与合约服务提供者建立策略合作伙伴关係,并将部分营运外包。
- 为了满足日益增长的细胞疗法产品需求,製造商正在世界各地建立生产基地,而美国目前正崛起为细胞疗法的主要生产地。
- 市场成长很可能是由细胞疗法需求的不断成长所驱动。预计未来的成长机会将涵盖各种规模和地理的企业。
细胞疗法包装市场的主要细分市场
T细胞疗法细分市场占细胞疗法包装市场最大的占有率
根据包装的疗法类型,市场可细分为T细胞疗法、树突细胞癌症疫苗、干细胞疗法、NK细胞疗法和其他先进疗法。由于T细胞疗法在癌症治疗方面已被证实有效,因此目前占细胞疗法包装市场最大的占有率。预计这一趋势在未来几年将保持不变。
在预测期内,商业规模细分市场将成为细胞疗法包装市场成长最快的细分市场。
根据营运规模,市场可细分为临床规模和商业规模。儘管临床规模占了更高的市场占有率,但值得注意的是,商业规模市场预计在未来几年将实现显着成长。
目前,初级包装占细胞治疗包装市场的最大占有率。
依包装设计,市场分为初级包装和二级包装。目前,初级包装占细胞治疗包装市场的最大占有率,预计未来几年这一趋势将保持不变。这可能是由于初级包装具有许多优势,例如保护性、易用性、成本效益和剂量管理。
亚太地区占最大的市占率。
依主要地区划分,市场分为北美、欧洲、亚太地区及亚太其他地区。值得注意的是,预计未来几年欧洲市场的复合年增长率将更高。
主要研究概论
- 德国,小型企业,承包商和所有者
- 德国,小型企业,财务长
- 美国,小型企业,首席商务官
- 美国,小型公司,科学事务与技术行销资深总监
- 爱尔兰,大型公司,胜肽类副总裁
- 日本,大型公司,胜肽类业务专案负责人和高阶经理
细胞治疗包装市场参与企业案例
- Almac
- Catalent Biologics
- Cryoport Systems
- Saint-Gobain
- Thermo Fisher Scientific
- West Pharmaceuticals
- Yourway
细胞治疗包装市场调查对象
- 市场规模和机会分析:本报告对市场规模和机会进行了深入分析。细胞疗法包装市场,重点关注关键细分市场,例如[A] 包装的疗法类型,[B] 企业规模,[C] 包装设计,以及[D] 主要地区。
- 市场概况(服务提供者):对细胞疗法包装服务提供者进行全面评估,考虑各种参数,包括[A] 成立年份,[B] 公司规模,[C] 总部所在地,[D] 提供的服务类型,[E] 包装类型,[F] 提供的被动系统类型,[F] 包装工程设计,以及[G] 使用的相变材料。
- 市场概况(细胞疗法包装产品):对细胞疗法包装产品进行全面评估,考虑各种参数,包括[A] 包装容器类型,[B] 容器製造材料类型,[C] 容器製造原料,[D] 包装的细胞类型,[E] 储存条件,以及[F] 容器的易用性。它还包括基于多个参数对产品供应商的详细分析,例如[G]成立年份、[H]公司规模、[I]总部所在地以及[J]最活跃的参与者(按产品数量计)。
- 公司简介:提供主要细胞治疗包装产品和服务公司的详细简介,重点关注A]公司概况、[B]服务/产品组合、[C]近期发展以及[D]未来展望。
- 竞争分析:透过考察A]公司服务能力、[B]包装产品组合以及[C]服务组合等因素,对细胞治疗包装服务提供者进行全面的竞争分析。
- 合作伙伴关係与合作:基于多个参数分析自2016年以来该领域形成的联盟,例如联盟成立年份、联盟类型(服务联盟、技术/平台整合协议、併购)、联盟目的、提供的服务类型以及参与联盟的参与者所在地区。
- 潜在合作伙伴分析:对超过 250 家可能与细胞疗法包装供应商合作的细胞疗法开发公司进行深入评估。此分析考虑了各种相关参数,例如 [A] 开发商实力(基于公司规模)、[B] 疗法类型、[C] 研发管线成熟度(基于候选药物的研发阶段)等。
- 案例研究:[A] 公司成立年份、[B] 公司规模、[C] 总部所在地、[D] 生产设施所在地。此外,还包括对 [E] 生产的细胞类型、[F] 细胞来源、[G] 业务规模和 [H] 生产能力/服务的详细分析。
目录
第1章 序文
第2章 摘要整理
第3章 简介
- 章概要
- 医药品填充包装
- 医药品包装的重要性
- 医药品包装的种类
- 细胞治疗的包装
- 一次包装
- 二次包装
- 细胞治疗包装:重要的考虑事项
- 细胞治疗包装相关的课题
- 结论
第4章 细胞治疗包装服务供应商:市场形势
- 章概要
- 细胞治疗包装服务供应商:市场形势
第5章 细胞治疗包装产品供应商:市场形势
- 章概要
- 细胞治疗包装产品:市场形势
- 细胞治疗包装:产品供应商的形势
第6章 细胞治疗包装服务及产品供应商:企业简介
- 章概要
- 细胞治疗包装服务供应商
- Almac
- Catalent Biologics
- Cryoport Systems
- Yourway
- 细胞治疗包装产品供应商
- Saint-Gobain Life Sciences
- Thermo Fisher Scientific
- West Pharmaceutical Services
第7章 企业竞争力分析
- 章概要
- 主要的参数
- 调查手法
- 细胞治疗包装服务供应商:企业竞争力分析
- 北美企业
- 欧洲和亚太地区的企业
第8章 伙伴关係和合作
- 章概要
- 伙伴关係模式
- 细胞治疗包装:伙伴关係和合作的清单
第9章 合作伙伴候补的分析
- 章概要
- 范围与调查手法
- 北美的细胞治疗包装供应商的潜在的策略性合作伙伴
- 欧洲的细胞治疗包装供应商的潜在的策略性合作伙伴
- 亚太地区及其他地区的细胞治疗包装供应商的潜在的策略性合作伙伴
第10章 细胞治疗的开发商和製造商:案例研究
- 章概要
- 细胞治疗厂商:市场形势
第11章 全球细胞治疗包装市场
第12章 细胞治疗包装市场(各治疗类型)
第13章 细胞治疗包装市场(各产业规模)
第14章 细胞治疗用包装市场(各包装设计)
第15章 细胞治疗包装市场(各主要地区)
第16章 结论
第17章 附录1:表格形式资料
第18章 附录2:企业·团体一览
Cell Therapy Packaging Market: Overview
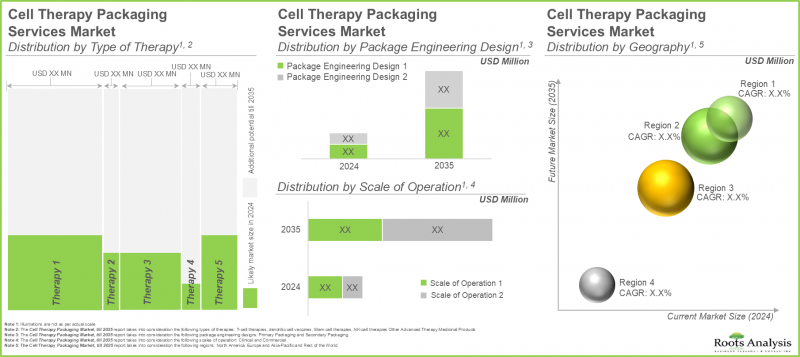
As per Roots Analysis, the global cell therapy packaging market is estimated to grow from USD 404 million in the current year to USD 1,225 million by 2035, at a CAGR of 11.7% during the forecast period, till 2035.
The market sizing and opportunity analysis has been segmented across the following parameters:
Type of Therapy Packed
- T-cell Therapies
- Dendritic Cell Vaccines
- Stem Cell Therapies
- NK-cell Therapies
- Other Advanced Therapy Medicinal Products
Scale of Operations
- Clinical Scale
- Commercial Scale
Package Engineering Design
- Primary Packaging
- Secondary Packaging
Key Geographical Regions
- North America
- Europe
- Asia-Pacific
- Rest of the World
Cell Therapy Packaging Market: Growth and Trends
Over the years, the pharmaceutical industry has witnessed several advancements in drug development. The domain has transitioned from a universal treatment alternative to a more tailored approach to therapy, incorporating personalized cell therapies for various disease indications. This transition has resulted in a notable shift in the pharmaceutical packaging sector as well. The packaging of cell therapies tends to be more intricate compared to small molecule therapeutics and other biologics. It necessitates specific conditions for fill / finish, storage, and transportation to preserve the sterility and viability of cells at cryogenic temperatures and strict quality standards. Due to the intricacies involved in managing cell therapies, it is essential for developers to create a strategic plan for packaging and transporting these therapies.
In the recent past, to ensure the sterility and quality of cell therapies, several developers have forged strategic partnerships with industry stakeholders to ensure the integrity of their therapeutic intervention in addition to their storage and transport. It is worth highlighting that the service providers are steadily advancing their packaging technologies beyond the conventional packaging products to meet the demand for cold chain and cryogenic environment required to maintain the stability of these novel, state-of-the-art therapies. Innovations such as automation, AI-driven analytics, closed-system production, CRISPR gene editing, and improved viral vector technologies enhance efficiency, reduce contamination risks, and lower costs, enabling scalable manufacturing for complex therapies. Thus, owing to the rising demand for cell-based therapeutics, the market for cell therapy packaging services is expected to witness substantial growth during the forecast period.
Cell Therapy Packaging Market: Key Insights
The report delves into the current state of the cell therapy packaging market and identifies potential growth opportunities within industry. Some key findings from the report include:
- Several industry players claim to have the required capabilities for packaging of different types of cell therapies; of these, 94% of the firms offer multiple additional services across different stages of product development.
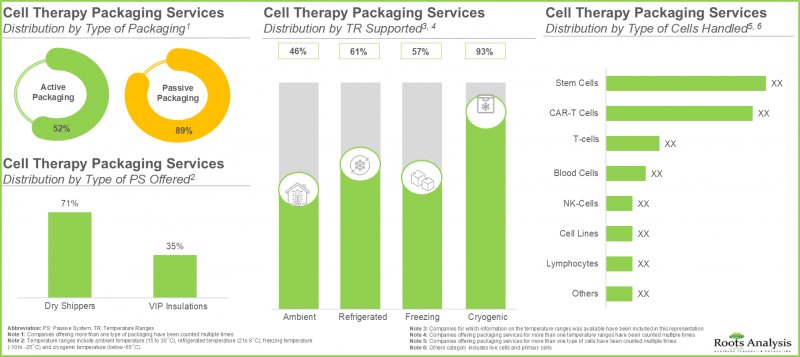
- Close to 90% of the services offered by the stakeholders in this domain are for passive packaging of cell therapies; of these, nearly 50% of the players offer dry shippers as the passive system at cryogenic temperature range.
- Over 30 companies offer packaging services for cell therapies in various formats; majority of these firms are headquartered in North America.
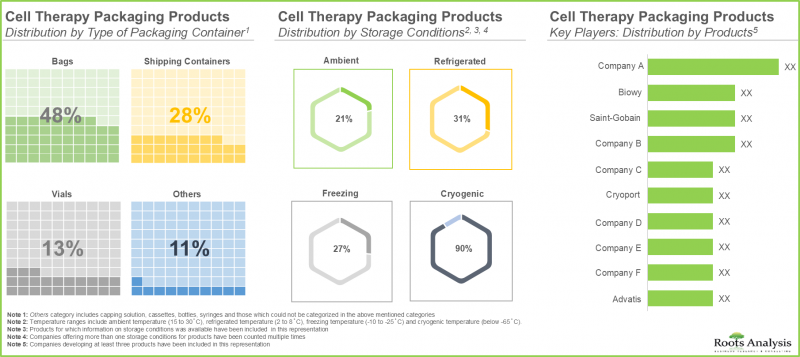
- Nearly, 50% of the cell therapy packaging products are bags used for storage and protection of drugs; further 71% of these products offer packaging products at cryogenic temperature ranges.
- In pursuit of a competitive edge, stakeholders in this domain are actively upgrading their existing capabilities and enhancing packaging-related service portfolios.
- Since 2016, there has been a marked increase in the partnership activity in this domain; most of the recent collaborations are focused on the packaging technology / platform integration.
- As more cell therapies are anticipated to receive approval in future, developers are anticipated to forge strategic partnerships with contract service providers to outsource a part of their business operations.
- In order to meet the rising demand for cell therapy products, manufacturers have established their presence in various regions across the world; presently, the US emerged as the key manufacturing hub for cell therapies.
- The market's growth is likely to be driven by the rising demand for cell therapies; the future opportunity is expected to be well distributed across various scales of operation and geographies.
Cell Therapy Packaging Market: Key Segments
T-Cell Therapies Segment Occupies the Largest Share of the Cell Therapy Packaging Market
Based on the type of therapy packed, the market is segmented into T-cell therapies, dendritic cell cancer vaccines, stem cell therapies, NK-cell therapies, and other advanced therapy medicinal products. Owing to their proven efficacy in treating cancer effectively, the T-cell therapies segment holds the maximum share of the current cell therapy packaging market. This trend is likely to remain the same in the forthcoming years.
Commercial Scale Segment is the Fastest Growing Segment of the Cell Therapy Packaging Market During the Forecast Period
Based on the scale of operation, the market is segmented into clinical and commercial scale. While clinical accounts for a higher market share, it is worth highlighting that the commercial scale segment is expected to witness substantial market growth in the coming years.
Currently, the Primary Packaging Segment Occupies the Largest Share of the Cell Therapy Packaging Market
Based on the package engineering designs, the market is segmented into primary and secondary packaging. At present, primary packaging holds the maximum share of the cell therapy packaging market and this trend is likely to remain the same in the forthcoming years. This can be attributed to the numerous advantages of primary packaging, such as protection, ease of use, cost-effectiveness and dosage control.
Asia-Pacific Accounts for the Largest Share of the Market
Based on the key geographical regions, the market is segmented into North America, Europe, Asia-Pacific and the Rest of the world. It is worth highlighting that, over the years, the market in Europe is expected to grow at a higher CAGR.
Primary Research Overview
- Founder and Owner, Small Company, Germany
- Chief Financial Officer, Small Company, Germany
- Chief Business Officer, Small Company, US
- Senior Director of Scientific Affairs and Technical Marketing, Small Company, US
- Vice President, Peptides, Large Company, Ireland
- Senior Manager, Peptide Business Project Leader, Large Company, Japan
Example Players in the Cell Therapy Packaging Market
- Almac
- Catalent Biologics
- Cryoport Systems
- Saint-Gobain
- Thermo Fisher Scientific
- West Pharmaceuticals
- Yourway
Cell Therapy Packaging Market: Research Coverage
- Market Sizing and Opportunity Analysis: The report features an in-depth analysis of the cell therapy packaging market, focusing on key market segments, including [A] type of therapy packed, [B] scale of operation, [C] package engineering design and [D] key geographical regions.
- Market Landscape (Service Providers): A comprehensive evaluation of cell therapy packaging services providers, considering various parameters, such as [A] year of establishment, [B] company size, [C] location of headquarters, [D] type of services offered, [E] type of packaging, [F] type of passive system offered, [F] packaging engineering design, [G] phase change material used.
- Market Landscape (Cell Therapy Packaging Products): A comprehensive evaluation of cell therapy packaging products, considering various parameters, such as [A] type of packaging container, [B] type of container fabrication material, [C] raw materials for container fabrication, [D] type of cells packed, [E] storage conditions, and [F] usability of container. It also includes a detailed analysis on product providers on the basis of multiple parameters, such as their [G] year of establishment, [H] company size, [I] location of headquarters and [J] most active players (in terms of number of products).
- Company Profiles: In-depth profiles of key industry players offering cell therapy packaging products and services, focusing on [A] company overviews, [B] service / product portfolio, [C] recent developments and [D] an informed future outlook.
- Company Competitiveness Analysis: A comprehensive competitive analysis of cell therapy packaging service providers, examining factors, such as [A] service strength of a company, [B] packaging portfolio and [C] service portfolio.
- Partnerships and Collaborations: An analysis of partnerships established in this sector, since 2016, based on several parameters, such as year of partnership, type of partnership (service alliance, technology / platform integration agreement, merger and acquisition), purpose of partnership, type of service offered, and geographical location of players involved in the partnership.
- Likely Partner Analysis: A detailed evaluation of over 250 cell therapy developers that are most likely to collaborate with cell therapy packaging providers. This analysis considers various relevant parameters, including [A] developer strength (based on company size), [B] type of therapy and [C] pipeline maturity (based on stage of development of drug candidates).
- Case Study: A case study highlighting the companies that are engaged in the development and manufacturing of cell therapies, along with the information on their [A] year of establishment, [B] company size, [C] location of headquarters and [D] location of manufacturing facility. Further, the chapter includes a detailed analysis on [E] type of cells manufactured, [F] source of cells, [G] scale of operation and [H] manufacturing capabilities / services of the aforementioned companies.
Key Questions Answered in this Report
- How many companies are currently engaged in this market?
- Which are the leading companies in this market?
- Which cell therapy developers are most likely to collaborate with service providers?
- What factors are likely to influence the evolution of this market?
- What is the current and future market size?
- What is the CAGR of this market?
- How is the current and future market opportunity likely to be distributed across key market segments?
Reasons to Buy this Report
- The report provides a comprehensive market analysis, offering detailed revenue projections of the overall market and its specific sub-segments. This information is valuable to both established market leaders and emerging entrants.
- Stakeholders can leverage the report to gain a deeper understanding of the competitive dynamics within the market. By analyzing the competitive landscape, businesses can make informed decisions to optimize their market positioning and develop effective go-to-market strategies.
- The report offers stakeholders a comprehensive overview of the market, including key drivers, barriers, opportunities, and challenges. This information empowers stakeholders to stay abreast of market trends and make data-driven decisions to capitalize on growth prospects.
Additional Benefits
- Complimentary PPT Insights Packs
- Complimentary Excel Data Packs for all Analytical Modules in the Report
- 15% Free Content Customization
- Detailed Report Walkthrough Session with Research Team
- Free Updated report if the report is 6-12 months old or older
TABLE OF CONTENTS
1. PREFACE
- 1.1. Scope of the Report
- 1.2. Research Methodology
- 1.3. Key Questions Answered
- 1.4. Chapter Outlines
2. EXECUTIVE SUMMARY
3. INTRODUCTION
- 3.1. Chapter Overview
- 3.2. Pharmaceutical Filling and Packaging
- 3.3. Importance of Pharmaceutical Packaging
- 3.4. Types of Pharmaceutical Packaging
- 3.5. Packaging of Cell Therapies
- 3.5.1. Primary Packaging
- 3.5.2. Secondary Packaging
- 3.6. Cell Therapy Packaging: Key Considerations
- 3.7. Challenges associated with Cell Therapy Packaging
- 3.8. Concluding Remarks
4. CELL THERAPY PACKAGING SERVICE PROVIDERS: MARKET LANDSCAPE
- 4.1. Chapter Overview
- 4.2. Cell Therapy Packaging Service Providers: Overall Market Landscape
- 4.2.1. Analysis by Year of Establishment
- 4.2.2. Analysis by Company Size
- 4.2.3. Analysis by Location of Headquarters
- 4.2.4. Analysis by Services Offered
- 4.2.5. Analysis by Type of Packaging
- 4.2.6. Analysis by Type of Passive System Offered
- 4.2.7. Analysis by Type of Package Engineering Design
- 4.2.8. Analysis by Phase Change Material Used
- 4.2.9. Analysis by Temperature Ranges Supported
- 4.2.10. Analysis by Type of Cells Handled
5. CELL THERAPY PACKAGING PRODUCT PROVIDERS: MARKET LANDSCAPE
- 5.1. Chapter Overview
- 5.2. Cell Therapy Packaging Products: Market Landscape
- 5.2.1. Analysis by Type of Packaging Container
- 5.2.2. Analysis by Container Fabrication Material and Raw Materials for Container Fabrication
- 5.2.3. Analysis by Type of Cells Packed
- 5.2.4. Analysis by Storage Conditions
- 5.2.5. Analysis by Usability of Container
- 5.3. Cell Therapy Packaging: Product Providers Landscape
- 5.3.1. Analysis by Year of Establishment
- 5.3.2. Analysis by Company Size
- 5.3.3. Analysis by Location of Headquarters
- 5.3.4. Most Active Players: Distribution by Number of Products
6. CELL THERAPY PACKAGING SERVICE AND PRODUCT PROVIDERS: COMPANY PROFILES
- 6.1. Chapter Overview
- 6.2. Cell Therapy Packaging Service Providers
- 6.2.1. Almac
- 6.2.1.1. Company Overview
- 6.2.1.2. Cell Therapy Service Portfolio
- 6.2.1.3. Recent Developments and Future Outlook
- 6.2.2. Catalent Biologics
- 6.2.2.1. Company Overview
- 6.2.2.2. Cell Therapy Service Portfolio
- 6.2.2.3. Recent Developments and Future Outlook
- 6.2.3. Cryoport Systems
- 6.2.3.1. Company Overview
- 6.2.3.2. Cell Therapy Service Portfolio
- 6.2.3.3. Recent Developments and Future Outlook
- 6.2.4. Yourway
- 6.2.4.1. Company Overview
- 6.2.4.2. Cell Therapy Service Portfolio
- 6.2.4.3. Recent Developments and Future Outlook
- 6.2.1. Almac
- 6.3. Cell Therapy Packaging Product Providers
- 6.3.1. Saint-Gobain Life Sciences
- 6.3.1.1. Company Overview
- 6.3.1.2. Cell Therapy Packaging Product Portfolio
- 6.3.1.3. Recent Developments and Future Outlook
- 6.3.2. Thermo Fisher Scientific
- 6.3.2.1. Company Overview
- 6.3.2.2. Cell Therapy Packaging Product Portfolio
- 6.3.2.3. Recent Developments and Future Outlook
- 6.3.3. West Pharmaceutical Services
- 6.3.3.1. Company Overview
- 6.3.3.2. Cell Therapy Packaging Product Portfolio
- 6.3.3.3. Recent Developments and Future Outlook
- 6.3.1. Saint-Gobain Life Sciences
7. COMPANY COMPETITIVENESS ANALYSIS
- 7.1. Chapter Overview
- 7.2. Key Parameters
- 7.3. Methodology
- 7.4. Cell Therapy Packaging Service Providers: Company Competitiveness Analysis
- 7.4.1. Companies based in North America
- 7.4.2. Companies based in Europe and Asia-Pacific
8. PARTNERSHIPS AND COLLABORATIONS
- 8.1. Chapter Overview
- 8.2. Partnership Models
- 8.3. Cell Therapy Packaging: List of Partnerships and Collaborations
- 8.3.1. Analysis by Year of Partnership
- 8.3.2. Analysis by Type of Partnership
- 8.3.3. Analysis by Year and Type of Partnership
- 8.3.4. Analysis by Purpose of Partnership
- 8.3.5. Analysis by Type of Service(s) Covered
- 8.3.6. Most Active Players: Analysis by Number of Partnerships
- 8.3.7. Regional Analysis
- 8.3.8. Intercontinental and Intracontinental Agreements
9. LIKELY PARTNER ANALYSIS
- 9.1. Chapter Overview
- 9.2. Scope and Methodology
- 9.3. Potential Strategic Partners for Cell Therapy Packaging Providers in North America
- 9.3.1. Most Likely Partners
- 9.3.2. Likely Partners
- 9.3.3. Less Likely Partners
- 9.4. Potential Strategic Partners for Cell Therapy Packaging Providers in Europe
- 9.4.1. Most Likely Partners
- 9.4.2. Likely Partners
- 9.4.3. Less Likely Partners
- 9.5. Potential Strategic Partners for Cell Therapy Packaging Providers in Asia Pacific and Rest of the World
- 9.5.1. Most Likely Partners
- 9.5.2. Likely Partners
- 9.5.3. Less Likely Partners
10. CELL THERAPY DEVELOPERS AND MANUFACTURERS: CASE STUDY
- 10.1. Chapter Overview
- 10.2. Cell Therapy Manufacturers: Overall Market Landscape
- 10.2.1. Analysis by Year of Establishment
- 10.2.2. Analysis by Company Size
- 10.2.3. Analysis by Location of Headquarters
- 10.2.4. Analysis by Location of Manufacturing Facility
- 10.2.5. Analysis by Type of Cell(s) Manufactured
- 10.2.6. Analysis by Source of Cells
- 10.2.7. Analysis by Scale of Operation
- 10.2.8. Analysis by Manufacturing Capabilities / Services
- 10.2.9. Concluding Remarks
11. GLOBAL CELL THERAPY PACKAGING MARKET
- 11.1. Chapter Overview
- 11.2. Assumptions and Methodology
- 11.3. Global Cell Therapy Packaging
Services Market, Forecasted Estimates (till 2035)
- 11.4. Scenario Analysis
- 11.4.1. Conservative Scenario
- 11.4.2. Optimistic Scenario
- 11.5. Key Market Segmentations
12. CELL THERAPY PACKAGING MARKET, BY TYPE OF THERAPY
- 12.1. Chapter Overview
- 12.2. Key Assumptions and Methodology
- 12.3. Cell Therapy Packaging Market: Distribution by Type of Therapy
- 12.3.1. T-cell Therapies Packaging: Forecasted Estimates (till 2035)
- 12.3.2. Dendritic Cell Vaccines Packaging: Forecasted Estimates (till 2035)
- 12.3.3. Stem Cell Therapies Packaging: Forecasted Estimates (till 2035)
- 12.3.4. NK-Cell Therapies Packaging: Forecasted Estimates (till 2035)
- 12.3.5. Other Advanced Therapy Medicinal Products Packaging: Forecasted Estimates (till 2035)
- 12.4. Data Triangulation and Validation
13. CELL THERAPY PACKAGING MARKET, BY SCALE OF OPERATION
- 13.1. Chapter Overview
- 13.2. Key Assumptions and Methodology
- 13.3. Cell Therapy Packaging Market: Distribution by Scale of Operation
- 13.3.1. Clinical Scale: Forecasted Estimates (till 2035)
- 13.3.2. Commercial Scale: Forecasted Estimates (till 2035)
- 13.4. Data Triangulation and Validation
14. CELL THERAPY PACKAGING MARKET, BY PACKAGE ENGINEERING DESIGN
- 14.1. Chapter Overview
- 14.2. Key Assumptions and Methodology
- 14.3. Cell Therapy Packaging Market: Distribution by Package Engineering Design
- 14.3.1. Primary Packaging: Forecasted Estimates (till 2035)
- 14.3.2. Secondary Packaging: Forecasted Estimates (till 2035)
- 14.4. Data Triangulation and Validation
15. CELL THERAPY PACKAGING MARKET, BY KEY GEOGRAPHICAL REGIONS
- 15.1. Chapter Overview
- 15.2. Key Assumptions and Methodology
- 15.3. Cell Therapy Packaging Market: Distribution by Key Geographical Regions
- 15.3.1. North America: Forecasted Estimates (till 2035)
- 15.3.2. Europe: Forecasted Estimates (till 2035)
- 15.3.3. Asia-Pacific: Forecasted Estimates (till 2035)
- 15.3.4. Rest of the World: Forecasted Estimates (till 2035)
- 15.4. Data Triangulation and Validation
16. CONCLUDING REMARKS
- 16.1. Chapter Overview
17. APPENDIX 1: TABULATED DATA
18. APPENDIX 2: LIST OF COMPANIES AND ORGANIZATIONS
List of Tables
- Table 4.1 Cell Therapy Packaging Service Providers: List of Industry Players
- Table 4.2 Cell Therapy Packaging Service Providers Market: Information on Services Offered
- Table 4.3 Cell Therapy Packaging Service Providers Market: Information on Type of Packaging
- Table 4.4 Cell Therapy Packaging Service Providers Market: Information on Type of Passive System Used
- Table 4.5 Cell Therapy Packaging Service Providers Market: Information on Type of Packaging
- Table 4.6 Cell Therapy Packaging Service Providers Market: Information on Phase Change Material
- Table 4.7 Cell Therapy Packaging Service Providers Market: Information on Temperature Ranges
- Table 4.8 Cell Therapy Packaging Service Providers Market: Information on Type of Cells Handled Supported
- Table 5.1 Cell Therapy Packaging Product Providers: Information on Type of Packaging Container
- Table 5.2 Cell Therapy Packaging Product Providers: Information on Type of Container Fabrication Material and Raw Material for Container Fabrication
- Table 5.3 Cell Therapy Packaging Product Providers Market: Information on Type of Cells Packed
- Table 5.4 Cell Therapy Packaging Product Providers: Information on Storage Conditions
- Table 5.5 Cell Therapy Packaging Product Providers: Information on Packaging Volume, Customization and Usability of Container
- Table 5.6 Cell Therapy Packaging Product Providers: List of Industry Players
- Table 6.1 Cell Therapy Packaging Service and Product Providers: List of Companies Profiled
- Table 6.2 Almac: Company Snapshot
- Table 6.3 Almac: Recent Developments and Future Outlook
- Table 6.4 Cryoport Systems: Company Snapshot
- Table 6.5 Cryoport Systems: Recent Developments and Future Outlook
- Table 6.6 Catalent Biologics: Company Snapshot
- Table 6.7 Catalent Biologics: Recent Developments and Future Outlook
- Table 6.8 Yourway: Company Snapshot
- Table 6.9 Saint-Gobain Life Sciences: Company Snapshot
- Table 6.10 Saint-Gobain Life Sciences: Product Portfolio
- Table 6.11 Thermo Fisher Scientific: Company Snapshot
- Table 6.12 Thermo Fisher Scientific: Product Portfolio
- Table 6.13 Thermo Fisher Scientific: Recent Developments and Future Outlook
- Table 6.14 West Pharmaceutical Services: Company Snapshot
- Table 6.15 West Pharmaceutical Services: Product Portfolio
- Table 6.16 West Pharmaceutical Services: Recent Developments and Future Outlook
- Table 7.1 Cell Therapy Packaging: List of Partnerships and Collaborations, since 2016
- Table 7.2 Partnerships and Collaborations: Information on Type of Service(s) Covered
- Table 9.1 Most Likely Partners for Cell Therapy Packaging Product and Service Providers in North America
- Table 9.2 Likely Partners for Cell Therapy Packaging Product and Service Providers in North America
- Table 9.3 Less Likely Partners for Cell Therapy Packaging Product and Service Providers in North America
- Table 9.4 Most Likely Partners for Cell Therapy Packaging Product and Service Providers in Europe
- Table 9.5 Likely Partners for Cell Therapy Packaging Product and Service Providers in Europe
- Table 9.6 Less Likely Partners for Cell Therapy Packaging Product and Service Providers in Europe
- Table 9.7 Most Likely Partners for Cell Therapy Packaging Product and Service Providers in Asia Pacific and RoW
- Table 9.8 Likely Partners for Cell Therapy Packaging Product and Service Providers in Asia Pacific and RoW
- Table 9.9 Less Likely Partners for Cell Therapy Packaging Product and Service Providers in Asia Pacific and RoW
- Table 10.1 Cell Therapy Manufacturers: List of Industry Players
- Table 10.2 Cell Therapy Manufacturers: Information on Type of Cells Manufactured
- Table 10.3 Cell Therapy Manufacturers: Information on Source of Cells
- Table 10.4 Cell Therapy Manufacturers: Information on Scale of Operation
- Table 10.5 Cell Therapy Manufacturers: Information on Type of Manufacturing Capabilities / Services
- Table 17.1 Cell Therapy Packaging Service Providers: Distribution by Year of Establishment
- Table 17.2 Cell Therapy Packaging Service Providers: Distribution by Company Size
- Table 17.3 Cell Therapy Packaging Service Providers: Distribution by Location of Headquarters
- Table 17.4 Cell Therapy Packaging Service Providers: Distribution by Package Engineering Design
- Table 17.5 Cell Therapy Packaging Service Providers: Distribution by Type of Packaging
- Table 17.6 Cell Therapy Packaging Service Providers: Distribution by Packaging Material
- Table 17.7 Cell Therapy Packaging Service Providers: Distribution by Type of Packaging and Packaging Material
- Table 17.8 Cell Therapy Packaging Service Providers: Distribution by Type of Passive System Used
- Table 17.9 Cell Therapy Packaging Service Providers: Distribution by Temperature Ranges Supported
- Table 17.10 Cell Therapy Packaging Service Providers: Distribution by Type of Packaging, Packaging Material and Temperature Ranges Supported
- Table 17.11 Cell Therapy Packaging Service Providers: Distribution by Type of Cells Handled
- Table 17.12 Cell Therapy Packaging Service Providers: Distribution by Type of Additional Services Offered
- Table 17.13 Cell Therapy Packaging Products: Distribution by Type of Packaging Container
- Table 17.14 Cell Therapy Packaging Products: Distribution by Container Fabrication Material
- Table 17.15 Cell Therapy Packaging Products: Distribution by Type of Packaging Container and Container Fabrication Material
- Table 17.16 Cell Therapy Packaging Products: Distribution by Storage Temperature Conditions
- Table 17.17 Cell Therapy Packaging Products: Distribution by Type of Container and Storage Temperature Conditions
- Table 17.18 Cell Therapy Packaging Products: Distribution by Type of Cells Packed
- Table 17.19 Cell Therapy Packaging Products: Distribution by Usability of Container
- Table 17.20 Cell Therapy Packaging Product Providers: Distribution by Year of Establishment
- Table 17.21 Cell Therapy Packaging Product Providers: Distribution by Company Size
- Table 17.22 Cell Therapy Packaging Product Providers: Distribution by Location of Headquarters
- Table 17.23 Partnerships and Collaborations: Cumulative Year-wise Trend, since 2016
- Table 17.24 Partnerships and Collaborations: Distribution by Type of Partnership
- Table 17.25 Partnerships and Collaborations: Distribution by Year and Type of Partnership, since 2016
- Table 17.26 Partnerships and Collaborations: Distribution by Purpose of Partnerships
- Table 17.27 Partnerships and Collaborations: Distribution by Type of Service(s) Covered
- Table 17.28 Most Active Players: Distribution by Number of Partnerships
- Table 17.29 Partnerships and Collaborations: Distribution by Location of Parent Company
- Table 17.30 Partnerships and Collaborations: Distribution by Location of Partner Company
- Table 17.31 Partnerships and Collaborations: Distribution by Intercontinental and Intracontinental Partnerships
- Table 17.32 Cell Therapy Manufacturers: Distribution by Year of Establishment
- Table 17.33 Cell Therapy Manufacturers: Distribution by Company Size
- Table 17.34 Cell Therapy Manufacturers: Distribution by Location of Headquarters
- Table 17.35 Cell Therapy Manufacturers: Distribution by Location of Headquarters (Country Wise)
- Table 17.36 Cell Therapy Manufacturers: Distribution by Location of Manufacturing Facility (Region-wise)
- Table 17.37 Cell Therapy Manufacturers: Distribution by Location of Manufacturing Facility (Country-wise)
- Table 17.38 Cell Therapy Manufacturers: Distribution by Type of Cells Manufactured
- Table 17.39 Cell Therapy Manufacturers: Distribution by Type of Manufacturers
- Table 17.40 Cell Therapy Manufacturers: Distribution by Source of Cells
- Table 17.41 Cell Therapy Manufacturers: Distribution by Scale of Operation
- Table 17.42 Cell Therapy Manufacturers: Distribution by Manufacturing Capabilities / Services
- Table 17.43 Global Cell Therapy Packaging Market, Forecasted Estimates (till 2035) (USD Million)
- Table 17.44 Global Cell Therapy Packaging Market, Forecasted Estimates (till 2035), Conservative Scenario (USD Million)
- Table 17.45 Global Cell Therapy Packaging Market, Forecasted Estimates (till 2035), Optimistic Scenario (USD Million)
- Table 17.46 Global Cell Therapy Packaging Market: Distribution by Type of Therapy, Current Year and 2035 (USD Million)
- Table 17.47 Cell Therapy Packaging Market for T-cell Therapies Packaging, Forecasted Estimates (till 2035) (USD Million)
- Table 17.48 Cell Therapy Packaging Market for Stem Cell Therapies Packaging, Forecasted Estimates (till 2035) (USD Million)
- Table 17.49 Cell Therapy Packaging Market for Dendritic Cell Vaccines Packaging, Forecasted Estimates (till 2035) (USD Million)
- Table 17.50 Cell Therapy Packaging Market for NK-Cell Therapies Packaging, Forecasted Estimates (till 2035) (USD Million)
- Table 17.51 Cell Therapy Packaging Market for Other Advanced Therapy Medicinal Products Packaging, Forecasted Estimates (till 2035) (USD Million)
- Table 17.52 Global Cell Therapy Packaging Market: Distribution by Scale of Operation, Current Year and 2035 (USD Million)
- Table 17.53 Cell Therapy Packaging Market for Clinical Scale, Forecasted Estimates (till 2035) (USD Million)
- Table 17.54 Cell Therapy Packaging Market for Commercial Scale, Forecasted Estimates (till 2035) (USD Million)
- Table 17.55 Global Cell Therapy Packaging Market: Distribution by Package Engineering Design, Current Year and 2035 (USD Million)
- Table 17.56 Cell Therapy Packaging Market for Primary Packaging, Forecasted Estimates (till 2035) (USD Million)
- Table 17.57 Cell Therapy Packaging Market for Secondary Packaging, Forecasted Estimates (till 2035) (USD Million)
- Table 17.58 Global Cell Therapy Packaging Market: Distribution by Key Geographical Regions, Current Year and 2035 (USD Million)
- Table 17.59 Cell Therapy Packaging Market for North America, Forecasted Estimates (till 2035) (USD Million)
- Table 17.60 Cell Therapy Packaging Market for Europe, Forecasted Estimates (till 2035) (USD Million)
- Table 17.61 Cell Therapy Packaging Market for Asia-Pacific, Forecasted Estimates (till 2035) (USD Million)
- Table 17.62 Cell Therapy Packaging Market for Rest of the World, Forecasted Estimates (till 2035) (USD Million)
List of Figures
- Figure 2.1 Executive Summary: Service Providers Landscape
- Figure 2.2 Executive Summary: Product Providers Landscape
- Figure 2.3 Executive Summary: Partnerships and Collaborations
- Figure 2.4 Executive Summary: Market Forecast and Opportunity Analysis
- Figure 3.1 Traditional Aseptic Pharmaceutical Filling
- Figure 3.2 Advantages of Pharmaceutical Packaging
- Figure 3.3 Types of Pharmaceutical Packaging
- Figure 3.4 Packaging Containers for Cell Therapies
- Figure 3.5 Challenging aspects of Cell Therapy Packaging
- Figure 4.1 Cell Therapy Packaging Service Providers: Distribution by Year of Establishment
- Figure 4.2 Cell Therapy Packaging Service Providers: Distribution by Company Size
- Figure 4.3 Cell Therapy Packaging Service Providers: Distribution by Location of Headquarters
- Figure 4.4 Cell Therapy Packaging Service Providers: Distribution by Company Size and Location of Headquarters
- Figure 4.5 Cell Therapy Packaging Service Providers: Distribution by Services Offered
- Figure 4.6 Cell Therapy Packaging Service Providers: Distribution by Type of Packaging
- Figure 4.7 Cell Therapy Packaging Service Providers: Distribution by Passive System Used
- Figure 4.8 Cell Therapy Packaging Service Providers: Distribution by Package Engineering Design
- Figure 4.9 Cell Therapy Packaging Service Providers: Distribution by Type of Phase Change Material
- Figure 4.10 Cell Therapy Packaging Service Providers: Distribution by Type of Packaging and Phase Change Material
- Figure 4.11 Cell Therapy Packaging Service Providers: Distribution by Temperature Ranges Supported
- Figure 4.12 Cell Therapy Packaging Service Providers: Distribution by Type of Packaging, Packaging Material and Temperature Ranges Supported
- Figure 4.13 Cell Therapy Packaging Service Providers: Distribution by Type of Cells Handled
- Figure 5.1 Cell Therapy Packaging Products: Distribution by Type of Packaging Container
- Figure 5.2 Cell Therapy Packaging Products: Distribution by Container Fabrication Material and Raw Materials for Container Fabrication
- Figure 5.3 Cell Therapy Packaging Products: Distribution by Type of Packaging and Type of Container Fabrication Material
- Figure 5.4 Cell Therapy Packaging Products: Distribution by Type of Cells Packed
- Figure 5.5 Cell Therapy Packaging Products: Distribution by Storage Temperature
- Figure 5.6 Cell Therapy Packaging Products: Distribution by Usability of Container
- Figure 5.7 Cell Therapy Packaging Product Providers: Distribution by Year of Establishment
- Figure 5.8 Cell Therapy Packaging Product Providers: Distribution by Company Size
- Figure 5.9 Cell Therapy Packaging Product Providers: Distribution by Location of Headquarters
- Figure 5.10 Cell Therapy Packaging Product Providers: Distribution by Company Size and Location of Headquarters
- Figure 5.11 Key Cell Therapy Packaging Product Providers: Distribution by Number of Products
- Figure 6.1 Almac: Cell Therapy Service Portfolio
- Figure 6.2 Catalent Biologics: Cell Therapy Service Portfolio
- Figure 6.3 Cryoport Systems: Cell Therapy Service Portfolio
- Figure 6.4 Yourway: Cell Therapy Service Portfolio
- Figure 7.1 Company Competitiveness Analysis: Cell Therapy Packaging Service Providers based in North America
- Figure 7.2 Company Competitiveness Analysis: Cell Therapy Packaging Service Providers based in Europe and Asia-Pacific
- Figure 8.1 Partnerships and Collaborations: Cumulative Year-wise Trend, since 2016
- Figure 8.2 Partnerships and Collaborations: Distribution by Type of Partnership
- Figure 8.3 Partnerships and Collaborations: Distribution by Year and Type of Partnership, since 2016
- Figure 8.4 Partnerships and Collaborations: Distribution by Purpose of Partnership
- Figure 8.5 Partnerships and Collaborations: Distribution by Type of Service(s) Covered
- Figure 8.6 Most Active Players: Distribution by Number of Partnerships
- Figure 8.7 Partnerships and Collaborations: Distribution by Location of Parent Company
- Figure 8.8 Partnerships and Collaborations: Distribution by Location of Partner Company
- Figure 8.9 Partnerships and Collaborations: Intercontinental and Intracontinental Agreements
- Figure 10.1 Cell Therapy Manufacturers: Distribution by Year of Establishment
- Figure 10.2 Cell Therapy Manufacturers: Distribution by Company Size
- Figure 10.3 Cell Therapy Manufacturers: Distribution by Location of Headquarters
- Figure 10.4 Cell Therapy Manufacturers: Distribution by Location of Headquarters (Country Wise)
- Figure 10.5 Cell Therapy Manufacturers: Distribution by Location of Manufacturing Facility (Region-wise)
- Figure 10.6 Cell Therapy Manufacturers: Distribution by Location of Manufacturing Facility (Country-wise)
- Figure 10.7 Cell Therapy Manufacturers: Distribution by Type of Cells Manufactured
- Figure 10.8 Cell Therapy Manufacturers: Distribution by Type of Manufacturers
- Figure 10.9 Cell Therapy Manufacturers: Distribution by Source of Cells
- Figure 10.10 Cell Therapy Manufacturers: Distribution by Scale of Operation
- Figure 10.11Cell Therapy Manufacturers: Distribution by Manufacturing Capabilities / Services
- Figure 11.1 Global Cell Therapy Packaging Market, Forecasted Estimates (till 2035) (USD Million)
- Figure 11.2 Global Cell therapy Packaging Market, Forecasted Estimates (till 2035), Conservative Scenario (USD Million)
- Figure 11.3 Global Cell therapy Packaging Market, Forecasted Estimates (till 2035), Optimistic Scenario (USD Million)
- Figure 12.1 Cell Therapy Packaging Market: Distribution by Type of Therapy, Current Year and 2035 (USD Million)
- Figure 12.2 Cell Therapy Packaging Market for T-cell Therapies Packaging, Forecasted Estimates (till 2035) (USD Million)
- Figure 12.3 Cell Therapy Packaging Market for Dendritic Cell Vaccines Packaging, Forecasted Estimates (till 2035) (USD Million)
- Figure 12.4 Cell Therapy Packaging Market for Stem Cell Therapies Packaging, Forecasted Estimates (till 2035) (USD Million)
- Figure 12.5 Cell Therapy Packaging Market for NK-Cell Therapies Packaging, Forecasted Estimates (till 2035) (USD Million)
- Figure 12.6 Cell Therapy Packaging Market for Other Advanced Therapy Medicinal Products Packaging, Forecasted Estimates (till 2035) (USD Million)
- Figure 13.1 Cell Therapy Packaging Market: Distribution by Scale of Operation, Current Year and 2035 (USD Million)
- Figure 13.2 Cell Therapy Packaging Market for Clinical Scale, Forecasted Estimates (till 2035) (USD Million)
- Figure 13.3 Cell Therapy Packaging Market for Commercial Scale, Forecasted Estimates (till 2035) (USD Million)
- Figure 14.1 Cell Therapy Packaging Market: Distribution by Package Engineering Design, Current Year and 2035 (USD Million)
- Figure 14.2 Cell Therapy Packaging Market for Primary Packaging, Forecasted Estimates (till 2035) (USD Million)
- Figure 14.3 Cell Therapy Packaging Market for Secondary Packaging, Forecasted Estimates (till 2035) (USD Million)
- Figure 15.1 Cell Therapy Packaging Market: Distribution by Key Geographical Regions, Current Year and 2035 (USD Million)
- Figure 15.2 Cell Therapy Packaging Market in North America, Forecasted Estimates (till 2035) (USD Million)
- Figure 15.3 Cell Therapy Packaging Market in Europe, Forecasted Estimates (till 2035) (USD Million)
- Figure 15.4 Cell Therapy Packaging Market in Asia-Pacific, Forecasted Estimates (till 2035) (USD Million)
- Figure 15.5 Cell Therapy Packaging Market in Rest of The World, Forecasted Estimates (till 2035) (USD Million)
- Figure 16.1 Concluding Remarks: Overall Service Providers Landscape
- Figure 16.2 Concluding Remarks: Overall Products Landscape
- Figure 16.3 Concluding Remarks: Partnerships and Collaborations
- Figure 16.4 Concluding Remarks: Likely Partner Analysis
- Figure 16.5 Concluding Remarks: Market Forecast
 细胞和基因治疗供应链软体市场分析及预测(至2035年):按类型、产品类型、服务、技术、组件、应用、流程、部署类型、最终用户和阶段划分
 全球人类细胞治疗原料市场规模、份额、趋势和成长分析报告(2026-2034年)全球细胞治疗市场规模、份额、趋势和成长分析报告(2026-2034年)
 细胞疗法市场规模、份额、趋势及预测(按细胞类型、治疗方法、治疗领域、最终用户和地区划分),2026-2034年
 人类细胞治疗材料市场-全球产业规模、份额、趋势、机会及预测(依产品、最终用户、地区及竞争格局划分,2021-2031年)
 核受体检测服务市场(按检测类型、受体类别、技术、应用和最终用户划分),全球预测,2026-2032年细胞疗法生物製造市场按製造模式、治疗领域、製程步骤、细胞类型和最终用户划分,全球预测(2026-2032年)细胞疗法市场规模、占有率、成长及全球产业分析:依类型、应用、区域洞察及预测(2026-2034 年)自动化和封闭式细胞治疗市场-2026-2031年预测日本细胞治疗市场报告:按细胞类型、治疗方法、治疗领域、最终用户和地区划分(2026-2034年)