


 |
市场调查报告书
商品编码
1849803
CAR T细胞疗法市场:产业趋势和全球预测 - 标的抗原,各适应症,各主要地区,医药品预测销售额,主要加入企业CAR T-Cell Therapy Market: Industry Trends and Global Forecasts - Distribution by Target Antigens, Target Indication, Key Geographies, Sales Forecast of Drugs and Leading Players |
||||||
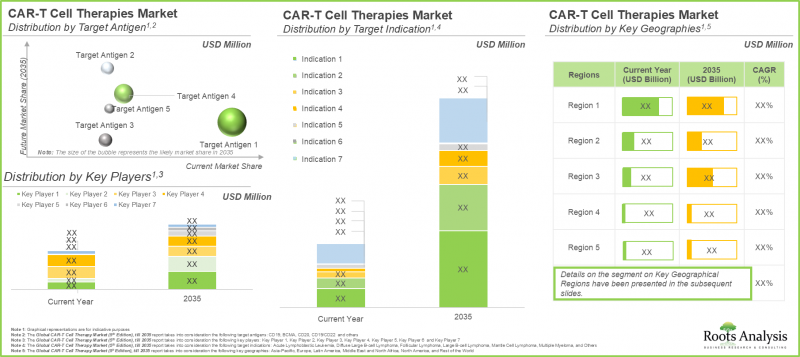
全球CAR-T细胞疗法市场预计将从目前的46亿美元成长到2035年的152亿美元,预测期内复合年增长率(CAGR)为11.4%。
市场区隔以以下参数划分市场规模与机会:
适应症
- 急性淋巴芽球性白血病
- 瀰漫性B大细胞淋巴瘤
- 滤泡型淋巴瘤
- 大细胞型B细胞淋巴瘤
- 被套细胞淋巴瘤
- 多发性骨髓瘤
- 其他
标的抗原
- CD19
- BCMA
- CD20
- CD19/CD22
- 其他
主要地区
- 北美
- 美国
- 加拿大
- 欧洲
- 德国
- 法国
- 义大利
- 西班牙
- 英国
- 其他的欧洲
- 亚太地区
- 日本
- 印度
- 中国
- 澳洲
- 韩国
- 其他的亚太地区
- 南美
- 中东·北非
- 其他地区
主要医药品
- Yescarta
- Kymriah
- AvecMa
- Brianzi
- Calvicti
- Tecartus
- 其他
CAR-T细胞疗法市场:成长与趋势
癌症研究是製药业药物开发中最活跃的领域之一。事实上,近年来,美国FDA已批准70多种药物用于各种癌症治疗。由于传统疗法面临许多挑战,製药研究人员正在积极寻求更具针对性的抗癌疗法。其中,CAR-T细胞疗法已成为一个很有前景的选择。 CAR-T细胞疗法利用人体自身的免疫反应来辨识和摧毁癌细胞。 CAR-T细胞疗法已被证明能够实现疾病完全缓解,因此无需进一步治疗。此外,大量研究也证实了这些疗法的有效性。过去八年间,已有近1,000项与CAR-T细胞疗法相关的临床试验註册,显示该领域的研究投入庞大。目前,超过230家公司正在开发CAR-T细胞疗法,用于治疗各种癌症、非癌症及其他疾病。
CAR-T细胞疗法市场的成长得益于分子研究技术的进步、对个人化癌症治疗需求的不断增长、临床试验数量的增加以及多种疗法的批准。此外,投资者的持续投入将在中长期内推动CAR-T细胞疗法研发的稳定成长。
CAR T 细胞疗法市场关键洞察
本报告深入分析了 CAR T 细胞疗法市场的现状,并指出了该行业的潜在成长机会。报告的主要发现包括:
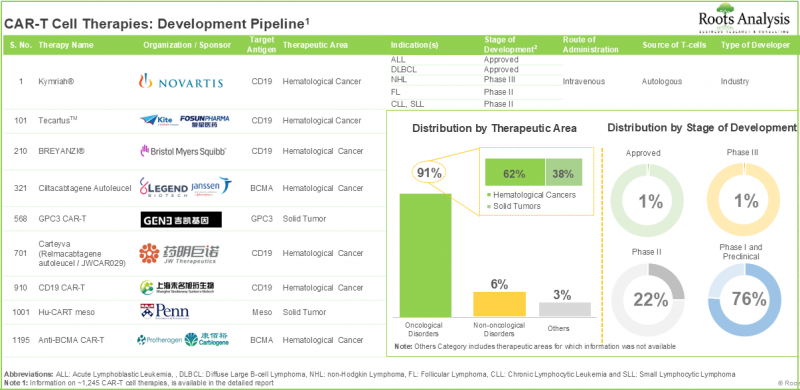
- CAR T 细胞疗法是製药领域最具活力的领域之一,目前有超过 1240 个临床前和临床候选产品。
- 针对各种疾病开发的候选疗法中,近 75% 为自体疗法,其中 CD19 和 BCMA 是最热门的目标抗原。
- 目前正在进行大量工作,以改进不同世代的 CAR 构建体,包括各使用种基因转移载体修饰 scFv 区。
- 近 200 家公司声称具备生产各种类型细胞疗法的必要能力,这些公司还提供涵盖产品开发各个阶段的广泛服务。
- 过去八年间,全球各地已註册超过970项与CAR-T细胞疗法相关的临床试验。
- 目前,超过375位来自知名大学的科学家参与CAR-T细胞疗法的临床研发,这些关键意见领袖(KOL)主要来自美国和中国。
- 近期,国际和本地利害关係人之间的合作日益增多,印证了该领域日益增长的关注度。
- 许多投资者已意识到蓬勃发展的癌症免疫疗法领域的商机,并透过超过370笔交易投资超过320亿美元。
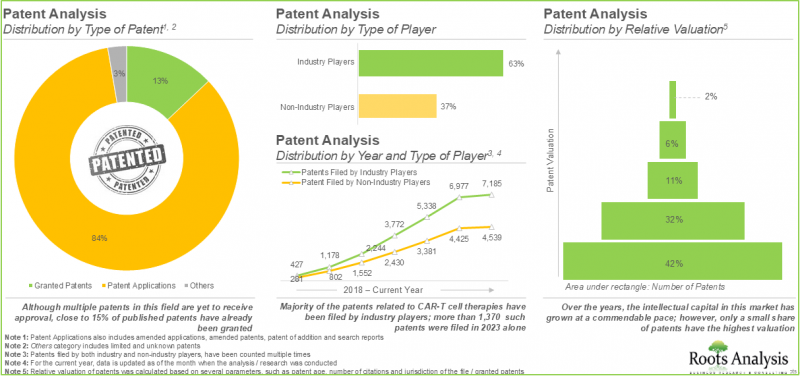
- 目前已提交超过11900项与CAR-T细胞疗法相关的专利申请,保护该领域产生的智慧财产权。
- 为了有效推广这些疗法并保持在 CAR T 细胞疗法市场中的地位,药物研发人员正在积极探索各种推广策略。
- 鑑于癌症发病率的上升、技术的进步以及持续的审批,CAR T 细胞疗法市场预计将在可预见的未来保持稳定成长。
- 由于研发管线日益受到关注以及令人鼓舞的临床结果,预计未来十年该市场将以超过 11.4% 的年增长率增长。
CAR T 细胞疗法市场的主要细分领域
在预测期内,多发性骨髓瘤可望主导 CAR T 细胞疗法市场。
依适应症划分,此市场可细分为急性淋巴性白血病、瀰漫性大 B 细胞淋巴瘤、滤泡性淋巴瘤、大 B 细胞淋巴瘤、套细胞淋巴瘤、多发性骨髓瘤和其他疾病。 值得注意的是,用于治疗大B细胞淋巴瘤的CAR-T疗法市场预计在预测期内将以14%的复合年增长率成长。
预计在预测期内,靶向CD19的疗法将占CAR-T细胞疗法市场最大的占有率。
以标靶抗原划分,该市场可分为CD19、BCMA、CD20、CD19/CD22和其他。值得注意的是,CD19标靶疗法在未来几年内可能占到整个市场的65%以上。
这主要归功于 CD19 标靶疗法的成功,例如 Kymriah®(tisagenlecleucel)和 Yescarta®(axicabtagene ciloleucel)。北美将占最大的市场占有率。
依主要地区划分,市场分为北美、欧洲、亚太、拉丁美洲、中东和北非以及世界其他地区。
值得注意的是,亚太市场预计将以较高的复合年增长率成长。CAR-T细胞疗法市场参与者范例
- Autolus
- Bluebird Bio
- Bristol Myers Squibb
- Carsgen Therapeutics
- Cellectis, Gilead Sciences
- Innovative Cellular Therapeutics
- Noile-Immune Biotech
- Novartis
- Shanghai GeneChem
- Sinobioway Cell Therapy
- Takara Bio
- Wellington Zhaotai Therapies
初步研究概要
本研究中提出的观点和见解受到了与多位利害关係人讨论的影响。
本研究报告包含以下产业利害关係人的详细访谈:- A公司执行长
- B公司执行长
- C公司营运长
- D公司科学事务副总裁
- E公司免疫肿瘤学副总裁
- F公司Weissman Biomanufacturing策略与业务发展竞争情报经理兼业务发展经理
- G公司医学教授兼肿瘤内科主任
- H公司医学助理教授
CAR-T细胞疗法市场研究涵盖范围
- 市场预测与机会分析:本研究报告对CAR-T细胞疗法市场进行了深入分析,重点关注以下关键市场细分领域:[A]标靶抗原,[B]适应症,[C]主要区域分析,[D]药物销售预测,以及[E]关键因素公司。
- 市场影响分析:分析影响市场成长的各种因素,包括[A]推动因素、[B]阻碍因素、[C]市场推动因素和[D]挑战。
- 市场概况:对CAR-T细胞疗法的当前市场概况进行全面评估,考虑各种参数,例如[A]开发商类型、[B]研发阶段、[C]治疗领域、[D]主要适应症、[E]主要标靶抗原、[F]T细胞来源、[G]给药途径、[H]给药频率、[I]主要标靶抗原、[F]T细胞来源、[G]给药途径、[H]给药频率、[I]。
- 临床试验分析:基于以下参数对已完成、正在进行和计划中的临床试验进行深入分析:[A] 临床试验註册年份,[B] 入组患者人数,[C] 临床试验招募状态,[D] 临床试验阶段,[E] 目标患者群体,[F] 申办方/合作方类型,[G] 最活跃的参与者,以及 [H] 最活跃的临床试验的区域分布。
- 主要的洞察:分析从研究中获得的主要的洞察,重点关注与血液系统恶性肿瘤和实体瘤相关的常见目标抗原的竞争分析。此外,本章还包括基于以下参数对临床阶段 CAR T 细胞疗法的 CAR 构建体进行分析:[A] CAR 的生成,[B] 结合域类型,[C] 所用病毒类型,[D] 所用基因转移方法类型,以及 [E] 所用共刺激域类型。
- 关键意见领袖 (KOL):本章对该领域的关键意见领袖 (KOL) 进行了详细分析,包括对负责 CAR-T 疗法相关临床试验的各主要研究者的评估。这些研究者因其积极参与 CAR-T 细胞疗法的研发而被公认为 KOL。本章也利用专有的评分系统对 KOL 的专业知识进行了比较分析,并结合第三方评估结果。
- 公司简介:本章详细介绍了 CAR-T 细胞疗法市场的主要公司,重点关注 [A] 公司概况,[B] 专注于 CAR-T 疗法的产品组合,[C] 技术组合(如有),[D] 与 CAR-T 细胞疗法相关的最新进展,以及公司的生产能力。此外,本章也提供了这些公司的策略/效益分析。 还包括CAR资本投资的详细资讯。 它还包括CAR资本投资的详细资讯。
- 合作伙伴关係与合作:基于以下几个相关参数分析该领域已建立的合作伙伴关係:A) 合作年份,B) 合作类型,C) 合作伙伴类型,以及D) 区域分布。
- 融资与投资分析:基于以下几个相关参数分析该领域已报告的融资和投资:A) 融资年份,B) 融资类型,C) 投资金额,以及D) 区域分布。
- 专利分析:基于以下几个参数,对超过11,900项与CAR T细胞疗法相关的已申请或已授权专利进行深入分析:A) 专利类型,B) 公开年份,C) 区域分布,D) 专利合作分类(CPC)符号,E) 新兴重点领域,F) 申请人,G) 主要参与者(基于专利/专利数量),以及专利数量。
- 案例研究:重点关注细胞治疗产品生产的案例研究,着重介绍面临的挑战,并提供该领域相关合约服务提供者和内部生产商的完整清单。
- 成本定价分析:对影响细胞治疗定价的各种因素进行全面评估,包括製药公司在确定即将推出的 CAR-T 细胞疗法的价格时可能考虑的各种模型和策略。
目录
第1章 序文
第2章 调查手法
第3章 经济以及其他的计划特有的考虑事项
第4章 摘要整理
第5章 简介
- 章概要
- T细胞免疫疗法概要
- 历史的演进
- T细胞免疫疗法的开发上重要的考虑事项
- T细胞的转换方向所采用的策略
- 改变T细胞的製造
- 嵌合抗原受体T细胞(CAR T)疗法
- 发展历史
- CAR结构
- CAR T细胞的开发
- 通用CAR T细胞
- 给药途径
- CAR T细胞疗法伴随的课题
- 结论
第6章 CAR T细胞疗法:市场形势
- 章概要
- CAR T细胞疗法:市场形势
- CAR T细胞疗法:开发企业的全体形势
第7章 重要的洞察
- 章概要
- CAR T细胞疗法:受欢迎的标的抗原
- 造血恶性肿瘤的标的
- 固态肿瘤的一般的标的
- CAR T疗法:CAR结构分析
第8章 临床试验的分析
- 章概要
- 范围与调查手法
- CAR T细胞疗法:临床试验分析
第9章 主要意见领袖
- 章概要
- 前提主要的参数
- 调查手法
- CAR T细胞疗法:主要意见领袖
第10章 企业简介
- 章概要
- Autolus
- Bluebird Bio
- Bristol Myers Squibb
- CARsgen Therapeutics
- Cellectis
- Gilead Sciences
- Innovative Cellular Therapeutics
- Noile-Immune Biotech
- Novartis
- Sinobioway Cell Therapy
- Takara Bio
- Wellington Zhaotai Therapies
第11章 伙伴关係和合作
- 章概要
- 伙伴关係模式
- CAR T细胞疗法:伙伴关係和合作
第12章 资金筹措与投资分析
- 章概要
- 资金筹措的种类
- CAR T细胞疗法:资金筹措和投资分析
第13章 专利分析
- 章概要
- 范围与调查手法
- CAR T细胞疗法:专利分析
- 专利基准分析
- 专利评估
- 高引用专利
第14章 案例研究:细胞治疗的製造
- 章概要
- 细胞治疗製造概要
- 细胞治疗製造模式
- 集中型製造模式
- 分散式製造模式
- 细胞治疗製造流程的可扩展性
- 细胞治疗製造商种类
- 细胞治疗的製造相关的主要课题
- 细胞治疗药製造上重要的考虑事项
- 细胞治疗製造流程的自动化
- 细胞治疗製造供应链
- 自家公司製造能力的企业和委託製造企业的比较
- 法规情形
- 未来展望
第15章 原价分析
- 章概要
- 为细胞·基因治疗的高价格化贡献的要素
- T细胞免疫疗法的定价模式
- T细胞免疫疗法的偿付相关考虑事项
第16章 市场影响分析:促进因素,阻碍因素,机会,课题
第17章 全球CAR T细胞疗法市场
第18章 CAR T细胞疗法市场(标的抗原)
第19章 CAR T细胞疗法市场(各适应症)
第20章 CAR T细胞疗法市场(各主要地区)
第21章 CAR T疗法市场,医药品的销售额预测
- 章概要
- 主要的前提与调查手法
- 上市的CAR T细胞疗法:预测销售额
- 临床CAR T细胞疗法:预测销售额
- 资料三角验证
第22章 CAR T细胞疗法市场:主要企业的销售额预测
- 章概要
- 主要的前提与调查手法
- CAR T细胞疗法:主要加入企业
- Gilead Sciences的销售额预测
- Bristol Myers Squibb的销售额预测
- Novartis的销售额预测
- Janssen的销售额预测
- JW Therapeutics的销售额预测
- 资料三角验证
第23章 推销分析
- 章概要
- 推销宣传活动所使用的流通管道
- 产品网站分析的摘要
- 患者支援服务和资讯下载的摘要
- Kymriah:推销分析
- Yescarta:推销分析
- Tecartus:推销分析
- Breyanzi:推销分析
- Abecma:推销分析
- Carvykti:推销分析
第24章 执行洞察
第25章 结论
第26章 附录I:表资料
第27章 附录II:企业及组织一览
第28章 附录III:资金及投资一览
CAR T-Cell Therapy Market: Overview
As per Roots Analysis, the global CAR T-cell therapy market is estimated to grow from USD 4.6 billion in the current year to USD 15.2 billion by 2035, at a CAGR of 11.4% during the forecast period, till 2035.
The market sizing and opportunity analysis has been segmented across the following parameters:
Target Indication
- Acute Lymphoblastic Leukemia
- Diffuse Large B-cell Lymphoma
- Follicular Lymphoma
- Large B-cell Lymphoma
- Mantle Cell Lymphoma
- Multiple Myeloma
- Others
Target Antigen
- CD19
- BCMA
- CD20
- CD19 / CD22
- Others
Key Geographical Regions
- North America
- US
- Canada
- Europe
- Germany
- France
- Italy
- Spain
- UK
- Rest of Europe
- Asia-Pacific
- Japan
- India
- China
- Australia
- South Korea
- Rest of Asia Pacific
- Latin America
- Middle East and North Africa
- Rest of the World
Key Drugs
- Yescarta
- Kymriah
- Abecma
- Breyanzi
- Carvykti
- Tecartus
- Others
CAR T-Cell Therapy Market: Growth and Trends
Cancer research is one of the most active segments for drug development within the pharmaceutical sector. In fact, in recent years, the USFDA has authorized over 70 medications for various cancer treatments. Due to the difficulties linked with traditional treatments, pharmaceutical researchers are actively exploring more focused anti-cancer therapies. Among these, CAR T-cell therapies have appeared as a promising alternative. CAR T-cell treatment utilizes the body's natural immune response to identify and destroy cancer cells. CAR-T cell therapies have shown the ability to achieve total disease remission, eliminating the necessity for further treatment. Further, numerous studies have also confirmed the effectiveness of these therapy options. It is important to note that nearly 1,000 clinical trials associated with CAR-T cell therapies have been registered over the last eight years, showing significant research efforts. Currently, more than 230 firms are involved in development of CAR T-cell therapies for the treatment of different oncological, non-oncological and other disorders.
The CAR-T cell therapy market growth is driven by technological advancements in molecular research, the increased demand for personalized cancer treatment and increase in the number of clinical trials and multiple therapy approvals. Further, continuous financial support from investors is expected to propel the steady growth for the development of CAR-T cell therapy in the mid-to-long-term.
CAR T-Cell Therapy Market: Key Insights
The report delves into the current state of the CAR T-cell therapy market and identifies potential growth opportunities within the industry. Some key findings from the report include:
- CAR-T cell therapies, with over 1,240 preclinical / clinical product candidates, represent one of the most active segments in the pharmaceutical domain.
- Close to 75% of the therapy candidates, which are being developed to target a range of disease indications, are autologous in nature; notably, CD19 and BCMA have emerged as the most popular target antigens.
- Extensive efforts are underway to improve CAR constructs across successive generations, involving alterations in the scFv region via using different types of gene delivery vectors.
- Close to 200 players claim to have the required capabilities to manufacture different types of cell therapies; such firms also offer a wide range of services across different stages of product development.
- In the last eight years, over 970 clinical trials have been registered across different geographies for CAR-T cell therapies; extensive efforts are underway to improve successive generations of these therapies.
- 375+ scientists from renowned universities are presently involved in the clinical development of CAR-T cell therapies; these KOLs are primarily based in the US and China.
- The rise in partnerships, in the recent past, involving both international and indigenous stakeholders, validate the growing interest in this domain.
- Several investors, having realized the opportunity within this upcoming segment of cancer immunotherapy, have invested more than USD 32 billion, across 370+ instances.
- More than 11,900 patents related to CAR-T cell therapies have been filed / granted to protect the intellectual property generated within this field.
- In order to efficiently promote these therapies and sustain their position in the CAR-T cell therapies market, drug developers are actively exploring diverse promotional strategies.
- Considering the growing prevalence of cancer, technological developments and ongoing approvals, the market for CAR-T cell therapies is poised to witness steady growth in the foreseen future.
- With a growing focus on the development pipeline and encouraging clinical results, the market is expected to witness an annualized growth rate of over 11.4%, during the next decade.
CAR T-Cell Therapy Market: Key Segments
Multiple Myeloma is Likely to Dominate the CAR T-Cell Therapy Market During the Forecast Period
Based on target indication, the market is segmented into acute lymphoblastic leukemia, diffuse large B-cell lymphoma, follicular lymphoma, large B-cell lymphoma, mantle cell lymphoma, multiple myeloma and others. It is worth highlighting that the market for CAR-T therapies designed to treat large B-cell lymphoma is projected to grow at an annual growth rate of 14%, during the forecast period.
CD19 Targeting Therapies is Expected to Capture Largest Share in the CAR T-Cell Therapy Market During the Forecast Period
Based on target antigen, the market is segmented into CD19, BCMA, CD20, CD19 / CD22 and others. It is worth highlighting that the segment for CD19 is likely to capture more than 65% of the overall market in the coming years. This can be attributed to the success of CD19 targeting therapies, such as Kymriah(R) (tisagenlecleucel) and Yescarta(R) (axicabtagene ciloleucel).
North America Accounts for the Largest Share of the Market
Based on key geographical regions, the market is segmented into North America, Europe, Asia-Pacific, Latin America, Middle East and North Africa, and Rest of the World. It is worth highlighting that over the years, the market in Asia-Pacific is expected to grow at a higher CAGR.
Example Players in the CAR T-Cell Therapy Market
- Autolus
- Bluebird Bio
- Bristol Myers Squibb
- Carsgen Therapeutics
- Cellectis, Gilead Sciences
- Innovative Cellular Therapeutics
- Noile-Immune Biotech
- Novartis
- Shanghai GeneChem
- Sinobioway Cell Therapy
- Takara Bio
- Wellington Zhaotai Therapies
Primary Research Overview
The opinions and insights presented in this study were influenced by discussions conducted with multiple stakeholders. The research report features detailed transcripts of interviews held with the following industry stakeholders:
- Chief Executive Officer, Company A
- Chief Executive Officer, Company B
- Chief Operating Officer, Company C
- Vice President, Scientific Affairs, Company D
- Vice President, Immuno-Oncology, Company E
- Manager of Business Development, Waisman Biomanufacturing Competitive Intelligence Manager, Strategy & Business Development, Company F
- Professor of Medicine and Director, Department of Oncology, Company G
- Assistant Professor of Medicine, Company H
CAR T-Cell Therapy Market: Research Coverage
- Market Forecast and Opportunity Analysis: The report features an in-depth analysis of the CAR T-cell therapy market, focusing on key market segments, including [A] target antigens, [B] target indication, [C] key geographical regions, [D] sales forecast of drugs and [E] leading players.
- Market Impact Analysis: The report analyzes various factors such as [A] drivers, [B] restraints, [C] opportunities, and [D] challenges affecting market growth.
- Market Landscape: A comprehensive evaluation of the current market landscape of CAR-T cell therapies, considering various parameters, such as [A] type of developer, [B] phase of development, [C] therapeutic area, [D] key target indication, [E] key target antigen, [F] source of T-cells, [G] route of administration, [H] dose frequency, [I] patient segment, [J] type of therapy, [K] year of establishment, [L] company size and [M] location of headquarters.
- Clinical Trial Analysis: A detailed analysis of clinical trials, completed, ongoing, and planned clinical studies based on parameters, such as [A] trial registration year, [B] enrolled patient population, [C] trial recruitment status, [D] trial phase, [E] target patient segment, [F] type of sponsor / collaborator, [G] most active players and [H] regional distribution of trials.
- Key Insights: An analysis of key insights derived from the study featuring a competitive analysis, emphasizing the prevalent target antigens associated with hematological malignancies and solid tumors. Additionally, it includes CAR construct analysis of clinical-stage CAR T cell therapies based on the [A] generation of CAR, [B] type of binding domain, [C] type of virus used, [D] type of gene transfer method used, and [E] type of co-stimulatory domain used.
- Key Opinion Leaders: An in-depth analysis of key opinion leaders (KOLs) within this field includes an evaluation of various principal investigators overseeing clinical trials associated with CAR-T therapies. These investigators are recognized as KOLs due to their active engagement in the research and development of CAR T cell therapies. Additionally, the chapter provides a comparative analysis of the KOLs' expertise, utilizing a proprietary scoring system alongside assessments from third-party evaluations.
- Company Profiles: In-depth profiles of key players in CAR T-cell therapy market, focusing on [A] company overviews, [B] product portfolio specific to CAR-T therapies, [C] technology portfolio (if available), [D] recent developments related to CAR-T cell therapies and manufacturing capabilities of the companies. In addition, it also includes details of the strategic / venture capital investments made in these companies.
- Partnerships and Collaborations: An analysis of partnerships established in this domain, based on several relevant parameters, such as the [A] year of partnership, [B] type of partnership, [C] type of partner, and [D] geographical distribution.
- Funding and Investment Analysis: An analysis of funding and investment reported in this domain, based on several relevant parameters, such as the [A] year of funding, [B] type of funding, [C] amount invested, and [D] geographical distribution.
- Patent Analysis: Detailed analysis of over 11,900 patents filed or granted related to CAR T-cell therapies based on [A] type of patent, [B] publication year, [C] geographical distribution, [D] Cooperative Patent Classification (CPC) symbols, [E] emerging focus areas, [F] type of applicant, [G] leading players (on the basis of number of patents filed / granted), [H] patent valuation and [I] patent benchmarking.
- Case Study: A case study focused on the production of cell therapy products, emphasizing the challenges and providing a comprehensive list of contract service providers and in-house manufacturers involved in this domain.
- Cost Price Analysis: A comprehensive evaluation of the various factors that contribute to the pricing of cell-based therapies. It includes different models and strategies that a pharmaceutical company might consider when determining the price of a CAR-T cell therapy expected to be launched in the near future.
Key Questions Answered in this Report
- How many companies are currently engaged in this market?
- Which are the leading companies in this market?
- What kind of partnership models are commonly adopted by industry stakeholders?
- How many clinical trials are running for CAR-T therapies?
- What are the factors that are likely to influence the evolution of this market?
- What is the current and future market size?
- What is the CAGR of this market?
- How is the current and future market opportunity likely to be distributed across key market segments?
Reasons to Buy this Report
- The report provides a comprehensive market analysis, offering detailed revenue projections of the overall market and its specific sub-segments. This information is valuable to both established market leaders and emerging entrants.
- Stakeholders can leverage the report to gain a deeper understanding of the competitive dynamics within the market. By analyzing the competitive landscape, businesses can make informed decisions to optimize their market positioning and develop effective go-to-market strategies.
- The report offers stakeholders a comprehensive overview of the market, including key drivers, barriers, opportunities, and challenges. This information empowers stakeholders to stay abreast of market trends and make data-driven decisions to capitalize on growth prospects.
Additional Benefits
- Complimentary PPT Insights Packs
- Complimentary Excel Data Packs for all Analytical Modules in the Report
- 15% Free Content Customization
- Detailed Report Walkthrough Session with Research Team
- Free Updated report if the report is 6-12 months old or older
TABLE OF CONTENTS
1. PREFACE
- 1.1. Introduction
- 1.2. Market Share Insights
- 1.3. Key Market Insights
- 1.4. Report Coverage
- 1.5. Key Questions Answered
- 1.6. Chapter Outlines
2. RESEARCH METHODOLOGY
- 2.1. Chapter Overview
- 2.2. Research Assumptions
- 2.3. Project Methodology
- 2.4. Forecast Methodology
- 2.5. Robust Quality Control
- 2.6. Key Market Segmentations
- 2.7. Key Considerations
- 2.7.1. Demographics
- 2.7.2. Economic Factors
- 2.7.3. Government Regulations
- 2.7.4. Supply Chain
- 2.7.5. COVID Impact / Related Factors
- 2.7.6. Market Access
- 2.7.7. Healthcare Policies
- 2.7.8. Industry Consolidation
3. ECONOMIC AND OTHER PROJECT SPECIFIC CONSIDERATIONS
- 3.1. Chapter Overview
- 3.2. Market Dynamics
- 3.2.1. Time Period
- 3.2.1.1. Historical Trends
- 3.2.1.2. Current and Forecasted Estimates
- 3.2.2. Currency Coverage
- 3.2.2.1. Overview of Major Currencies Affecting the Market
- 3.2.2.2. Impact of Currency Fluctuations on the Industry
- 3.2.3. Foreign Exchange Impact
- 3.2.3.1. Evaluation of Foreign Exchange Rates and Their Impact on Market
- 3.2.3.2. Strategies for Mitigating Foreign Exchange Risk
- 3.2.4. Recession
- 3.2.4.1. Historical Analysis of Past Recessions and Lessons Learnt
- 3.2.4.2. Assessment of Current Economic Conditions and Potential Impact on the Market
- 3.2.5. Inflation
- 3.2.5.1. Measurement and Analysis of Inflationary Pressures in the Economy
- 3.2.5.2. Potential Impact of Inflation on the Market Evolution
- 3.2.1. Time Period
4. EXECUTIVE SUMMARY
5. INTRODUCTION
- 5.1. Chapter Overview
- 5.2. Overview of T-cell Immunotherapies
- 5.2.1. Historical Evolution
- 5.2.2. Key Considerations for Developing T-cell Immunotherapies
- 5.2.3. Strategies Employed for the Redirection of T-cells
- 5.2.4. Manufacturing of Engineered T-cells
- 5.3. Chimeric Antigen Receptor T-cell (CAR-T) Therapy
- 5.3.1. Development History
- 5.3.2. Structure of CAR
- 5.3.2.1. Ectodomain
- 5.3.2.2. Transmembrane (TM) Domain
- 5.3.2.3. Endodomain
- 5.3.3. Development of CAR-T Cells
- 5.3.4. Universal CAR-T Cells
- 5.3.5. Route of Administration
- 5.3.6. Challenges Associated with CAR-T Cell Therapies
- 5.3.6.1. Competitive Risks
- 5.3.6.2. Clinical Risks
- 5.3.6.3. Regulatory Risks
- 5.3.6.4. Commercial Risks
- 5.4. Concluding Remarks
6. CAR-T CELL THERAPIES: MARKET LANDSCAPE
- 6.1. Chapter Overview
- 6.2. CAR-T Cell Therapies: Market Landscape
- 6.2.2. Analysis by Stage of Development
- 6.2.3. Analysis by Type of Therapy
- 6.2.4. Analysis by Target Antigen
- 6.2.5. Analysis by Target Indication
- 6.2.6. Analysis by Therapeutic Area
- 6.2.7. Analysis by Stage of Development and Therapeutic Area
- 6.2.8. Analysis by Source of T-cells
- 6.2.9. Analysis by Stage of Development and Source of T-cells
- 6.2.10. Analysis by Route of Administration
- 6.2.11. Analysis by Dosage Regimen
- 6.2.12. Analysis by Target Patient Population
- 6.2.13. Most Active Industry Players: Analysis by Number of Therapies
- 6.2.14. Most Active Non-Industry Players: Analysis by Number of Therapies
- 6.3. CAR-T Cell Therapies: Overall Developer Landscape
- 6.3.1. Analysis by Year of Establishment
- 6.3.2. Analysis by Company Size
- 6.3.3. Analysis by Location of Headquarters
7. KEY INSIGHTS
- 7.1. Chapter Overview
- 7.2. CAR-T Cell Therapies: Popular Target Antigens
- 7.2.1. Popular Targets for Hematological Malignancies
- 7.2.2. Popular Targets for Solid Tumors
- 7.3. CAR-T Therapies: CAR Construct Analysis
- 7.3.1. Analysis by Generation of CAR
- 7.3.2. Analysis by Type of scFv Antibody Used
- 7.3.3. Analysis by Type of Virus Used
- 7.3.4. Analysis by Type of Gene Transfer Method Used
- 7.3.5. Analysis by Type of Co-Stimulatory Domain
8. CLINICAL TRIAL ANALYSIS
- 8.1. Chapter Overview
- 8.2. Scope and Methodology
- 8.3. CAR-T Cell Therapies: Clinical Trial Analysis
- 8.3.1. Analysis by Trial Registration Year
- 8.3.2. Analysis of Enrolled Patient Population by Trial Registration Year
- 8.3.3. Analysis by Trial Phase
- 8.3.4. Analysis of Enrolled Patient Population by Trial Phase
- 8.3.5. Analysis by Trial Registration Year and Trial Phase
- 8.3.6. Analysis by Trial Status
- 8.3.7. Analysis by Patient Gender
- 8.3.8. Analysis by Therapeutic Area
- 8.3.9. Analysis by Study Design
- 8.3.10. Most Active Industry Players: Analysis by Number of Registered Trials
- 8.3.11. Most Active Non-Industry Players: Analysis by Number of Registered Trials
- 8.3.13. Analysis by Geography
9. KEY OPINION LEADERS
- 9.1. Chapter Overview
- 9.2. Assumptions and Key Parameters
- 9.3. Methodology
- 9.4. CAR-T Cell Therapies: Key Opinion Leaders
- 9.4.1. Analysis by Type of Organization
- 9.4.2. Analysis by Affiliated Organization
- 9.4.3. Analysis by Geographical Location of KOLs
- 9.4.4. KOL Activeness versus KOL Strength
- 9.4.5. Most Prominent KOLs: Analysis by RA score
- 9.4.6. Most Prominent KOLs: Comparison of RA Score and Third-Party Score
10. COMPANY PROFILES
- 10.1. Chapter Overview
- 10.2. Autolus
- 10.3. Bluebird Bio
- 10.4. Bristol Myers Squibb
- 10.5. CARsgen Therapeutics
- 10.6. Cellectis
- 10.7. Gilead Sciences
- 10.8. Innovative Cellular Therapeutics
- 10.9. Noile-Immune Biotech
- 10.10. Novartis
- 10.11. Sinobioway Cell Therapy
- 10.12. Takara Bio
- 10.13. Wellington Zhaotai Therapies
11. PARTNERSHIPS AND COLLABORATIONS
- 11.1. Chapter Overview
- 11.2. Partnership Models
- 11.3. CAR-T Cell Therapies: Partnerships and Collaborations
- 11.3.1. Analysis by Year of Partnership
- 11.3.2. Analysis by Type of Partnership
- 11.3.3. Analysis by Year and Type of Partnership
- 11.3.4. Analysis by Type of Partner
- 11.3.5. Most Popular Therapies: Analysis by Number of Partnerships
- 11.3.6. Most Active Industry Players: Analysis by Number of Partnerships
- 11.3.7. Most Active Non-Industry Players: Analysis by Number of Partnerships
- 11.3.8. Analysis by Geography
- 11.3.8.1. Intercontinental and Intracontinental Agreements
- 11.3.8.2. International and Local Agreements
12. FUNDING AND INVESTMENTS ANALYSIS
- 12.1. Chapter Overview
- 12.2. Types of Funding
- 12.3. CAR-T Cell Therapies: Funding and Investment Analysis
- 12.3.1. Analysis by Year of Funding
- 12.3.2. Analysis of Amount Invested
- 12.3.3. Analysis by Type of Funding
- 12.3.4. Analysis by Amount Invested and Type of Funding
- 12.3.5. Analysis by Amount Invested by year and Type of Funding Analysis by Type of Investor
- 12.3.6. Analysis by Geography
- 12.3.7. Most Active Players
- 12.3.8. Leading Investors: Analysis by Number of Funding Instances
13. PATENT ANALYSIS
- 13.1. Chapter Overview
- 13.2. Scope and Methodology
- 13.3. CAR-T Cell Therapies: Patent Analysis
- 13.3.1. Analysis by Patent Publication Year
- 13.3.2. Analysis by Patent Application Year
- 13.3.3. Analysis of Granted Patents and Patent Applications by Publication Year
- 13.3.4. Analysis by Patent Jurisdiction
- 13.3.5. Analysis by CPC Symbols
- 13.3.6. Analysis by Type of Applicant
- 13.3.7. Leading Industry Players: Analysis by Number of Patents
- 13.3.8. Leading Non-Industry Players: Analysis by Number of Patents
- 13.3.9. Leading Patent Assignees: Analysis by Number of Patents
- 13.4. Patent Benchmarking Analysis
- 13.4.1. Analysis by Patent Characteristics
- 13.5. Patent Valuation
- 13.6. Leading Patents by Number Of Citations
14. CASE STUDY: CELL THERAPY MANUFACTURING
- 14.1. Chapter Overview
- 14.2. Overview of Cell Therapy Manufacturing
- 14.3. Cell Therapy Manufacturing Models
- 14.3.1. Centralized Manufacturing Model
- 14.3.2. Decentralized Manufacturing Model
- 14.4. Scalability of Cell Therapy Manufacturing Processes
- 14.4.1. Scale-Up
- 14.4.2. Scale-Out
- 14.5. Types of Cell Therapy Manufacturers
- 14.6. Key Challenges Related to Manufacturing of Cell Therapies
- 14.7. Key Considerations for Cell Therapy Manufacturing
- 14.7.1. Characterization
- 14.7.2. Cost of Goods
- 14.8. Automation of Cell Therapy Manufacturing Process
- 14.9. Cell Therapy Manufacturing Supply Chain
- 14.10. Comparison of Players Having In-house Capabilities and Contract Manufacturers
- 14.11. Regulatory Landscape
- 14.12. Future Perspectives
15. COST PRICE ANALYSIS
- 15.1. Chapter Overview
- 15.2. Factors Contributing to the High Price of Cell / Gene Therapies
- 15.3. Pricing Models for T-cell Immunotherapies
- 15.3.1. Based on Associated Costs
- 15.3.2. Based on Availability of Competing Products
- 15.3.3. Based on Patient Population
- 15.3.4. Based on Opinions of Industry Experts
- 15.4. Reimbursement related Considerations for T-cell Immunotherapies
- 15.4.1. Case Study: The National Institute for Health and Care Excellence (NICE) Appraisal of CAR-T Therapies
16. MARKET IMPACT ANALYSIS: DRIVERS, RESTRAINTS, OPPORTUNITIES AND CHALLENGES
- 16.1. Chapter Overview
- 16.2. Market Drivers
- 16.3. Market Restraints
- 16.4. Market Opportunities
- 16.5. Market Challenges
- 16.6. Conclusion
17. GLOBAL CAR-T CELL THERAPY MARKET
- 17.1. Chapter Overview
- 17.2. Key Assumptions and Methodology
- 17.3. Global CAR-T Cell Therapy Market, Historical Trends (since 2018) and Future Estimates (till 2035)
- 17.4. Scenario Analysis
- 17.4.1. Conservative Scenario
- 17.4.2. Optimistic Scenario
- 17.5. Key Market Segmentations
18. CAR-T CELL THERAPY MARKET, BY TARGET ANTIGEN
- 18.1. Chapter Overview
- 18.2. Key Assumptions and Methodology
- 18.3. CAR-T Cell Therapies Market: Distribution by Type Target Antigen, Current Year and 2035
- 18.3.1. CART-T Cell Therapies Market for CD19: Forecasted Estimates (till 2035)
- 18.3.2. CART-T Cell Therapies Market FOR BCMA: Forecasted Estimates (till 2035)
- 18.3.3. CART-T Cell Therapies Market FOR CD20: Forecasted Estimates (till 2035)
- 18.3.4. CART-T Cell Therapies Market for CD19 / CD22: Forecasted Estimates (2025-2035)
- 18.3.5. CAR-T Cell Therapies Market for Other Target Antigens: Forecasted Estimates (till 2035)
- 18.4. Data Triangulation and Validation
19. CAR-T CELL THERAPY MARKET, BY TARGET INDICATION
- 19.1. Chapter Overview
- 19.2. Key Assumptions and Methodology
- 19.3. CAR-T Cell Therapies Market: Distribution by Target Indication, Current Year and 2035
- 19.3.1. CAR-T Cell Therapies Market for Multiple Myeloma: Forecasted Estimates (till 2035)
- 19.3.2. CAR-T Cell Therapies Market for Large B-Cell Lymphoma: Forecasted Estimates (till 2035)
- 19.3.3. CAR-T Cell Therapies Market for Acute Lymphoblastic Leukemia: Forecasted Estimates (till 2035)
- 19.3.4. CAR-T Cell Therapies Market for Diffuse Large B-Cell Lymphoma: Forecasted Estimates (till 2035)
- 19.3.5. CAR-T Cell Therapies Market for Diffuse Large B-Cell Lymphoma and Large B-Cell Lymphoma: Forecasted Estimates (till 2035)
- 19.3.6. CAR-T Cell Therapies Market for Acute Lymphoblastic Leukemia/ B-cell Non-Hodgkin Lymphoma: Forecasted Estimates (till 2035)
- 19.3.7. CAR-T Cell Therapies Market for Non-Hodgkin Lymphoma: Forecasted Estimates (till 2035)
- 19.3.8. CAR-T Cell Therapies Market for Mantle Cell Lymphoma: Forecasted Estimates (till 2035)
- 19.3.9. CAR-T Cell Therapies Market for Acute Myeloid Leukemia: Forecasted Estimates (till 2035)
- 19.3.10. CAR-T Cell Therapies Market for Generalized Myasthenia Gravis: Forecasted Estimates (till 2035)
- 19.3.11. CAR-T Cell Therapies Market for Renal Transplantation: Forecasted Estimates (till 2035)
- 19.3.12. CAR-T Cell Therapies Market for Gastric Adenocarcinoma: Forecasted Estimates (till 2035)
- 19.3.13. CAR-T Cell Therapies Market for Ovarian / Endometrial cancer: Forecasted Estimates (till 2035)
- 19.3.14. CAR-T Cell Therapies Market for Chronic Lymphocytic Leukemia: Forecasted Estimates (till 2035)
- 19.3.15. CAR-T Cell Therapies Market for Follicular Lymphoma: Forecasted Estimates (till 2035)
- 19.3.16. CAR-T Cell Therapies Market for Renal Cell Carcinoma: Forecasted Estimates (till 2035)
- 19.6. Data Triangulation and Validation
20. CAR-T CELL THERAPY MARKET: DISTRIBUTION BY KEY GEOGRAPHICAL REGIONS
- 20.1. Chapter Overview
- 20.2. Key Assumptions and Methodology
- 20.3. CAR-T Cell Therapy Market: Distribution by Key Geographical Regions, Current Year and 2035
- 20.3.1. CAR-T Cell Therapy Market in North America: Forecasted Estimates (till 2035)
- 20.3.2. CAR-T Cell Therapy Market for Europe: Forecasted Estimates (till 2035)
- 20.3.3. CAR-T Cell Therapy Market for Asia-Pacific: Forecasted Estimates (till 2035)
- 20.3.4. CAR-T Cell Therapy Market for Latin America: Forecasted Estimates (till 2035)
- 20.3.5. CAR-T Cell Therapy Market for Middle East and North Africa: Forecasted Estimates (till 2035)
- 20.3.6. CAR-T Cell Therapy Market for Rest of the World: Forecasted Estimates (till 2035)
- 20.4. Data Triangulation and Validation
21. CAR-T THERAPY MARKET, SALES FORECAST OF DRUGS
- 21.1. Chapter Overview
- 21.2. Key Assumptions and Methodology
- 21.3. Commercialized CAR-T Cell Therapies: Sales Forecast
- 21.3.1. Kymriah (Tisagenlecleucel-T) Sales Forecast
- 21.3.2. Yescarta (axicabtagene ciloleucel) Sales Forecast
- 21.3.3. Tecartus (Brexucabtagene Autoleucel) Sales Forecast
- 21.3.4. Abecma (Idecabtagene Vicleucel / bb211211) Sales Forecast
- 21.3.5. CARVYKTI (LCAR-B38M CAR-T / JNJ-6821845218 / Ciltacabtagene Autoleucel) Sales Forecast
- 21.3.6. BREYANZI (Lisocabtagene maraleucel, JCAR017) Sales Forecast
- 21.3.7. Carteyva (Relmacabtagene autoleucel / JWCAR0219) Sales Forecast
- 21.3.8. NexCART Sales Forecast
- 21.3.9. Fucaso (Equecabtagene Autoleucel) Sales Forecast
- 21.3.10. Inaticabtagene Autoleucel CNCT19 / HY001Sales Forecast
- 21.3.11. Zevorcabtagene autoleucel (CT053) Sales Forecast
- 21.4. Clinical CAR-T Cell Therapies: Sales Forecast
- 21.4.1. CAR-BCMA T cells Sales Forecast
- 21.4.2. CAR-T-CD19 Cells Sales Forecast
- 21.4.3. Descartes-08 Sales Forecast
- 21.4.4. Zamtocabtagene Autoleucel (MB-CART21019.1) Sales Forecast
- 21.4.5. CAR-T ddBCMA Sales Forecast
- 21.4.6. CRG-02121 cells Sales Forecast
- 21.4.7. CT041 Sales Forecast
- 21.4.8. ALLO-501A / ALLO-501 Sales Forecast
- 21.4.9. ALLO-605 Sales Forecast
- 21.4.10. Descartes-25 Sales Forecast
- 21.4.11. AUTO1 Sales Forecast
- 21.4.12. AUTO3 (CD19/2121 CAR-T) Sales Forecast
- 21.4.13. AUTO4 (CD19/2121 CAR-T) Sales Forecast
- 21.4.14. CD19-CAR-T Sales Forecast
- 21.4.15. Humanized CD19-CAR-T Sales Forecast
- 21.4.16. IM19 CAR-T Sales Forecast
- 21.4.17. CCT301 CAR-T Sales Forecast
- 21.4.18. CARCIK-CD19 Sales Forecast
- 21.4.19. CD123 CAR-T cells Sales Forecast
- 21.4.20. BCMA CAR-T Sales Forecast
- 21.4.21. CD19/CD22-CAR-T Sales Forecast
- 21.4.22. GC012F (Dual CAR-BCMA- 19) Sales Forecast
- 21.4.23. CD19/CD210-CART Sales Forecast
- 21.4.24. CD7 CAR-T Sales Forecast
- 21.4.25. Anti-FLT3 CAR-T / TAA05 Sales Forecast
- 21.4.26. Anti-ALPP CAR-T Cells Sales Forecast
- 21.4.27. WU CART 007 Sales Forecast
- 21.4.28. CTX110 Sales Forecast
- 21.4.29. TX2100-TR101 Sales Forecast
- 21.4.30. ALETA-001 Sales Forecast
- 21.4.31. PBCAR0191 Sales Forecast
- 21.5. Data Triangulation and Validation
22. CAR-T CELL THERAPY MARKET: SALES FORECAST OF LEADING PLAYERS
- 22.1. Chapter Overview
- 22.2. Key Assumptions and Methodology
- 22.3. CAR-T Cell Therapies: Leading Players
- 22.3.1. Gilead Sciences Sales Forecast
- 22.3.2. Bristol Myers Squibb Sales Forecast
- 22.3.3. Novartis Sales Forecast
- 22.3.4. Janssen Sales Forecast
- 22.3.5. JW Therapeutics Sales Forecast
- 22.4. Data Triangulation and Validation
23. PROMOTIONAL ANALYSIS
- 23.1. Chapter Overview
- 23.2. Channels Used for Promotional Campaigns
- 23.3. Summary of Product Website Analysis
- 23.4. Summary of Patient Support Services and Informative Downloads
- 23.5. Kymriah: Promotional Analysis
- 23.5.1. Drug Overview
- 23.5.2. Product Website Analysis
- 23.5.2.1. Message for Healthcare Professionals
- 23.5.2.2. Message for Patients
- 23.5.2.3. Informative Downloads
- 23.5.3. Patient Support Services
- 23.6. Yescarta: Promotional Analysis
- 23.6.1. Drug Overview
- 23.6.2. Product Website Analysis
- 23.6.2.1. Message for Healthcare Professionals
- 23.6.2.2. Message for Patients
- 23.6.2.3. Informative Downloads
- 23.6.3. Patient Support Services
- 23.7. Tecartus: Promotional Analysis
- 23.7.1. Drug Overview
- 23.7.2. Product Website Analysis
- 23.7.2.1. Message for Healthcare Professionals
- 23.7.2.2. Message for Patients
- 23.7.2.3. Informative Downloads
- 23.7.3. Patient Support Services
- 23.8. Breyanzi: Promotional Analysis
- 23.8.1. Drug Overview
- 23.8.2. Product Website Analysis
- 23.8.2.1. Message for Healthcare Professionals
- 23.8.2.2. Message for Patients
- 23.8.2.3. Informative Downloads
- 23.8.3. Patient Support Services
- 23.9. Abecma: Promotional Analysis
- 23.9.1. Drug Overview
- 23.9.2. Product Website Analysis
- 23.9.2.1. Message for Healthcare Professionals
- 23.9.2.2. Message for Patients
- 23.9.2.3. Informative Downloads
- 23.9.3. Patient Support Services
- 23.10. Carvykti: Promotional Analysis
- 23.10.1. Drug Overview
- 23.10.2. Product Website Analysis
- 23.10.2.1. Message for Healthcare Professionals
- 23.10.2.2. Message for Patients
- 23.10.2.3. Informative Downloads
- 23.10.3. Patient Support Services
24. EXECUTIVE INSIGHTS
- 24.1. Chapter Overview
- 24.2. Company A
- 24.2.1. Interview Transcript
- 24.3. Company B
- 24.3.1. Interview Transcript
- 24.4. Company C
- 24.4.1. Interview Transcript
- 24.5. Company D
- 24.5.1 Interview Transcript
- 24.6. Company E
- 24.6.1. Interview Transcript
- 24.7. Company F
- 24.7.1. Interview Transcript
- 24.8. Company G
- 24.8.1. Interview Transcript
- 24.9. Company H
- 24.9.1. Interview Transcript
- 24.10. Company I
- 24.10.1. Interview Transcript
- 24.11. Company J
- 24.11.2. Interview Transcript
25. CONCLUDING REMARKS
26. APPENDIX I: TABULATED DATA
27. APPENDIX II: LIST OF COMPANIES AND ORGANIZATIONS
28. APPENDIX III: LIST OF FUNDING AND INVESTMENTS
List of Tables
- Table 5.1 Key Characteristics of CAR-T Cells
- Table 5.2 Comparison of First and Second-Generation CAR-Ts
- Table 6.1 CAR-T Cell Therapies: Approved and Clinical Pipeline
- Table 6.2 CAR-T Cell Therapies: Information on Route of Administration, Source of T-cell, Dosage Regimen, and Target Patient Population
- Table 6.3 CAR-T Cell Therapy: Preclinical Pipeline
- Table 6.4 List of CAR-T Cells Developers
- Table 10.1 Leading CAR-T Cell Therapy Developers
- Table 10.2 Autolus: Company Profile
- Table 10.3 bluebird Bio: Company Profile
- Table 10.4 Bristol Myers Squibb: Company Profile
- Table 10.5 CARsgen Therapeutics: Company Profile
- Table 10.6 Cellectis: Company Profile
- Table 10.7 Gilead Sciences: Company Profile
- Table 10.8 Innovative Cellular Therapeutics: Company Profile
- Table 10.9 Noile-Immune Biotech: Company Profile
- Table 10.10 Novartis: Company Profile
- Table 10.11 Sinobioway Cell Therapy: Company Profile
- Table 10.12 Takara Bio: Company Profile
- Table 10.13 Wellington Zhaotai Therapies: Company Profile
- Table 11.1 CAR T Cell Therapy: List of Partnerships and Collaborations
- Table 12.1 CAR T Cell Therapies: Funding and Investments, Since 2018
- Table 12.2 CAR T Cell Therapies: Summary of Investments
- Table 13.1 Patent Analysis: Prominent CPC Sections
- Table 13.2 Patent Analysis: Most Popular CPC Symbols
- Table 13.3 Patent Analysis: List of Top CPC Symbols
- Table 13.4 Patent Analysis: Summary of Benchmarking Analysis
- Table 13.5 Patent Analysis: Categorization based on Weighted Valuation Scores
- Table 14.1 Assessment Strategies for Different Manufacturing Processes
- Table 14.2 Advantages and Disadvantages of Centralized and Decentralized Manufacturing Models
- Table 14.3 Cell Therapy Manufacturing: Companies with In-house Capabilities and Contract Manufacturers
- Table 15.1 Price of Marketed Gene / Cell Therapies
- Table 15.2 Price of Marketed Targeted Drugs
- Table 15.3 CAR-T Cell Therapy: Expert Opinions on Pricing
- Table 15.4 CAR-T Cell Therapy: Reimbursement Landscape
- Table 21.1 CAR-T Cell Therapy: List of Forecasted Molecules
- Table 25.1 CAR-T Cell Therapy:Distribution by Stage of Development
- Table 25.2 CAR-T Cell Therapy: Distribution by Type of Therapy
- Table 25.3 CAR-T Cell Therapy: Distribution by Target Antigen
- Table 25.4 CAR-T Cell Therapy: Distribution by Target Indication
- Table 25.5 CAR-T Cell Therapy: Distribution by Target Therapeutic Area
- Table 25.6 CAR-T Cell Therapy: Distribution by Stage of Development and Therapeutic Area
- Table 25.7 CAR-T Cell Therapy: Distribution by Source of T- cells
- Table 25.8 CAR-T Cell Therapy: Distribution by Stage of Development and Source of T- cells
- Table 25.9 CAR-T Cell Therapy: Distribution by Route of Administration
- Table 25.10 CAR-T Cell Therapy: Distribution by Dosage Regimen
- Table 25.11 CAR-T Cell Therapy: Distribution by Target Patient Population
- Table 25.12 Most Active Industry Players: Distribution by Number of CAR-T Cell Therapies
- Table 25.13 Most Active Non-Industry Players: Distribution by Number of CAR-T Cell Therapies
- Table 25.14 CAR-T Cell Therapy Developers Distribution by Year of Establishment
- Table 25.15 CAR-T Cell Therapy Developers: Distribution by Company Size
- Table 25.16 CAR-T Cell Therapy Developers: Distribution by Location of Headquarters (Region wise)
- Table 25.17 CAR-T Cell Therapy: Distribution by Location of Headquarters (Country wise)
- Table 25.18 CAR-T Cell Therapies: Popular Targets in Hematological Malignancies
- Table 25.19 CAR-T Cell Therapies: Popular Targets in Solid Tumors
- Table 25.20 CAR-Construction: Distribution by Generation of CAR
- Table 25.21 CAR-Construction: Distribution by Type of scFv Antibody Used
- Table 25.22 CAR-Construction: Distribution by Type of Virus Used
- Table 25.23 CAR-Construction: Distribution by Type of Gene Transfer Method Used
- Table 25.24 CAR-Construction: Distribution by Type of Co-Stimulatory Domain
- Table 25.25 Clinical Trial Analysis: Cumulative Year-wise Trend
- Table 25.26 Clinical Trial Analysis: Year- wise Trend of Patients Enrolled by Trial Registration Year
- Table 25.27 Clinical Trial Analysis: Distribution by Trial Phase
- Table 25.28 Clinical Trial Analysis: Distribution by Number of Patients Enrolled by Trial Phase
- Table 25.29 Clinical Trial Analysis: Distribution by Trial Registration Year and Trial Phase
- Table 25.30 Clinical Trial Analysis: Distribution by Trial Status
- Table 25.31 Clinical Trial Analysis: Distribution by Patient Gender
- Table 25.32 Clinical Trial Analysis: Distribution by Therapeutic Area
- Table 25.33 Clinical Trial Analysis: Distribution by Type of Trial Masking
- Table 25.34 Clinical Trial Analysis: Distribution by Type of Intervention Model
- Table 25.35 Clinical Trial Analysis: Distribution by Trial Purpose
- Table 25.36 Clinical Trial Analysis: Distribution by Design Allocation
- Table 25.37 Leading Industry Players: Distribution by Number of Registered Trials
- Table 25.38 Leading Non-industry Players: Distribution by Number of Registered Trials
- Table 25.39 Clinical Trial Analysis: Distribution of Clinical Trials by Status and Geography
- Table 25.40 Clinical Trial Analysis: Distribution of Patients Enrolled by Trial Status and Geography
- Table 25.41 KOL Analysis: Distribution by Type of Organization
- Table 25.42 KOL Analysis: Distribution by Affiliated Organization
- Table 25.43 KOL Analysis: Distribution by Qualification
- Table 25.44 CAR T-Cell Therapies: Geographical Distribution of KOLs
- Table 25.45 Most Prominent KOLs: Distribution by RA Score
- Table 25.46 Most Prominent KOLs: Comparison of RA Score with Third-Party Score
- Table 25.47 Partnerships and Collaborations: Cumulative Year-wise Trend
- Table 25.48 Partnerships and Collaborations: Distribution by Type of Partnership
- Table 25.49 Partnerships and Collaborations: Distribution by Type of Partnership
- Table 25.50 Partnerships and Collaborations: Distribution by Year of Partnership and Type of Partnership
- Table 25.51 Partnerships and Collaborations: Distribution by Type of Partner
- Table 25.52 Partnership and Collaborations: Year-Wise Distribution by Type of Partner
- Table 25.53 Most Popular Therapies: Distribution by Number of Partnerships
- Table 25.54 Most Active Industry Players: Distribution by Number of Partnerships
- Table 25.55 Most Active Non-Industry Players: Distribution by Number of Partnerships
- Table 25.56 Partnerships and Collaborations: Distribution by Intracontinental and Intercontinental Agreements
- Table 25.57 Partnerships and Collaborations: Distribution by Local and International Agreements
- Table 25.58 Funding and Investment: Cumulative Distribution of Instances by Year
- Table 25.59 Funding and Investment: Cumulative Distribution of Amount Invested by Year
- Table 25.60 Funding and Investment: Distribution of Instances by Type of Funding
- Table 25.61 Funding and Investment: Distribution of Total Amount Invested by Type of Funding (USD Million)
- Table 25.62 Funding and Investment: Distribution by Amount Invested and Type of Funding Year Wise
- Table 25.63 Funding and Investment: Distribution by Geography (Region)
- Table 25.64 Funding and Investment: Distribution by Geography (Country)
- Table 25.65 Most Active Players: Distribution by Lead Investors
- Table 25.66 Most Active Players: Distribution by Number of Funding Instances
- Table 25.67 Patent Analysis: Distribution by Type of Patent
- Table 25.68 Patent Analysis: Distribution by Patent Publication Year
- Table 25.69 Patent Analysis: Distribution by Patent Application Year
- Table 25.70 Patent Analysis: Year-wise Distribution of Granted Patents and Patent Applications
- Table 25.71 Patent Analysis: Distribution by Patent Jurisdiction
- Table 25.72 Patent Analysis: Cumulative Year-wise Distribution by Type of Applicant
- Table 25.73 Leading Industry Players: Distribution by Number of Patents
- Table 25.74 Leading Non-industry Players: Distribution by Number of Patents
- Table 25.75 Leading Individual Assignees: Distribution by Number of Patents
- Table 25.76 Patent Benchmarking Analysis: Distribution of Patent Characteristics (CPC Codes) by Leading Industry Players
- Table 25.77 Patent Benchmarking Analysis: Distribution of Leading Industry Players by Patent Characteristics (CPC Codes)
- Table 25.78 Patent Analysis: Distribution by Patent Age
- Table 25.79 CAR-T Cell Therapy: Patent Valuation
- Table 25.80. Global CAR-T Cell Therapy Market, Conservative, Base and Optimistic Scenario, till 2035 (USD Million)
- Table 25.81CAR-T Cell Therapy Market: Distribution by Target Antigen, Current Year and 2035
- Table 25.82CAR-T Cell Therapy Market for CD19: Forecasted Estimates (till 2035) (USD Million)
- Table 25.83 CAR-T Cell Therapy Market for BCMA: Forecasted Estimates (till 2035) (USD Million)
- Table 25.84CAR-T Cell Therapy Market for CD20: Forecasted Estimates (till 2035) (USD Million)
- Table 25.85CAR-T Cell Therapy Market for CD19/CD22: Forecasted Estimates (till 2035) (USD Million)
- Table 25.86CAR-T Cell Therapy Market for Other Target Antigen: Forecasted Estimates (till 2035) (USD Million)
- Table 25.87CAR-T Cell Therapy Market: Distribution by Target Indication, Current Year and 2035 (USD Million)
- Table 25.88 CAR-T Cell Therapy Market for Multiple Myeloma: Forecasted Estimates (till 2035) (USD Million)
- Table 25.89 CAR-T Cell Therapy Market for Large B-cell Lymphoma: Forecasted Estimates (till 2035) (USD Million)
- Table 25.90 CAR-T Cell Therapy Market for Acute Lymphoblastic Leukemia: Forecasted Estimates (till 2035) (USD Million)
- Table 25.91 CAR-T Cell Therapy Market for Diffuse Large B-cell Lymphoma: Forecasted Estimates (till 2035) (USD Million)
- Table 25.92 CAR-T Cell Therapy Market for Diffuse Large B-cell Lymphoma, Large B-cell Lymphoma: Forecasted Estimates (till 2035) (USD Million)
- Table 25.93 CAR-T Cell Therapy Market for Acute Lymphoblastic Leukemia / B-cell Non-Hodgkin Lymphoma: Forecasted Estimates (till 2035) (USD Million)
- Table 25.94 CAR-T Cell Therapy Market for Non-Hodgkin Lymphoma: Forecasted Estimates (till 2035) (USD Million)
- Table 25.95 CAR-T Cell Therapy Market for Mantle Cell Lymphoma: Forecasted Estimates (till 2035) (USD Million)
- Table 25.96 CAR-T Cell Therapy Market for Acute Myeloid Leukemia: Forecasted Estimates (till 2035) (USD Million)
- Table 25.97 CAR-T Cell Therapy Market for Generalized Myasthenia Gravis: Forecasted Estimates (till 2035) (USD Million)
- Table 25.98 CAR-T Cell Therapy Market for Renal transplantation: Forecasted Estimates (till 2035) (USD Million)
- Table 25.99 CAR-T Cell Therapy Market for Gastric Adenocarcinoma: Forecasted Estimates (till 2035) (USD Million)
- Table 25.100 CAR-T Cell Therapy Market for Ovarian and endometrial Cancer: Forecasted Estimates (till 2035) (USD Million)
- Table 25.101 CAR-T Cell Therapy Market for Chronic Lymphocytic Leukemia: Forecasted Estimates (till 2035) (USD Million)
- Table 25.102 CAR-T Cell Therapy Market for Follicular Lymphoma: Forecasted Estimates (till 2035) (USD Million)
- Table 25.103 CAR-T Cell Therapy Market for Renal Cell Carcinoma: Forecasted Estimates (till 2035) (USD Million)
- Table 25.104 CAR-T Cell Therapy Market: Distribution by Key Geographical Regions, Current Year and 2035
- Table 25.105 CAR-T Cell Therapy Market in North America: Forecasted Estimates (till 2035) (USD Million)
- Table 25.106 CAR-T Cell Therapy Market in Europe: Forecasted Estimates (till 2035) (USD Million)
- Table 25.107 CAR-T Cell Therapy Market in Asia Pacific: Forecasted Estimates (till 2035) (USD Million)
- Table 25.108 CAR-T Cell Therapy Market in Latin America: Forecasted Estimates (till 2035) (USD Million)
- Table 25.109 CAR-T Cell Therapy Market in Middle East and North Africa: Forecasted Estimates (till 2035) (USD Million)
- Table 25.110 CAR-T Cell Therapy Market in Rest of the World: Forecasted Estimates (till 2035) (USD Million)
- Table 25.111 CAR-T Cell Therapy Market for Kymriah (Tisagenlecleucel-T): Sales Forecast, till 2035 (USD Million)
- Table 25.112 CAR-T Cell Therapy Market for Yescarta (axicabtageneciloleucel): Sales Forecast, till 2035 (USD Million)
- Table 25.113 CAR-T Cell Therapy Market for Tecartus (BrexucabtageneAutoleucel): Sales Forecast, till 2035 (USD Million)
- Table 25.114 CAR-T Cell Therapy Market for Abecma (IdecabtageneVicleucel / bb2121): Sales Forecast, till 2035 (USD Million)
- Table 25.115 CAR-T Cell Therapy Market for CARVYKTI (LCAR-B38MCAR-T / JNJ-68284528 /Ciltacabtagene Autoleucel): Sales Forecast, till 2035, (USD Million)
- Table 25.116 CAR-T Cell Therapy Market for BREYANZI (Lisocabtagene maraleucel,JCAR017): Sales Forecast, till 2035 (USD Million)
- Table 25.117 CAR-T Cell Therapy Market for Carteyva (Relmacabtageneautoleucel / JWCAR029): Sales Forecast, till 2035, (USD Million)
- Table 25.118 CAR-T Cell Therapy Market for NexCART: Sales Forecast,till 2035, (USD Million)
- Table 25.119 CAR-T Cell Therapy Market for Fucaso (EquecabtageneAutoleucel): Sales Forecast, till 2035, (USD Million)
- Table 25.120 CAR-T Cell Therapy Market for Inaticabtagene AutoleucelCNCT19 / HY001: Sales Forecast, till 2035 (USD Million)
- Table 25.121 CAR-T Cell Therapy Market for Zevorcabtagene autoleucel (CT053): Sales Forecast, till 2035 (USD Million)
- Table 25.122 CAR-T Cell Therapy Market for CAR-BCMA T cells: Sales Forecast, till 2035 (USD Million)
- Table 25.123 CAR-T Cell Therapy Market for CAR-T-CD19 cells: Sales Forecast, till 2035 (USD Million)
- Table 25.124 CAR-T Cell Therapy Market for Descartes-08: Sales Forecast, till 2035 (USD Million)
- Table 25.125 CAR-T Cell Therapy Market for Zamtocabtagene Autoleucel (MB-CART2019.1): Sales Forecast, till 2035 (USD Million)
- Table 25.126 CAR-T Cell Therapy Market for CAR-T ddBCMA: Sales Forecast, till 2035 (USD Million)
- Table 25.127 CAR-T Cell Therapy Market for CRG-02121 cells: Sales Forecast, till 2035 (USD Million)
- Table 25.128 CAR-T Cell Therapy Market for CT041: Sales Forecast, till 2035, (USD Million)
- Table 25.129 CAR-T Cell Therapy Market for ALLO-501A / ALLO-501: Sales Forecast, till 2035, (USD Million)
- Table 23.130 CAR-T Cell Therapy Market for ALLO-605: Sales Forecast, till 2035 (USD Million)
- Table 25.131 CAR-T Cell Therapy Market for Descartes-25: Sales Forecast, till 2035 (USD Million)
- Table 25.132 CAR-T Cell Therapy Market for AUTO1: Sales Forecast, till 2035 (USD Million)
- Table 25.133 CAR-T Cell Therapy Market for AUTO3 (CD19/22 CAR-T): Sales Forecast, till 2035 (USD Million)
- Table 25.134 CAR-T Cell Therapy Market for AUTO4 (CD19/22 CAR-T): Sales Forecast, till 2035 (USD Million)
- Table 25.135 CAR-T Cell Therapy Market for CD19-CAR-T: Sales Forecast, till 2035 (USD Million)
- Table 25.136 CAR-T Cell Therapy Market for Humanized CD19-CAR-T: Sales Forecast, till 2035 (USD Million)
- Table 25.137 CAR-T Cell Therapy Market for IM19 CAR-T: Sales Forecast, till 2035 (USD Million)
- Table 25.138 CAR-T Cell Therapy Market for CCT301 CAR-T: Sales Forecast, till 2035 (USD Million)
- Table 25.139 CAR-T Cell Therapy Market for CARCIK-CD19: Sales Forecast, till 2035 (USD Million)
- Table 25.140 CAR-T Cell Therapy Market for CD123 CAR-T cells: Sales Forecast, till 2035 (USD Million)
- Table 25.141 CAR-T Cell Therapy Market for BCMA CAR-T: Sales Forecast, till 2035 (USD Million)
- Table 25.142 CAR-T Cell Therapy Market for CD19/CD22-CAR-T: Sales Forecast, till 2035 (USD Million)
- Table 25.143 CAR-T Cell Therapy Market for GC012F (Dual CAR-BCMA-19): Sales Forecast, till 2035 (USD Million)
- Table 25.144 CAR-T Cell Therapy Market for CD19/CD20-CART: Sales Forecast, till 2035 (USD Million)
- Table 25.145 CAR-T Cell Therapy Market for CD7 CAR-T: Sales Forecast, till 2035 (USD Million)
- Table 25.146 CAR-T Cell Therapy Market for Anti-FLT3 CAR-T /TAA05: Sales Forecast, till 2035 (USD Million)
- Table 25.147 CAR-T Cell Therapy Market for Anti-ALPP CAR-T Cells: Sales Forecast, till 2035 (USD Million)
- Table 25.148 CAR-T Cell Therapy Market for WU CART 007: Sales Forecast, till 2035 (USD Million)
- Table 25.149 CAR-T Cell Therapy Market for CTX110: Sales Forecast, till 2035 (USD Million)
- Table 25.150 CAR-T Cell Therapy Market for TX200-TR101: Sales Forecast, till 2035 (USD Million)
- Table 25.151 CAR-T Cell Therapy Market for ALETA-001: Sales Forecast, till 2035 (USD Million)
- Table 25.152 CAR-T Cell Therapy Market for PBCAR0191: Sales Forecast, till 2035 (USD Million)
- Table 25.153 CAR-T Cell Therapies Market: Distribution by Key Players
- Table 25.154 CAR-T Cell Therapies Market: Bristol Myers Squibb Sales Forecast, till 2035 (USD Million)
- Table 25.155 CAR-T Cell Therapies Market: Janssen Sales Forecast, till 2035 (USD Million)
- Table 25.156 CAR-T Cell Therapies Market: Gilead Sciences Sales Forecast, till 2035 (USD Million)
- Table 25.157 CAR-T Cell Therapies Market: JW Therapeutics Sales Forecast, till 2035 (USD Million)
- Table 25.158 CAR-T Cell Therapies Market: Novartis Sales Forecast, till 2035 (USD Million)
List of Figures
- Figure 2.1 Research Methodology: Research Assumptions
- Figure 2.2 Research Methodology: Project Methodology
- Figure 2.3 Research Methodology: Forecast Methodology
- Figure 2.4 Research Methodology: Robust Quality Control
- Figure 2.5 Research Methodology: Key Market Segmentations
- Figure 3.1 Lessons Learnt from Past Recessions
- Figure 4.1 Executive Summary: Market Landscape
- Figure 4.2 Executive Summary: Clinical Trial Analysis
- Figure 4.3 Executive Summary: Funding and Investments
- Figure 4.4 Executive Summary: Patent Analysis
- Figure 4.5 Executive Summary: Market Forecast and Opportunity Analysis
- Figure 5.1 Strategies Employed for the Redirection of T-Cells
- Figure 5.2 T-Cell Manufacturing: General Procedure
- Figure 5.3 Development History of CAR-T cells
- Figure 5.4 Structure of Chimeric Antigen Receptor
- Figure 5.5 Chimeric Antigen Receptors: Structural Variations across Different Generations
- Figure 5.6 CAR-T Cell Therapies: Development Process
- Figure 5.7 Challenges Associated with CAR-T-Cell Therapies
- Figure 6.1 CAR-T Cell Therapies: Distribution by Stage of Development
- Figure 6.2 CAR-T Cell Therapies: Distribution by Type of Therapy
- Figure 6.2 CAR-T Cell Therapies: Distribution by Target Antigen
- Figure 6.3 CAR-T Cell Therapies: Distribution by Target Indication
- Figure 6.4 CAR-T Cell Therapies: Distribution by Therapeutic Area
- Figure 6.5 CAR-T Cell Therapies: Distribution by Stage of Development and Therapeutic Area
- Figure 6.6 CAR-T Cell Therapies: Distribution by Source of T-cells
- Figure 6.7 CAR-T Cell Therapies: Distribution by Stage of Development and Source of T-cells
- Figure 6.8 CAR-T Cell Therapies: Distribution by Route of Administration
- Figure 6.9 CAR-T Cell Therapies: Distribution by Dosage Regimen
- Figure 6.10 CAR-T Cell Therapies: Distribution by Target Patient Population
- Figure 6.11 Most Active Industry Players: Analysis by Number of CAR-T Cell Therapies
- Figure 6.12 Most Active Non-Industry Players: Distribution by Number of CAR-T Cell Therapies
- Figure 6.13 CAR-T Cell Therapies Developers: Distribution by Year of Establishment
- Figure 6.14 CAR-T Cell Therapies Developers: Distribution by Company Size
- Figure 6.15 CAR-T Cell Therapies Developers: Distribution by Location of Headquarters (Region)
- Figure 6.16 CAR-T Cell Therapies Developers: Distribution by Location of Headquarters (Country)
- Figure 7.1 CAR-T Cell Therapies: Popular Targets in Hematological Malignancies
- Figure 7.2 CAR-T Cell Therapies: Popular Targets in Solid Tumors
- Figure 7.3 CAR-Construction: Distribution by Generation of CAR
- Figure 7.4 CAR-Construction: Distribution by Type of scFv Antibody
- Figure 7.5 CAR-Construction: Distribution by Type of Virus Used
- Figure 7.6 CAR-Construction: Distribution by Type of Gene Transfer Method Used
- Figure 7.7 CAR-Construction: Distribution by Type of Co-Stimulatory Domain
- Figure 8.1 Clinical Trial Analysis: Cumulative Year-wise Trend
- Figure 8.2 Clinical Trial Analysis: Year- wise Trend of Patients Enrolled by Trial Registration Year
- Figure 8.3 Clinical Trial Analysis: Distribution by Trial Phase
- Figure 8.4 Clinical Trial Analysis: Distribution of Number of Patients Enrolled by Trial Phase
- Figure 8.5 Clinical Trial Analysis: Distribution by Trial Registration Year and Trial Phase
- Figure 8.6 Clinical Trial Analysis: Distribution by Trial Status
- Figure 8.7 Clinical Trial Analysis: Distribution by Patient Gender
- Figure 8.8 Clinical Trial Analysis: Distribution by Therapeutic Area
- Figure 8.9 Clinical Trial Analysis: Distribution by Type of Trial Masking
- Figure 8.10 Clinical Trial Analysis: Distribution by Type of Intervention Model
- Figure 8.11 Clinical Trial Analysis: Distribution by Trial Purpose
- Figure 8.12 Clinical Trial Analysis: Distribution by Design Allocation
- Figure 8.13 Leading Industry Players: Distribution by Number of Registered Trials
- Figure 8.14 Leading Non-Industry Players: Distribution by Number of Registered Trials
- Figure 8.15 Clinical Trial Analysis: Distribution of Clinical Trials by Trial Status and Geography
- Figure 8.16 Clinical Trial Analysis: Distribution of Patients Enrolled by Trial Status and Geography
- Figure 9.1 KOL Analysis: Distribution by Type of Organization
- Figure 9.2 KOL Analysis: Distribution by Affiliated Organization
- Figure 9.3 KOL Analysis: Distribution by Qualification
- Figure 9.4 CAR T-Cell Therapies: Geographical Distribution of KOLs
- Figure 9.5 CAR T-Cell Therapies Scatter Plot: KOL Activeness versus KOL Strength
- Figure 9.6 Most Prominent KOLs: KOL Activeness versus KOL Strength
- Figure 9.7 Most Prominent KOLs: Distribution by RA Score
- Figure 9.8 Most Prominent KOLs: Comparison of RA Score with Third-Party Score
- Figure 9.9 Most Prominent KOLs: Comparison of RA Score with Third-Party Score
- Figure 11.1. Partnerships and Collaborations: Cumulative Year-wise Trend
- Figure 11.2. Partnerships and Collaborations: Distribution by Type of Partnership
- Figure 11.3. Partnerships and Collaborations: Distribution by Year and Type of Partnership
- Figure 11.4. Partnerships and Collaborations: Distribution by Type of Partner
- Figure 11.5. Most Popular Therapies: Distribution by Number of Partnerships
- Figure 11.6. Most Active Industry Players: Distribution by Number of Partnerships
- Figure 11.7. Most Active Non-Industry Players: Distribution by Number of Partnerships
- Figure 11.8. Partnerships and Collaborations: Distribution by Intracontinental and Intercontinental Agreements
- Figure 11.8. Partnerships and Collaborations: Distribution by Local and International Agreements
- Figure 12.1 Funding and Investment Analysis: Cumulative Year-wise Trend
- Figure 12.2 Funding and Investment Analysis: Distribution by Amount Invested
- Figure 12.3 Funding and Investment Analysis: Distribution by Type of Funding
- Figure 12.4 Funding and Investment Analysis: Distribution by Amount Invested and Type of Funding (USD Million)
- Figure 12.5 Year-wise Distribution of Amount Invested by Type of Funding, since 2018
- Figure 12.6 Funding and Investment Analysis: Distribution by Geography (Region)
- Figure 12.7 Funding and Investment Analysis: Distribution of Funding Instances by Geography (Country)
- Figure 12.8 Most Active Players: Distribution by Funding Instances
- Figure 12.9 Leading Investors: Distribution by Number of Funding Instances
- Figure 13.1 Patent Analysis: Distribution by Type of Patent
- Figure 13.2 Patent Analysis: Cumulative Year-wise Trend by Patent Publication Year, since 2018
- Figure 13.3 Patent Analysis: Cumulative Year-wise Trend by Patent Application Year
- Figure 13.4 Patent Analysis: Year-wise Distribution of Granted Patents and Patent Applications, since 2018
- Figure 13.5 Patent Analysis: Distribution by Patent Jurisdiction
- Figure 13.6 Patent Analysis: Distribution by CPC Symbols
- Figure 13.7 Patent Analysis: Cumulative Year-wise Distribution by Type of Applicant
- Figure 13.8 Leading Industry Players: Distribution by Number of Patents
- Figure 13.9 Leading Non-industry Players: Distribution by Number of Patents
- Figure 13.10 Leading Individual Assignees: Distribution by Number of Patents
- Figure 13.11 Patent Benchmarking Analysis: Distribution of Patent Characteristics (CPC Codes) by Leading Industry Players
- Figure 13.12 Patent Benchmarking Analysis: Distribution of Leading Industry Players by Patent Characteristics (CPC Codes)
- Figure 13.13 Patent Analysis: Distribution by Patent Age
- Figure 13.14 CAR-T Cell Therapy: Patent Valuation
- Figure 14.1 Steps for Manufacturing Cell Therapies
- Figure 14.2 Centralized Manufacturing: Process Model
- Figure 14.3 Decentralized Manufacturing: Process Model
- Figure 14.4 Cell Therapy Manufacturing: Types of Manufacturers
- Figure 14.5 Cell Therapy: Challenges and Drivers
- Figure 14.6 Cell Therapies: Potency as Critical Quality Attribute
- Figure 14.7 Cell Therapy Manufacturing: Supply Chain Model
- Figure 14.8 Cell Therapy Manufacturing: Supply Chain Risk Assessment Considerations
- Figure 15.1 Approved T-Cell Therapies: Pricing Model based on Patient Segment
- Figure 16.1.CAR-T Cell Therapies: Market Drivers
- Figure 16.2.CAR-T Cell Therapies: Market Restraints
- Figure 16.3.CAR-T Cell Therapies: Market Opportunities
- Figure 16.4.CAR-T Cell Therapies: Market Challenges
- Figure 17.1.Global CAR-T Cell Therapy Market, Historical Trends (since 2018) and Forecasted Estimates (till 2035) (USD Million)
- Figure 17.2.Global CAR-T Cell Therapy Market, till 2035: Conservative Scenario (USD Million)
- Figure 17.3.Global CAR-T Cell Therapy Market, till 2035: Optimistic Scenario (USD Million)
- Figure 18.1. CAR-T Cell Therapy Market: Distribution by Target Antigen, Current Year and 2035
- Figure 18.2.CAR-T Cell Therapy Market for CD19: Forecasted Estimates (till 2035) (USD Billion)
- Figure 18.3.CAR-T Cell Therapy Market for BCMA: Forecasted Estimates (till 2035) (USD Billion)
- Figure 18.4.CAR-T Cell Therapy Market for CD20: Forecasted Estimates (till 2035) (USD Billion)
- Figure 18.5.CAR-T Cell Therapy Market for CD19/CD22: Forecasted Estimates (till 2035) (USD Billion)
- Figure 18.6.CAR-T Cell Therapy Market for Other Target Antigen: Forecasted Estimates (till 2035) (USD Billion)
- Figure 19.1. CAR-T Cell Therapy Market: Distribution by Target Indication, Current Year and 2035
- Figure 19.2.CAR-T Cell Therapy Market for Multiple Myeloma: Forecasted Estimates (till 2035) (USD Billion)
- Figure 19.3.CAR-T Cell Therapy Market for CAR-T Cell Therapies Market for Large B-cell Lymphoma: Forecasted Estimates (till 2035) (USD Billion)
- Figure 19.4.CAR-T Cell Therapy Market for Acute Lymphoblastic Leukemia: Forecasted Estimates (till 2035) (USD Billion)
- Figure 19.5.CAR-T Cell Therapy Market for Diffuse Large B-cell Lymphoma: Forecasted Estimates (till 2035) (USD Billion)
- Figure 19.6.CAR-T Cell Therapy Market for Diffuse Large B-cell Lymphoma and Large B-cell Lymphoma: Forecasted Estimates (till 2035) (USD Billion)
- Figure 19.7.CAR-T Cell Therapy Market for Acute Lymphoblastic Leukemia / B-cell Non-Hodgkin Lymphoma: Forecasted Estimates (till 2035) (USD Billion)
- Figure 19.8.CAR-T Cell Therapy Market for Non-Hodgkin Lymphoma: Forecasted Estimates (till 2035) (USD Billion)
- Figure 19.9.CAR-T Cell Therapy Market for Mantle Cell Lymphoma: Forecasted Estimates (till 2035) (USD Billion)
- Figure 19.10.CAR-T Cell Therapy Market for Acute Myeloid Leukemia: Forecasted Estimates (till 2035) (USD Billion)
- Figure 19.11.CAR-T Cell Therapy Market for Generalized Myasthenia Gravis: Forecasted Estimates (till 2035) (USD Billion)
- Figure 19.12.CAR-T Cell Therapy Market for Renal Transplantation: Forecasted Estimates (till 2035) (USD Billion)
- Figure 19.13.CAR-T Cell Therapy Market for Gastric Adenocarcinoma: Forecasted Estimates (till 2035) (USD Billion)
- Figure 19.14.CAR-T Cell Therapy Market for Ovarian / Endometrial Cancer: Forecasted Estimates (till 2035) (USD Billion)
- Figure 19.15.CAR-T Cell Therapy Market for Chronic Lymphocytic Leukemia: Forecasted Estimates (till 2035) (USD Billion)
- Figure 19.16.CAR-T Cell Therapy Market for Follicular Lymphoma: Forecasted Estimates (till 2035) (USD Billion)
- Figure 19.17.CAR-T Cell Therapy Market for Renal Cell Carcinoma: Forecasted Estimates (till 2035) (USD Billion)
- Figure 20.1. CAR-T Cell Therapy Market: Distribution by Key Geographical Regions,2024, 2030 and 2035
- Figure 20.2.CAR-T Cell Therapy Market in North America: Forecasted Estimates (till 2035) (USD Billion)
- Figure 20.3. CAR-T Cell Therapy Market in Europe: Forecasted Estimates (till 2035) (USD Billion)
- Figure 20.4. CAR-T Cell Therapy Market in Asia-Pacific: Forecasted Estimates (till 2035) (USD Billion)
- Figure 20.5.CAR-T Cell Therapy Market in Latin America: Forecasted Estimates (till 2035) (USD Billion)
- Figure 20.6. CAR-T Cell Therapy Market in Middle East and North Africa: Forecasted Estimates (till 2035) (USD Billion)
- Figure 20.7. CAR-T Cell Therapy Market in Rest of the World: Forecasted Estimates (till 2035) (USD Billion)
- Figure 21.1 CAR-T Cell Therapy Market for Kymriah (Tisagenlecleucel-T): Sales Forecast, till 2035 (USD Million)
- Figure 21.2 CAR-T Cell Therapy Market for Yescarta (axicabtageneciloleucel): Sales Forecast, till 2035 (USD Million)
- Figure 21.3 CAR-T Cell Therapy Marketfor Tecartus (BrexucabtageneAutoleucel): Sales Forecast, till 2035 (USD Million)
- Figure 21.4 CAR-T Cell Therapy Marketfor Abecma (IdecabtageneVicleucel / bb2121): Sales Forecast, till 2035 (USD Million)
- Figure 21.5 CAR-T Cell Therapy Marketfor CARVYKTI (LCAR-B38MCAR-T / JNJ-68284528 / Ciltacabtagene Autoleucel): Sales Forecast, till 2035, (USD Million)
- Figure 21.6 CAR-T Cell Therapy Marketfor BREYANZI (Lisocabtagene maraleucel, JCAR017): Sales Forecast, till 2035 (USD Million)
- Figure 21.7 CAR-T Cell Therapy Marketfor Carteyva (Relmacabtageneautoleucel / JWCAR029): Sales Forecast, till 2035, (USD Million)
- Figure 21.8 CAR-T Cell Therapy Marketfor NexCART: Sales Forecast,till 2035, (USD Million)
- Figure 21.9 CAR-T Cell Therapy Marketfor Fucaso (EquecabtageneAutoleucel): Sales Forecast, till 2035, (USD Million)
- Figure 21.10 CAR-T Cell Therapy Marketfor Inaticabtagene AutoleucelCNCT19 / HY001: Sales Forecast, till 2035 (USD Million)
- Figure 21.11 CAR-T Cell Therapy Marketfor Zevorcabtagene autoleucel (CT053): Sales Forecast, till 2035 (USD Million)
- Figure 21.12 CAR-T Cell Therapy Marketfor CAR-BCMA T cells: Sales Forecast, till 2035 (USD Million)
- Figure 21.13 CAR-T Cell Therapy Marketfor CAR-T-CD19 cells: Sales Forecast, till 2035 (USD Million)
- Figure 21.14 CAR-T Cell Therapy Marketfor Descartes-08: Sales Forecast, till 2035 (USD Million)
- Figure 21.15 CAR-T Cell Therapy Marketfor Zamtocabtagene Autoleucel (MB-CART2019.1): Sales Forecast, till 2035 (USD Million)
- Figure 21.16 CAR-T Cell Therapy Marketfor CAR-T ddBCMA: Sales Forecast, till 2035 (USD Million)
- Figure 21.17 CAR-T Cell Therapy Marketfor CRG-02121 cells: Sales Forecast, till 2035 (USD Million)
- Figure 21.18 CAR-T Cell Therapy Marketfor CT041: Sales Forecast, till 2035, (USD Million)
- Figure 21.19 CAR-T Cell Therapy Marketfor ALLO-501A / ALLO-501: Sales Forecast, till 2035, (USD Million)
- Figure 21.20 CAR-T Cell Therapy Marketfor ALLO-605: Sales Forecast, till 2035 (USD Million)
- Figure 21.21 CAR-T Cell Therapy Marketfor Descartes-25: Sales Forecast, till 2035 (USD Million)
- Figure 21.22 CAR-T Cell Therapy Marketfor AUTO1: Sales Forecast, till 2035 (USD Million)
- Figure 21.23 CAR-T Cell Therapy Marketfor AUTO3 (CD19/22 CAR-T): Sales Forecast, till 2035 (USD Million)
- Figure 21.24 CAR-T Cell Therapy Marketfor AUTO4 (CD19/22 CAR-T): Sales Forecast, till 2035 (USD Million)
- Figure 21.25 CAR-T Cell Therapy Marketfor CD19-CAR-T: Sales Forecast, till 2035 (USD Million)
- Figure 21.26 CAR-T Cell Therapy Marketfor Humanized CD19-CAR-T: Sales Forecast, till 2035 (USD Million)
- Figure 21.27 CAR-T Cell Therapy Marketfor IM19 CAR-T: Sales Forecast, till 2035 (USD Million)
- Figure 21.28 CAR-T Cell Therapy Marketfor CCT301 CAR-T: Sales Forecast, till 2035 (USD Million)
- Figure 21.29 CAR-T Cell Therapy Marketfor CARCIK-CD19: Sales Forecast, till 2035 (USD Million)
- Figure 21.30 CAR-T Cell Therapy Marketfor CD123 CAR-T cells: Sales Forecast, till 2035 (USD Million)
- Figure 21.31 CAR-T Cell Therapy Marketfor BCMA CAR-T: Sales Forecast, till 2035 (USD Million)
- Figure 21.32 CAR-T Cell Therapy Marketfor CD19/CD22-CAR-T: Sales Forecast, till 2035 (USD Million)
- Figure 21.33 CAR-T Cell Therapy Marketfor GC012F (Dual CAR-BCMA-19): Sales Forecast, till 2035 (USD Million)
- Figure 21.34 CAR-T Cell Therapy Marketfor CD19/CD20-CART: Sales Forecast, till 2035 (USD Million)
- Figure 21.35 CAR-T Cell Therapy Marketfor CD7 CAR-T: Sales Forecast, till 2035 (USD Million)
- Figure 21.36 CAR-T Cell Therapy Marketfor Anti-FLT3 CAR-T /TAA05: Sales Forecast, till 2035 (USD Million)
- Figure 21.37 CAR-T Cell Therapy Marketfor Anti-ALPP CAR-T Cells: Sales Forecast, till 2035 (USD Million)
- Figure 21.38 CAR-T Cell Therapy Marketfor WU CART 007: Sales Forecast, till 2035 (USD Million)
- Figure 21.39 CAR-T Cell Therapy Marketfor CTX110: Sales Forecast, till 2035 (USD Million)
- Figure 21.40 CAR-T Cell Therapy Marketfor TX200-TR101: Sales Forecast, till 2035 (USD Million)
- Figure 21.41 CAR-T Cell Therapy Marketfor ALETA-001: Sales Forecast, till 2035 (USD Million)
- Figure 21.42 CAR-T Cell Therapy Marketfor PBCAR0191: Sales Forecast, till 2035 (USD Million)
- Figure 22.1. CAR-T Cell Therapies Market: Distribution by Key Players
- Figure 22.2. CAR-T Cell Therapies Market: Bristol Myers Squibb Sales Forecast, till 2035 (USD Million)
- Figure 22.3. CAR-T Cell Therapies Market: Janssen Sales Forecast, till 2035 (USD Million)
- Figure 22.4. CAR-T Cell Therapies Market: Gilead Sciences Sales Forecast, till 2035 (USD Million)
- Figure 22.5. CAR-T Cell Therapies Market: JW Therapeutics Sales Forecast, till 2035 (USD Million)
- Figure 22.6. CAR-T Cell Therapies Market: Novartis Sales Forecast, till 2035 (USD Million)
- Figure 23.1 Channels Used for Promotional Campaigns
- Figure 23.2 Promotional / Marketing Strategy: Product Website Analysis
- Figure 23.3 Product Website Analysis:Kymriah, Messages for Healthcare Professionals
- Figure 23.4 Product Website Analysis:Kymriah, Messages for Patients
- Figure 23.5 Product Website Analysis:Kymriah, Patient Support Program
- Figure 23.6 Product Website Analysis:Yescarta, Messages for Healthcare Professionals
- Figure 23.7 Product Website Analysis:Yescarta, Messages for Patients
- Figure 23.8 Product Website Analysis:Yescarta, Kite Konnect
- Figure 23.9 Product Website Analysis:Yescarta, Platform for Referral Patient Treatment and Connecting with Treatment Center
- Figure 23.10 Product Website Analysis:Tecartus, Messages for Healthcare Professionals
- Figure 23.11 Product Website Analysis:Tecartus, Messages for Patients
- Figure 23.12 Product Website Analysis:Tecartus, Kite Konnect
- Figure 23.13 Product Website Analysis:Breyanzi, Messages for Healthcare Professional
- Figure 23.14 Product Website Analysis:Breyanzi, Messages for Patients
- Figure 23.15 Product Website Analysis:Breyanzi, Cell Therapy 360
- Figure 23.16 Product Website Analysis:Abecma, Messages for Healthcare Professional
- Figure 23.17 Product Website Analysis:Abecma, Messages for Patients
- Figure 23.18 Product Website Analysis:Abecma, Cell Therapy 360
- Figure 23.19 Product Website Analysis:Carvykti, Messages for Healthcare Professional
- Figure 23.20 Product Website Analysis:Carvykti,Messages for Patients
- Figure 23.21 Product Website Analysis:Carvykti,MyCARVYKTI
- Figure 24.1 Concluding Remarks: Market Landscape
- Figure 25.2 Concluding Remarks: Clinical Trial Analysis
- Figure 25.3 Concluding Remarks: Funding and Investment Analysis
- Figure 25.4 Concluding Remarks: Patent Analysis
- Figure 25.5 Concluding Remarks: Market Sizing and Opportunity Analysis
 CAR-T细胞疗法市场报告:趋势、预测和竞争分析(至2035年)
 CAR T 细胞疗法市场:2026-2032 年全球市场预测(按适应症、细胞来源、代数、治疗线、标靶抗原和最终用户划分)。
 全球CAR-T细胞疗法市场:按产品、标靶、适应症、人口统计特征、最终用户和地区划分-预测至2031年
 CAR-T细胞疗法市场分析及预测(至2035年):依类型、产品类型、服务、技术、应用、最终使用者、流程、阶段、解决方案划分
 CAR-T细胞疗法市场规模、份额和趋势分析报告:按产品、疾病、应用、地区和细分市场预测(2026-2033年)汽车爬行器市场按产品类型、框架材质、操作模式、分销管道、应用和最终用户划分-2026-2032年全球预测
 CAR-T细胞疗法市场规模、份额和成长分析(按产品类型、标靶、适应症、治疗方法、人口统计、给药方式和地区划分)—2026-2033年产业预测
 CAR-T细胞疗法市场-全球产业规模、份额、趋势、机会和预测,按产品类型、肿瘤类型、适应症、治疗类型、标靶抗原、最终用户、地区和竞争格局划分,2020-2030年预测CAR-T细胞疗法市场:依产品类型、标靶抗原、适应症、最终用户、国家及地区划分-全球产业分析、市场规模、市场占有率及2025-2032年预测
 CAR-T 细胞疗法全球市场 - 市场规模、预测、试验、趋势(2025 年)