


 |
市场调查报告书
商品编码
1857188
石墨烯市场:产业趋势及全球预测(至 2035 年)-依产品类型、生产方法、形态、品质、应用、分销管道、最终用户和地区划分Graphene Market, Till 2035: Distribution by Type of Product, Type of Production Method, Type of Form, Type of Quality, Type of Application, Type of Distribution Channel, Type of End-User and Geographical Regions: Industry Trends and Global Forecasts |
||||||
石墨烯市场概述
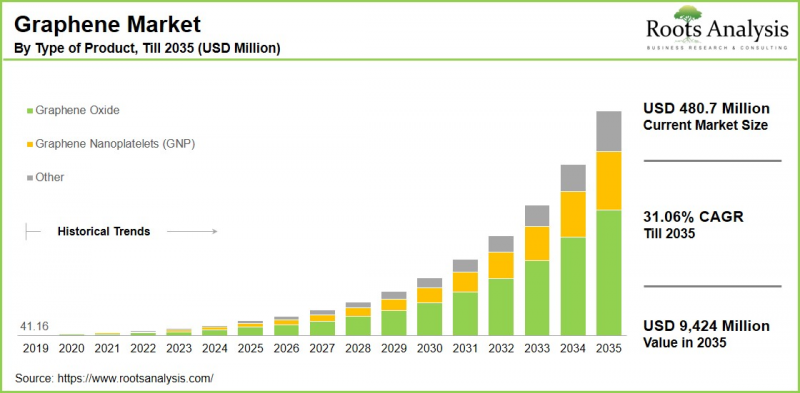
预计到 2035 年,全球石墨烯市场规模将从目前的 4.807 亿美元增长至 94.24 亿美元,预测期内复合年增长率 (CAGR) 为 31.06%。
石墨烯市场机会可区隔为以下几个部分:
产品类型
- 氧化石墨烯
- 石墨烯奈米片(石墨烯奈米片)
- 其他
产品类型
- 化学气相沉积
- 剥离法
- 氧化石墨烯还原法
- 其他
形状
- 分散体
- 薄膜
- 粉末
- 其他
品质等级
- 工业级
- 研究级
- 其他
应用
- 催化剂
- 复合材料
- 电子产品
- 储能
- 油漆和涂料
- 轮胎
分销通路
- 直接销售销售
- 经销商
- 线上零售商
- 其他
最终使用者
- 航空航太与国防
- 汽车
- 电子
- 能源
- 其他
地区
- 北美
- 美国
- 加拿大
- 墨西哥
- 其他北美国家
- 欧洲
- 奥地利
- 比利时
- 丹麦
- 法国
- 德国
- 爱尔兰
- 义大利
- 荷兰
- 挪威
- 俄罗斯
- 西班牙
- 瑞典
- 瑞士
- 英国
- 其他欧洲国家国家/地区
- 亚洲
- 中国
- 印度
- 日本
- 新加坡
- 韩国
- 其他亚洲国家
- 拉丁美洲
- 巴西
- 智利
- 哥伦比亚
- 委内瑞拉
- 其他拉丁美洲国家
- 中东和北非
- 埃及
- 伊朗
- 伊拉克
- 以色列
- 科威特
- 沙乌地阿拉伯
- 阿拉伯联合大公国
- 其他中东和北非国家
- 世界其他地区
- 澳大利亚
- 纽西兰
- 其他国家/地区
石墨烯市场成长与趋势
石墨烯在各行各业的技术进步中发挥关键作用,包括积体电路的开发。其轻质结构和高效率带来了显着优势。石墨烯具有独特的性能,包括卓越的导电性、透明性、柔韧性、轻盈性和优异的耐受性,使其成为一种用途极为广泛的材料。石墨烯源自石墨,由单层碳原子构成,厚度仅为一个原子层,是目前已知最薄的材料。这些特性使其应用范围涵盖生物技术、医疗保健、建筑以及石墨烯电子装置等领域。
值得注意的是,石墨烯的强度约为钢的200倍,其导电导热性能也优于铜。各种形式的石墨烯,包括单层石墨烯、双层石墨烯和紊层石墨烯,都因其独特的性能和特殊应用而备受重视。
由于持续的创新和技术突破,石墨烯市场正在快速发展。此外,氢气储存和石墨烯温度感测器等领域的进步也推动了市场成长。因此,预计在预测期内,石墨烯市场将因上述因素而显着增长。
石墨烯市场主要区隔领域
依产品类型划分的市占率
全球石墨烯市场依产品类型可分为氧化石墨烯、石墨烯奈米片 (GNP) 和其他类型。据估计,氧化石墨烯目前占了大部分市场占有率。这主要归功于包括石墨烯电子市场和汽车产业在内的各个领域的强劲需求。此外,大规模生产的潜力预计将进一步推动氧化石墨烯市场的发展。
依产品类型划分的市占率
依生产方法划分,全球石墨烯市场可分为化学气相沉积法、剥离法、氧化石墨烯还原法及其他方法。据估计,化学气相沉积法目前占了大部分市场占有率,因为它能够在大面积上生产高品质的石墨烯。此外,在各个行业(尤其是电子行业)的不断扩展的应用预计将推动长期成长。
依形态划分的市占率
依形态划分,全球石墨烯市场可分为分散体、薄膜、粉末和其他形态。据估计,粉末目前占大部分市场占有率。这主要归功于其独特的性能、优异的品质以及与包括医疗保健和汽车在内的各个行业的兼容性。
依品质类型划分的市占率
依品质类型划分,全球石墨烯市场可分为工业级、研究级和其他等级。据估计,由于石墨烯在多个行业和应用中的广泛使用,工业级石墨烯目前占大部分市场占有率。同时,研究级石墨烯市场预计在预测期内将以更高的复合年增长率成长。
依应用划分的市占率
依应用类型划分,全球石墨烯市场可分为催化剂、复合材料、电子产品、储能、涂料和轮胎。据估计,由于对电子解决方案的需求不断增长,电子产品目前占了大部分市场占有率。同时,由于石墨烯电池市场的扩张,储能领域预计在预测期内将以更高的复合年增长率成长。
依分销通路划分的市占率
全球石墨烯市场依分销通路类型分为直销、分销商、线上零售商和其他通路。据估计,直销目前占了大部分市场占有率。这一成长主要受成本效益、直接客户互动以及电子商务兴起等因素所驱动。
依最终用户划分的市占率
全球石墨烯市场依最终用户类型分为:航空航太与国防、汽车、电子、能源等。据估计,汽车行业目前占了大部分市场占有率。这主要是由于石墨烯在汽车应用(例如结构部件、石墨烯电池和轮胎)中的使用不断增加。
同时,由于石墨烯优异的导电性、消费者意识的不断提高以及研发投入的增加,预计电子产业在预测期内将保持较高的复合年增长率。
依地区划分的市占率
石墨烯市场依地区划分为北美、欧洲、亚洲、拉丁美洲、中东和非洲等地区。据估计,亚洲目前占了大部分市场占有率。这主要归功于该地区不断提高的工业化水平、中国和印度等国家强劲的汽车需求以及快速的经济成长,这些因素共同推动了该地区的市场发展。
石墨烯市场参与者
- ACS Material
- Applied Graphene Materials
- BGT Materials
- CVD Equipment
- Directa Plus
- G6 Materials
- Grafoid
- Graphene NanoChem
- Graphenea
- Haydale Graphene Industries
- JCNANO Tech
- Morsh
- NanoXplore
- NeoGraf
- 宁波莫尔思科技有限公司
- Talga
- Thomas Swan
- Vorbeck Materials
- XG Sciences
- 厦门科纳石墨烯科技有限公司
石墨烯市场研究报告涵盖以下内容:
- 市场规模和机会分析:对石墨烯市场进行详区隔析,重点关注关键市场区隔,包括:A) 产品类型,B) 製造方法类型,C) 形貌类型,D) 品质类型,E) 应用类型,F) 分销渠道类型,G) 终端用户类型,以及 H) 地区。 竞争格局:基于相关参数对石墨烯市场中的企业进行全面分析,包括:A) 成立年份,B) 公司规模,C) 总部所在地,以及 D) 所有权结构。 公司简介:详细介绍石墨烯市场中主要企业的概况,包括:A) 总部所在地,B) 公司规模,C) 公司使命,D) 公司业务范围,E) 管理团队,F) 联繫方式,G) 财务信息,H) 业务板块,I) 石墨烯产品组合,J) 护城河分析,以及 K) 近期发展和未来展望。 SWOT 分析:深入的 SWOT 分析框架突显了该领域的优势、劣势、机会和威胁。此外也提供哈维鲍尔分析,重点阐述每个 SWOT 参数的相对影响。
- 价值链分析:我们提供全面的价值链分析,提供有关石墨烯市场各个阶段和利害关係人的资讯。
目录
第一章:引言
第二章:研究方法
第三章:经济及其他项目相关考量
第四章:宏观经济指标
第五章:摘要整理
第六章:引言
- 章节概要
- 石墨烯市场概览
- 产品类型
- 应用
- 最终用户
- 未来展望
第七章:竞争格局
- 章节概要
- 石墨烯:市场景观
第八章:公司简介
- 章节概要
- ACS Material
- Applied Graphene Materials
- BGT Materials
- CVD Equipment
- Directa Plus
- G6 Materials
- Grafoid
- Graphene NanoChem
- Graphenea
- Haydale Graphene Industries
- JCNANO Tech
- Morsh
- NanoXplore
- NeoGraf
- Ningbo Morsh Technology
- Talga
- Thomas Swan
- Vorbeck Materials
- XG Sciences
- Xiamen Knano Graphene Technology
第 9 章价值链分析
第10章 SWOT分析
第11章全球石墨烯市场
- 章节概述
- 关键假设与研究方法
- 影响市场的颠覆性趋势
- 全球石墨烯市场:历史趋势(2019 年至今)与预测(至 2035 年)
- 多元情境分析
- 主要市场区隔
第 12 章:依产品类型划分的市场机会
第 13 章:依生产方法划分的市场机会
第 14 章:依形状划分的市场机会
第 15 章:依品质类型划分的市场机会
第 16 章:依应用划分的市场机会
第 17 章:依通路划分的市场机会
通路第18章:依终端使用者类型划分的市场机会
第19章:北美石墨烯市场机会
第20章:欧洲石墨烯市场机会
第21章:亚洲石墨烯市场机会
第22章:中东和北非(MENA)石墨烯市场机会
第23章:拉丁美洲石墨烯市场机会
第24章:其他地区的石墨烯市场机会
第25章:表格资料
第26章:公司列表和
组织机构第 27 章:客製化机会
第 28 章:ROOT 订阅服务
第 29 章:作者资讯
Graphene Market Overview
As per Roots Analysis, the global graphene market size is estimated to grow from USD 480.7 million in the current year to USD 9,424 million by 2035, at a CAGR of 31.06% during the forecast period, till 2035.

The opportunity for graphene market has been distributed across the following segments:
Type of Product
- Graphene Oxide
- Graphene Nanoplatelets (GNP)
- Others
Type of Production Method
- Chemical Vapor Deposition
- Exfoliation
- Reduction of Graphene Oxide
- Others
Type of Form
- Dispersion
- Film
- Powder
- Others
Type of Quality
- Industrial Grade
- Research Grade
- Others
Type of Application
- Catalyst
- Composites
- Electronic Component
- Energy Storage
- Paint & Coating
- Tires
Type of Distribution Channel
- Direct Sales
- Distributors
- Online Retailers
- Others
Type of End-User
- Aerospace & Defense
- Automotive
- Electronics
- Energy
- Others
Geographical Regions
- North America
- US
- Canada
- Mexico
- Other North American countries
- Europe
- Austria
- Belgium
- Denmark
- France
- Germany
- Ireland
- Italy
- Netherlands
- Norway
- Russia
- Spain
- Sweden
- Switzerland
- UK
- Other European countries
- Asia
- China
- India
- Japan
- Singapore
- South Korea
- Other Asian countries
- Latin America
- Brazil
- Chile
- Colombia
- Venezuela
- Other Latin American countries
- Middle East and North Africa
- Egypt
- Iran
- Iraq
- Israel
- Kuwait
- Saudi Arabia
- UAE
- Other MENA countries
- Rest of the World
- Australia
- New Zealand
- Other countries
Graphene Market: Growth and Trends
Graphene plays a pivotal role in advancing technology across multiple industries, including the development of integrated circuits, where its lightweight structure and high efficiency offer significant benefits. Its unique properties, such as exceptional electrical conductivity, transparency, flexibility, lightness, and outstanding resistance, make it a highly versatile material. Derived from graphite, graphene is composed of a single layer of carbon atoms, making it the thinnest known material at just one atom thick. These characteristics enable its wide application in fields ranging from biological engineering and healthcare to construction and graphene-based electronics.
Remarkably, graphene is about 200 times stronger than steel and conducts electricity and heat more effectively than copper. Different forms of graphene, including monolayer sheets, bilayer graphene, and turbostratic graphene, are valued for their distinct properties and specialized applications.
The graphene market is evolving rapidly, fueled by ongoing innovation and technological breakthroughs. Additionally, advancements in areas such as hydrogen storage and the development of graphene-based temperature sensors is contributing to the its growth. As a result, owing to the above mentioned factors, the graphene market is expected to grow significantly during the forecast period.
Graphene Market: Key Segments
Market Share by Type of Product
Based on type of product, the global graphene market is segmented into graphene oxide, graphene nanoplatelets (GNP) and others. According to our estimates, currently, the graphene oxide segment captures the majority of the market share. This can be attributed to significant demand from various sectors, such as the graphene electronics market and the automotive industry. Additionally, the potential for large-scale production is expected to further advance the graphene oxide market.
Market Share by Type of Production Method
Based on type of production method, the global graphene market is segmented into chemical vapor deposition, exfoliation, reduction of graphene oxide and others. According to our estimates, currently, the chemical vapor deposition segment captures the majority of the market share, due to its capability to manufacture large-area, high-quality graphene. Additionally, increasing applications across various industries, particularly in electronics, are anticipated to propel its long-term growth.
Market Share by Type of Form
Based on type of form, the global graphene market is segmented into dispersion, film, powder and others. According to our estimates, currently, the powder segment captures the majority of the market share. This is primarily due to its distinctive characteristics, superior performance, and compatibility with various industries such as healthcare and automotive.
Market Share by Type of Quality
Based on type of quality, the global graphene market is segmented into industrial grade, research grade and others. According to our estimates, currently, the industrial grade segment captures the majority of the market share. This is due to the widespread use of graphene across multiple industries and applications. Meanwhile, the research grade segment is expected to experience a higher compound annual growth rate (CAGR) during this forecast period.
Market Share by Type of Application
Based on type of application, the global graphene market is segmented into catalyst, composites, electronic component, energy storage, paint & coating and tires. According to our estimates, currently, the electronic component captures the majority of the market share, owing to the growing demand for electronic solutions. Meanwhile, the energy storage segment is expected to experience a higher compound annual growth rate (CAGR) during this forecast period, due to the rising market for graphene batteries.
Market Share by Type of Distribution Channel
Based on type of distribution channel, the global graphene market is segmented into direct sales, distributors, online retailers and others. According to our estimates, currently, the direct sales segment captures the majority of the market share. This growth can be linked to factors such as cost efficiency, direct engagement with customers, and the rise of e-commerce.
Market Share by Type of End-User
Based on type of end-user, the global graphene market is segmented into aerospace & defense, automotive, electronics, energy and others. According to our estimates, currently, the automotive segment captures the majority of the market share. This is primarily due to the growing use of graphene in automotive applications such as structural components, graphene batteries, and tires.
On the other hand, the electronics sector is anticipated to experience a relatively higher CAGR during the forecast period, owing to its outstanding conductivity, heightened consumer awareness, and an increase in research and development funding.
Market Share by Geographical Regions
Based on geographical regions, the graphene market is segmented into North America, Europe, Asia, Latin America, Middle East and North Africa, and the rest of the world. According to our estimates, currently, Asia captures the majority share of the market, driven by increasing industrialization, robust automotive demand in countries like China and India, and rapid economic growth boosting the region's market.
Example Players in Graphene Market
- ACS Material
- Applied Graphene Materials
- BGT Materials
- CVD Equipment
- Directa Plus
- G6 Materials
- Grafoid
- Graphene NanoChem
- Graphenea
- Haydale Graphene Industries
- JCNANO Tech
- Morsh
- NanoXplore
- NeoGraf
- Ningbo Morsh Technology
- Talga
- Thomas Swan
- Vorbeck Materials
- XG Sciences
- Xiamen Knano Graphene Technology
Graphene Market: Research Coverage
The report on the graphene market features insights on various sections, including:
- Market Sizing and Opportunity Analysis: An in-depth analysis of the graphene market, focusing on key market segments, including [A] type of product, [B] type of production method, [C] type of form, [D] type of quality, [E] type of application, [F] type of distribution channel, [G] type of end-user and [H] geographical regions.
- Competitive Landscape: A comprehensive analysis of the companies engaged in the graphene market, based on several relevant parameters, such as [A] year of establishment, [B] company size, [C] location of headquarters and [D] ownership structure.
- Company Profiles: Elaborate profiles of prominent players engaged in the graphene market, providing details on [A] location of headquarters, [B] company size, [C] company mission, [D] company footprint, [E] management team, [F] contact details, [G] financial information, [H] operating business segments, [I] graphene portfolio, [J] moat analysis, [K] recent developments, and an informed future outlook.
- SWOT Analysis: An insightful SWOT framework, highlighting the strengths, weaknesses, opportunities and threats in the domain. Additionally, it provides Harvey ball analysis, highlighting the relative impact of each SWOT parameter.
- Value Chain Analysis: A comprehensive analysis of the value chain, providing information on the different phases and stakeholders involved in the graphene market.
Key Questions Answered in this Report
- How many companies are currently engaged in graphene market?
- Which are the leading companies in this market?
- What factors are likely to influence the evolution of this market?
- What is the current and future market size?
- What is the CAGR of this market?
- How is the current and future market opportunity likely to be distributed across key market segments?
Reasons to Buy this Report
- The report provides a comprehensive market analysis, offering detailed revenue projections of the overall market and its specific sub-segments. This information is valuable to both established market leaders and emerging entrants.
- Stakeholders can leverage the report to gain a deeper understanding of the competitive dynamics within the market. By analyzing the competitive landscape, businesses can make informed decisions to optimize their market positioning and develop effective go-to-market strategies.
- The report offers stakeholders a comprehensive overview of the market, including key drivers, barriers, opportunities, and challenges. This information empowers stakeholders to stay abreast of market trends and make data-driven decisions to capitalize on growth prospects.
Additional Benefits
- Complimentary Excel Data Packs for all Analytical Modules in the Report
- 15% Free Content Customization
- Detailed Report Walkthrough Session with Research Team
- Free Updated report if the report is 6-12 months old or older
TABLE OF CONTENTS
1. PREFACE
- 1.1. Introduction
- 1.2. Market Share Insights
- 1.3. Key Market Insights
- 1.4. Report Coverage
- 1.5. Key Questions Answered
- 1.6. Chapter Outlines
2. RESEARCH METHODOLOGY
- 2.1. Chapter Overview
- 2.2. Research Assumptions
- 2.3. Database Building
- 2.3.1. Data Collection
- 2.3.2. Data Validation
- 2.3.3. Data Analysis
- 2.4. Project Methodology
- 2.4.1. Secondary Research
- 2.4.1.1. Annual Reports
- 2.4.1.2. Academic Research Papers
- 2.4.1.3. Company Websites
- 2.4.1.4. Investor Presentations
- 2.4.1.5. Regulatory Filings
- 2.4.1.6. White Papers
- 2.4.1.7. Industry Publications
- 2.4.1.8. Conferences and Seminars
- 2.4.1.9. Government Portals
- 2.4.1.10. Media and Press Releases
- 2.4.1.11. Newsletters
- 2.4.1.12. Industry Databases
- 2.4.1.13. Roots Proprietary Databases
- 2.4.1.14. Paid Databases and Sources
- 2.4.1.15. Social Media Portals
- 2.4.1.16. Other Secondary Sources
- 2.4.2. Primary Research
- 2.4.2.1. Introduction
- 2.4.2.2. Types
- 2.4.2.2.1. Qualitative
- 2.4.2.2.2. Quantitative
- 2.4.2.3. Advantages
- 2.4.2.4. Techniques
- 2.4.2.4.1. Interviews
- 2.4.2.4.2. Surveys
- 2.4.2.4.3. Focus Groups
- 2.4.2.4.4. Observational Research
- 2.4.2.4.5. Social Media Interactions
- 2.4.2.5. Stakeholders
- 2.4.2.5.1. Company Executives (CXOs)
- 2.4.2.5.2. Board of Directors
- 2.4.2.5.3. Company Presidents and Vice Presidents
- 2.4.2.5.4. Key Opinion Leaders
- 2.4.2.5.5. Research and Development Heads
- 2.4.2.5.6. Technical Experts
- 2.4.2.5.7. Subject Matter Experts
- 2.4.2.5.8. Scientists
- 2.4.2.5.9. Doctors and Other Healthcare Providers
- 2.4.2.6. Ethics and Integrity
- 2.4.2.6.1. Research Ethics
- 2.4.2.6.2. Data Integrity
- 2.4.3. Analytical Tools and Databases
- 2.4.1. Secondary Research
3. ECONOMIC AND OTHER PROJECT SPECIFIC CONSIDERATIONS
- 3.1. Forecast Methodology
- 3.1.1. Top-Down Approach
- 3.1.2. Bottom-Up Approach
- 3.1.3. Hybrid Approach
- 3.2. Market Assessment Framework
- 3.2.1. Total Addressable Market (TAM)
- 3.2.2. Serviceable Addressable Market (SAM)
- 3.2.3. Serviceable Obtainable Market (SOM)
- 3.2.4. Currently Acquired Market (CAM)
- 3.3. Forecasting Tools and Techniques
- 3.3.1. Qualitative Forecasting
- 3.3.2. Correlation
- 3.3.3. Regression
- 3.3.4. Time Series Analysis
- 3.3.5. Extrapolation
- 3.3.6. Convergence
- 3.3.7. Forecast Error Analysis
- 3.3.8. Data Visualization
- 3.3.9. Scenario Planning
- 3.3.10. Sensitivity Analysis
- 3.4. Key Considerations
- 3.4.1. Demographics
- 3.4.2. Market Access
- 3.4.3. Reimbursement Scenarios
- 3.4.4. Industry Consolidation
- 3.5. Robust Quality Control
- 3.6. Key Market Segmentations
- 3.7. Limitations
4. MACRO-ECONOMIC INDICATORS
- 4.1. Chapter Overview
- 4.2. Market Dynamics
- 4.2.1. Time Period
- 4.2.1.1. Historical Trends
- 4.2.1.2. Current and Forecasted Estimates
- 4.2.2. Currency Coverage
- 4.2.2.1. Overview of Major Currencies Affecting the Market
- 4.2.2.2. Impact of Currency Fluctuations on the Industry
- 4.2.3. Foreign Exchange Impact
- 4.2.3.1. Evaluation of Foreign Exchange Rates and Their Impact on Market
- 4.2.3.2. Strategies for Mitigating Foreign Exchange Risk
- 4.2.4. Recession
- 4.2.4.1. Historical Analysis of Past Recessions and Lessons Learnt
- 4.2.4.2. Assessment of Current Economic Conditions and Potential Impact on the Market
- 4.2.5. Inflation
- 4.2.5.1. Measurement and Analysis of Inflationary Pressures in the Economy
- 4.2.5.2. Potential Impact of Inflation on the Market Evolution
- 4.2.6. Interest Rates
- 4.2.6.1. Overview of Interest Rates and Their Impact on the Market
- 4.2.6.2. Strategies for Managing Interest Rate Risk
- 4.2.7. Commodity Flow Analysis
- 4.2.7.1. Type of Commodity
- 4.2.7.2. Origins and Destinations
- 4.2.7.3. Values and Weights
- 4.2.7.4. Modes of Transportation
- 4.2.8. Global Trade Dynamics
- 4.2.8.1. Import Scenario
- 4.2.8.2. Export Scenario
- 4.2.9. War Impact Analysis
- 4.2.9.1. Russian-Ukraine War
- 4.2.9.2. Israel-Hamas War
- 4.2.10. COVID Impact / Related Factors
- 4.2.10.1. Global Economic Impact
- 4.2.10.2. Industry-specific Impact
- 4.2.10.3. Government Response and Stimulus Measures
- 4.2.10.4. Future Outlook and Adaptation Strategies
- 4.2.11. Other Indicators
- 4.2.11.1. Fiscal Policy
- 4.2.11.2. Consumer Spending
- 4.2.11.3. Gross Domestic Product (GDP)
- 4.2.11.4. Employment
- 4.2.11.5. Taxes
- 4.2.11.6. R&D Innovation
- 4.2.11.7. Stock Market Performance
- 4.2.11.8. Supply Chain
- 4.2.11.9. Cross-Border Dynamics
- 4.2.1. Time Period
5. EXECUTIVE SUMMARY
6. INTRODUCTION
- 6.1. Chapter Overview
- 6.2. Overview of Graphene Market
- 6.2.1. Type of Product
- 6.2.2. Type of Applications
- 6.2.3. Type of End-User
- 6.3. Future Perspective
7. COMPETITIVE LANDSCAPE
- 7.1. Chapter Overview
- 7.2. Graphene: Overall Market Landscape
- 7.2.1. Analysis by Year of Establishment
- 7.2.2. Analysis by Company Size
- 7.2.3. Analysis by Location of Headquarters
- 7.2.4. Analysis by Ownership Structure
8. COMPANY PROFILES
- 8.1. Chapter Overview
- 8.2. ACS Material *
- 8.2.1. Company Overview
- 8.2.2. Company Mission
- 8.2.3. Company Footprint
- 8.2.4. Management Team
- 8.2.5. Contact Details
- 8.2.6. Financial Performance
- 8.2.7. Operating Business Segments
- 8.2.8. Service / Product Portfolio (project specific)
- 8.2.9. MOAT Analysis
- 8.2.10. Recent Developments and Future Outlook
- 8.3. Applied Graphene Materials
- 8.4. BGT Materials
- 8.5. CVD Equipment
- 8.6. Directa Plus
- 8.7. G6 Materials
- 8.8. Grafoid
- 8.9. Graphene NanoChem
- 8.10. Graphenea
- 8.11. Haydale Graphene Industries
- 8.12. JCNANO Tech
- 8.13. Morsh
- 8.14. NanoXplore
- 8.15. NeoGraf
- 8.16. Ningbo Morsh Technology
- 8.17. Talga
- 8.18. Thomas Swan
- 8.19. Vorbeck Materials
- 8.20. XG Sciences
- 8.21. Xiamen Knano Graphene Technology
9. VALUE CHAIN ANALYSIS
10. SWOT ANALYSIS
11. GLOBAL GRAPHENE MARKET
- 11.1. Chapter Overview
- 11.2. Key Assumptions and Methodology
- 11.3. Trends Disruption Impacting Market
- 11.4. Global Graphene Market, Historical Trends (Since 2019) and Forecasted Estimates (Till 2035)
- 11.5. Multivariate Scenario Analysis
- 11.5.1. Conservative Scenario
- 11.5.2. Optimistic Scenario
- 11.6. Key Market Segmentations
12. MARKET OPPORTUNITIES BASED ON TYPE OF PRODUCT
- 12.1. Chapter Overview
- 12.2. Key Assumptions and Methodology
- 12.3. Revenue Shift Analysis
- 12.4. Market Movement Analysis
- 12.5. Penetration-Growth (P-G) Matrix
- 12.6. Graphene Market for Graphene Oxide: Historical Trends (Since 2019) and Forecasted Estimates (Till 2035)
- 12.7. Graphene Market for Graphene Nanoplatelets (GNP): Historical Trends (Since 2019) and Forecasted Estimates (Till 2035)
- 12.8. Graphene Market for Others: Historical Trends (Since 2019) and Forecasted Estimates (Till 2035)
- 12.9. Data Triangulation and Validation
13. MARKET OPPORTUNITIES BASED ON TYPE OF PRODUCTION METHOD
- 13.1. Chapter Overview
- 13.2. Key Assumptions and Methodology
- 13.3. Revenue Shift Analysis
- 13.4. Market Movement Analysis
- 13.5. Penetration-Growth (P-G) Matrix
- 13.6. Graphene Market for Chemical Vapor Deposition: Historical Trends (Since 2019) and Forecasted Estimates (Till 2035)
- 13.7. Graphene Market for Exfoliation: Historical Trends (Since 2019) and Forecasted Estimates (Till 2035)
- 13.8. Graphene Market for Reduction of Graphene Oxide: Historical Trends (Since 2019) and Forecasted Estimates (Till 2035)
- 13.9. Graphene Market for Others: Historical Trends (Since 2019) and Forecasted Estimates (Till 2035)
- 13.10. Data Triangulation and Validation
14. MARKET OPPORTUNITIES BASED ON TYPE OF FORM
- 14.1. Chapter Overview
- 14.2. Key Assumptions and Methodology
- 14.3. Revenue Shift Analysis
- 14.4. Market Movement Analysis
- 14.5. Penetration-Growth (P-G) Matrix
- 14.6. Graphene Market for Dispersion: Historical Trends (Since 2019) and Forecasted Estimates (Till 2035)
- 14.7. Graphene Market for Film: Historical Trends (Since 2019) and Forecasted Estimates (Till 2035)
- 14.8. Graphene Market for Powder: Historical Trends (Since 2019) and Forecasted Estimates (Till 2035)
- 14.9. Graphene Market for Others: Historical Trends (Since 2019) and Forecasted Estimates (Till 2035)
- 14.10. Data Triangulation and Validation
15. MARKET OPPORTUNITIES BASED ON TYPE OF QUALITY
- 15.1. Chapter Overview
- 15.2. Key Assumptions and Methodology
- 15.3. Revenue Shift Analysis
- 15.4. Market Movement Analysis
- 15.5. Penetration-Growth (P-G) Matrix
- 15.6. Graphene Market for Industrial Grade: Historical Trends (Since 2019) and Forecasted Estimates (Till 2035)
- 15.7. Graphene Market for Research Grade: Historical Trends (Since 2019) and Forecasted Estimates (Till 2035)
- 15.8. Graphene Market for Others: Historical Trends (Since 2019) and Forecasted Estimates (Till 2035)
- 15.9. Data Triangulation and Validation
16. MARKET OPPORTUNITIES BASED ON TYPE OF APPLICATION
- 16.1. Chapter Overview
- 16.2. Key Assumptions and Methodology
- 16.3. Revenue Shift Analysis
- 16.4. Market Movement Analysis
- 16.5. Penetration-Growth (P-G) Matrix
- 16.6. Graphene Market for Catalyst: Historical Trends (Since 2019) and Forecasted Estimates (Till 2035)
- 16.7. Graphene Market for Composites: Historical Trends (Since 2019) and Forecasted Estimates (Till 2035)
- 16.8. Graphene Market for Electronic Component: Historical Trends (Since 2019) and Forecasted Estimates (Till 2035)
- 16.9. Graphene Market for Energy Storage: Historical Trends (Since 2019) and Forecasted Estimates (Till 2035)
- 16.10. Graphene Market for Paint & Coating: Historical Trends (Since 2019) and Forecasted Estimates (Till 2035)
- 16.11. Graphene Market for Others: Historical Trends (Since 2019) and Forecasted Estimates (Till 2035)
- 16.12. Data Triangulation and Validation
17. MARKET OPPORTUNITIES BASED ON TYPE OF DISTRIBUTION CHANNEL
- 17.1. Chapter Overview
- 17.2. Key Assumptions and Methodology
- 17.3. Revenue Shift Analysis
- 17.4. Market Movement Analysis
- 17.5. Penetration-Growth (P-G) Matrix
- 17.6. Graphene Market for Direct Sales: Historical Trends (Since 2019) and Forecasted Estimates (Till 2035)
- 17.7. Graphene Market for Distributors: Historical Trends (Since 2019) and Forecasted Estimates (Till 2035)
- 17.8. Graphene Market for Online Retailers: Historical Trends (Since 2019) and Forecasted Estimates (Till 2035)
- 17.9. Graphene Market for Others: Historical Trends (Since 2019) and Forecasted Estimates (Till 2035)
- 17.10. Data Triangulation and Validation
18. MARKET OPPORTUNITIES BASED ON TYPE OF END-USER
- 18.1. Chapter Overview
- 18.2. Key Assumptions and Methodology
- 18.3. Revenue Shift Analysis
- 18.4. Market Movement Analysis
- 18.5. Penetration-Growth (P-G) Matrix
- 18.6. Graphene Market for Aerospace & Defense: Historical Trends (Since 2019) and Forecasted Estimates (Till 2035)
- 18.7. Graphene Market for Automotive: Historical Trends (Since 2019) and Forecasted Estimates (Till 2035)
- 18.8. Graphene Market for Electronics: Historical Trends (Since 2019) and Forecasted Estimates (Till 2035)
- 18.9. Graphene Market for Energy: Historical Trends (Since 2019) and Forecasted Estimates (Till 2035)
- 18.10. Graphene Market for Others: Historical Trends (Since 2019) and Forecasted Estimates (Till 2035)
- 18.11. Data Triangulation and Validation
19. MARKET OPPORTUNITIES FOR GRAPHENE IN NORTH AMERICA
- 19.1. Chapter Overview
- 19.2. Key Assumptions and Methodology
- 19.3. Revenue Shift Analysis
- 19.4. Market Movement Analysis
- 19.5. Penetration-Growth (P-G) Matrix
- 19.6. Graphene Market in North America: Historical Trends (Since 2019) and Forecasted Estimates (Till 2035)
- 19.6.1. Graphene Market in the US: Historical Trends (Since 2019) and Forecasted Estimates (Till 2035)
- 19.6.2. Graphene Market in Canada: Historical Trends (Since 2019) and Forecasted Estimates (Till 2035)
- 19.6.3. Graphene Market in Mexico: Historical Trends (Since 2019) and Forecasted Estimates (Till 2035)
- 19.6.4. Graphene Market in Other North American Countries: Historical Trends (Since 2019) and Forecasted Estimates (Till 2035)
- 19.7. Data Triangulation and Validation
20. MARKET OPPORTUNITIES FOR GRAPHENE IN EUROPE
- 20.1. Chapter Overview
- 20.2. Key Assumptions and Methodology
- 20.3. Revenue Shift Analysis
- 20.4. Market Movement Analysis
- 20.5. Penetration-Growth (P-G) Matrix
- 20.6. Graphene Market in Europe: Historical Trends (Since 2019) and Forecasted Estimates (Till 2035)
- 20.6.1. Graphene Market in Austria: Historical Trends (Since 2019) and Forecasted Estimates (Till 2035)
- 20.6.2. Graphene Market in Belgium: Historical Trends (Since 2019) and Forecasted Estimates (Till 2035)
- 20.6.3. Graphene Market in Denmark: Historical Trends (Since 2019) and Forecasted Estimates (Till 2035)
- 20.6.4. Graphene Market in France: Historical Trends (Since 2019) and Forecasted Estimates (Till 2035)
- 20.6.5. Graphene Market in Germany: Historical Trends (Since 2019) and Forecasted Estimates (Till 2035)
- 20.6.6. Graphene Market in Ireland: Historical Trends (Since 2019) and Forecasted Estimates (Till 2035)
- 20.6.7. Graphene Market in Italy: Historical Trends (Since 2019) and Forecasted Estimates (Till 2035)
- 20.6.8. Graphene Market in Netherlands: Historical Trends (Since 2019) and Forecasted Estimates (Till 2035)
- 20.6.9. Graphene Market in Norway: Historical Trends (Since 2019) and Forecasted Estimates (Till 2035)
- 20.6.10. Graphene Market in Russia: Historical Trends (Since 2019) and Forecasted Estimates (Till 2035)
- 20.6.11. Graphene Market in Spain: Historical Trends (Since 2019) and Forecasted Estimates (Till 2035)
- 20.6.12. Graphene Market in Sweden: Historical Trends (Since 2019) and Forecasted Estimates (Till 2035)
- 20.6.13. Graphene Market in Switzerland: Historical Trends (Since 2019) and Forecasted Estimates (Till 2035)
- 20.6.14. Graphene Market in the UK: Historical Trends (Since 2019) and Forecasted Estimates (Till 2035)
- 20.6.15. Graphene Market in Other European Countries: Historical Trends (Since 2019) and Forecasted Estimates (Till 2035)
- 20.7. Data Triangulation and Validation
21. MARKET OPPORTUNITIES FOR GRAPHENE IN ASIA
- 21.1. Chapter Overview
- 21.2. Key Assumptions and Methodology
- 21.3. Revenue Shift Analysis
- 21.4. Market Movement Analysis
- 21.5. Penetration-Growth (P-G) Matrix
- 21.6. Graphene Market in Asia: Historical Trends (Since 2019) and Forecasted Estimates (Till 2035)
- 21.6.1. Graphene Market in China: Historical Trends (Since 2019) and Forecasted Estimates (Till 2035)
- 21.6.2. Graphene Market in India: Historical Trends (Since 2019) and Forecasted Estimates (Till 2035)
- 21.6.3. Graphene Market in Japan: Historical Trends (Since 2019) and Forecasted Estimates (Till 2035)
- 21.6.4. Graphene Market in Singapore: Historical Trends (Since 2019) and Forecasted Estimates (Till 2035)
- 21.6.5. Graphene Market in South Korea: Historical Trends (Since 2019) and Forecasted Estimates (Till 2035)
- 21.6.6. Graphene Market in Other Asian Countries: Historical Trends (Since 2019) and Forecasted Estimates (Till 2035)
- 21.7. Data Triangulation and Validation
22. MARKET OPPORTUNITIES FOR GRAPHENE IN MIDDLE EAST AND NORTH AFRICA (MENA)
- 22.1. Chapter Overview
- 22.2. Key Assumptions and Methodology
- 22.3. Revenue Shift Analysis
- 22.4. Market Movement Analysis
- 22.5. Penetration-Growth (P-G) Matrix
- 22.6. Graphene Market in Middle East and North Africa (MENA): Historical Trends (Since 2019) and Forecasted Estimates (Till 2035)
- 22.6.1. Graphene Market in Egypt: Historical Trends (Since 2019) and Forecasted Estimates (Till 205)
- 22.6.2. Graphene Market in Iran: Historical Trends (Since 2019) and Forecasted Estimates (Till 2035)
- 22.6.3. Graphene Market in Iraq: Historical Trends (Since 2019) and Forecasted Estimates (Till 2035)
- 22.6.4. Graphene Market in Israel: Historical Trends (Since 2019) and Forecasted Estimates (Till 2035)
- 22.6.5. Graphene Market in Kuwait: Historical Trends (Since 2019) and Forecasted Estimates (Till 2035)
- 22.6.6. Graphene Market in Saudi Arabia: Historical Trends (Since 2019) and Forecasted Estimates (Till 2035)
- 22.6.7. Graphene Market in United Arab Emirates (UAE): Historical Trends (Since 2019) and Forecasted Estimates (Till 2035)
- 22.6.8. Graphene Market in Other MENA Countries: Historical Trends (Since 2019) and Forecasted Estimates (Till 2035)
- 22.7. Data Triangulation and Validation
23. MARKET OPPORTUNITIES FOR GRAPHENE IN LATIN AMERICA
- 23.1. Chapter Overview
- 23.2. Key Assumptions and Methodology
- 23.3. Revenue Shift Analysis
- 23.4. Market Movement Analysis
- 23.5. Penetration-Growth (P-G) Matrix
- 23.6. Graphene Market in Latin America: Historical Trends (Since 2019) and Forecasted Estimates (Till 2035)
- 23.6.1. Graphene Market in Argentina: Historical Trends (Since 2019) and Forecasted Estimates (Till 2035)
- 23.6.2. Graphene Market in Brazil: Historical Trends (Since 2019) and Forecasted Estimates (Till 2035)
- 23.6.3. Graphene Market in Chile: Historical Trends (Since 2019) and Forecasted Estimates (Till 2035)
- 23.6.4. Graphene Market in Colombia Historical Trends (Since 2019) and Forecasted Estimates (Till 2035)
- 23.6.5. Graphene Market in Venezuela: Historical Trends (Since 2019) and Forecasted Estimates (Till 2035)
- 23.6.6. Graphene Market in Other Latin American Countries: Historical Trends (Since 2019) and Forecasted Estimates (Till 2035)
- 23.7. Data Triangulation and Validation
24. MARKET OPPORTUNITIES FOR GRAPHENE IN REST OF THE WORLD
- 24.1. Chapter Overview
- 24.2. Key Assumptions and Methodology
- 24.3. Revenue Shift Analysis
- 24.4. Market Movement Analysis
- 24.5. Penetration-Growth (P-G) Matrix
- 24.6. Graphene Market in Rest of the World: Historical Trends (Since 2019) and Forecasted Estimates (Till 2035)
- 24.6.1. Graphene Market in Australia: Historical Trends (Since 2019) and Forecasted Estimates (Till 2035)
- 24.6.2. Graphene Market in New Zealand: Historical Trends (Since 2019) and Forecasted Estimates (Till 2035)
- 24.6.3. Graphene Market in Other Countries
- 24.7. Data Triangulation and Validation
25. TABULATED DATA
26. LIST OF COMPANIES AND ORGANIZATIONS
27. CUSTOMIZATION OPPORTUNITIES
28. ROOTS SUBSCRIPTION SERVICES
29. AUTHOR DETAIL
 石墨烯铜箔市场规模、份额和成长分析:按箔型、应用领域、製造方法、终端用户产业和地区划分-2026-2033年产业预测
 MXene市场:依材料类型、形态、应用和最终用途划分 - 全球预测至2036年
 石墨烯胺化市场规模、份额和成长分析:按产品类型、配方、应用、终端用户产业、分销管道、地区和产业预测划分,2026-2033年
 2026-2034年石墨烯全球市场规模、份额、趋势和成长分析报告
 日本石墨烯市场规模、份额、趋势和预测:按类型、应用、终端用户产业和地区划分,2026-2034年
 全球MXene市场按类型、製造方法、形态、产业和地区划分-预测至2032年
 2026年石墨烯全球市场报告
 近红外线光吸收材料市场:依材料类型、波长范围、产品形式、技术、应用和最终用户划分-2026-2032年全球预测
 石墨烯市场规模、份额和成长分析(按类型、原材料、应用、终端用户产业、通路和地区划分)-2026-2033年产业预测
 全球石墨烯市场按类型、原料、应用、终端用户产业和地区划分-预测至2030年