


 |
市场调查报告书
商品编码
1869576
微生物组製造市场:产业趋势及全球预测(至 2035 年)-依产品类型、配方、初级包装类型、企业规模、公司规模及主要地区划分Microbiome Manufacturing Market: Industry Trends and Global Forecasts, Till 2035 - Distribution by Product Manufactured, Formulation, Primary Packaging Used, Scale of Operation, Company Size, Key Geographical Regions and Leading Developers |
||||||
微生物组製造市场:概论
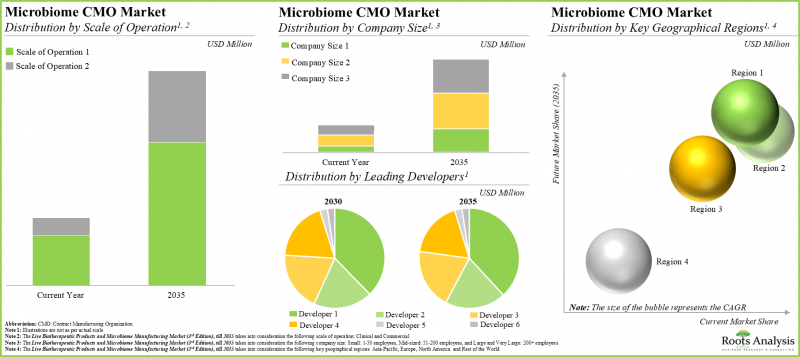
根据 Roots Analysis 的研究,全球微生物组製造市场预计将从目前的 4,060 万美元增长到 2035 年的 1.867 亿美元,预测期内(截至 2035 年)的复合年增长率 (CAGR) 为 14.9%。
市场规模和机会分析基于以下参数进行分类:
生产的产品类型
- 原料药 (API)
- 成品製剂 (FDF)
配方类型
- 固体製剂
- 液体製剂
- 其他製剂
初级包装类型已使用
- 泡罩包装
- 玻璃/塑胶瓶
- 袋装/小袋
- 小瓶
企业规模
- 临床
- 商业
公司规模
- 小型
- 中型
- 大型和超大型企业
主要地区
- 北美
- 欧洲
- 亚太地区
- 世界其他地区
微生物组製造市场:成长与趋势
人体内寄生着大量的微生物群落,包括有益菌和有害菌,统称为 "微生物群" 。同样,共生微生物、益生菌和致病微生物组成的宿主系统被称为 "微生物组" 。鑑于微生物组对疾病发展和发病机制的影响,以微生物组为标靶的治疗方法正日益受到医学研究界的关注。
基于微生物组的疗法为多种疾病提供了有效且替代的治疗选择,包括肥胖症、糖尿病、免疫系统疾病以及消化系统或胃肠道疾病。以微生物组为基础的生物治疗产品(LBPs)是含有活微生物(例如细菌和酵母)的製剂,旨在透过恢復、调节或增强肠道微生物组来治疗或预防疾病。值得注意的是,目前全球正在进行超过165项临床试验,探索各种微生物组治疗产品。这一趋势表明,各利益相关者正在推动该领域的大规模研发工作。
然而,以微生物组为基础的疗法生产面临许多复杂挑战,包括研发週期长、严格的温度控制要求、对多种需氧和厌氧菌株(取决于微生物类型)进行复杂的工程改造,以及最终产品品质属性的异质性。产能不足也是肠道微生物组菌株研发公司面临的一大难题。过去几年,一些公司透过建立内部生产能力来规避了这项挑战。然而,部分公司在投资建造新的内部生产设施之前,仍需要概念验证数据。这些公司目前将活体微生物组疗法的生产外包给合约生产商(CMO)。这为少数在该领域拥有多元化能力的合约生产商创造了巨大的机会。随着优化微生物组产品生产的努力不断推进,预计未来十年CMO市场将保持稳定成长。
微生物组製造市场:关键洞察
本报告深入分析了微生物组製造市场的现状,并指出了该行业的潜在成长机会。主要发现包括:
- 在目前的市场格局中,超过20家成熟企业和新进业者以合约方式从事生物治疗产品的生产。
- 利害关係人声称提供涵盖各种规模运作的广泛服务。相当大比例的成品药以固体和液体形式生产。
- 在美国拥有内部生产设施的公司中,大多数(50%)是中型企业,主要具备临床前/临床规模的生产能力。
- 过去十年,我们观察到微生物组製造市场发生了转变,越来越多的公司在欧洲建立了生产设施。
- 为了获得竞争优势,产业利害关係人正积极加强现有能力并扩展其微生物组专属服务组合。
- 为了满足不断增长的需求,许多合约製造商正积极进行策略合作,建立互惠互利的合作伙伴关係并扩大产能。
- 目前,全球各地有超过165项正在进行的临床试验(约22,000名患者)正在研究以微生物组为基础的疗法。
- 预计微生物组合同製造商将继续与开发微生物组疗法的公司建立策略合作伙伴关係,并为其生产产品。
- 全球合约生产能力分布于各个地区,但值得注意的是,约 43% 的总产能位于小型业者拥有的工厂中。
- 随着研发管线的快速扩展和对有效治疗干预措施需求的不断增长,微生物组药物开发商更倾向于利用合约製造商的专业知识来确保最终产品的高品质。
- 随着越来越多的开发商将药物生产营运的各个环节外包,预计未来十年微生物组药物合约生产市场将以超过 14.9% 的年增长率成长。
微生物组生产市场:主要区隔市场
原料药目前占微生物组生产市场的最大占有率。
依产品类型划分,市场分为原料药 (API) 和成品药 (FDF)。目前,原料药 (API) 占微生物组生产市场的最大占有率。这一趋势在短期内不太可能改变。
依剂型划分,市场分为固体剂型、液体剂型及其他剂型。目前,液体剂型占微生物组生产市场的最大占有率。预计这一趋势将在未来几年内持续。
依主要包装类型划分,市场分为泡罩包装、玻璃/塑胶瓶、袋装/小袋和西林瓶。值得注意的是,袋装/小袋目前占微生物组生产市场更大的占有率。预计未来十年这一趋势将保持不变。
依营运规模划分,市场分为临床规模与商业规模。虽然商业规模生产将是整体市场的主要推动力,但值得注意的是,临床规模的微生物组生产市场也可能以相对较高的复合年增长率成长。
依公司规模划分,市场分为小型、中型、大型及超大型公司。目前,小型公司在微生物组生产市场中创造了最大的收入。这一趋势在短期内不太可能改变。
依主要地区划分,市场分为北美、欧洲、亚太地区及世界其他地区。欧洲目前占微生物组生产市场的大部分占有率。值得注意的是,预计未来几年世界其他地区的市场将以更高的复合年增长率成长。
微生物组製造市场代表性公司
- Biose
- BJP Laboratories
- Capsugel
- Chr. Hansen
- Infant Bacterial Therapeutics
- Inpac Probiotics
- MaaT Pharma
- Microbiomik Healthcare
- NIZO
- OxThera
- Rebiotix
- Seres Therapeutics
- WACKER
- Winclove
目录
第一章:引言
第一章:生物製药和微生物组製造市场概述
第二章:研究方法
第三章:经济和其他项目特定考虑
第四章:摘要整理
第五章:导论
- 章节概述
- 人类微生物群和微生物组概念
- 肠道菌丛概述
- 人类微生物组计画 (HMP)
- 微生物组疗法概述
- 以微生物组为基础的产品生产
- 选择合适的合约生产组织 (CMO) 合作伙伴的关键考虑因素
第六章:市场概况
- 章节概述
- 生物製药和微生物组的合约生产商:市场概况
- 生物製药和微生物组的内部生产者:市场概况
第七章:区域能力分析
第八章:竞争分析
第九章:公司概况个人资料
- 章节概述
- 北美生物製药和微生物组合同製造商
- 胶囊凝胶
- 其他公司
- Arranta Bio
- FUJIFILM Diosynth Biotechnologies
- List Biological Laboratories
- ProbioFerm
- 欧洲生物製药和微生物组合同製造商
- Biose Industrie
- Cerbios-Pharma
- Chr. Hansen
- Inpac Probiotics
- NIZO
- WACKER
- Winclove Probiotics
- 其他公司
- BacThera
- Evologic Technologies
- Probiotical
- QUAY Pharma
- 亚太地区生物製药和微生物组合约製造商
- BJP Laboratories
- 其他公司
- Aumgene Biosciences
- AcuraBio
- Meteoric Biopharmaceuticals
- Probiotics Australia
- Unique Biotech
第十章:潜在伙伴分析
第十一章:主要药厂的措施
第十二章:近期趋势与举措
第十三章:临床试验分析
第十四章:产能分析
第十五章:需求分析
第十六章:自製或外购决策架构
第十七章:案例研究:活体生物製药和微生物组合同研究组织 (CRO) 以及营养保健品製造商
第十八章:市场影响分析:推动因素、阻碍因素、机会与挑战
- 章节概述
- 市场推动因素
- 市场阻碍因素
- 市场机遇
- 市场挑战
- 结论
第十九章:活体生物製药与微生物组合同生产市场
第20章:活体生物製药和微生物组合同生产市场(依产品类型划分)
第21章:生物製药和微生物组合同生产市场(依製剂类型划分)
第22章:生物製药与微生物组合同生产市场(依初级包装类型划分)
第23章:生物製药与微生物组合同生产市场(依企业规模划分)
第24章:生物製药与微生物组合同生产市场(依公司规模划分)
第25章:生物製药和微生物组合同生产市场(依主要地区划分)
第26章:生物製药和微生物组疗法的主要开发商
第27章:摘要整理洞见
第28章:结论
第29章:附录一:表格资料
第30章:公司与组织清单
Microbiome Manufacturing Market: Overview
As per Roots Analysis, the global microbiome manufacturing market is estimated to grow from USD 40.6 million in the current year to USD 186.7 million by 2035, at a CAGR of 14.9% during the forecast period, till 2035.
The market sizing and opportunity analysis has been segmented across the following parameters:
Type of Product Manufactured
- API
- FDF
Type of Formulation
- Solid
- Liquid
- Others
Type of Primary Packaging Used
- Blister Packs
- Glass / Plastic Bottles
- Pouches / Sachets
- Vials
Scale of Operation
- Clinical
- Commercial
Company Size
- Small
- Mid-sized
- Large and Very Large
Key Geographical Regions
- North America
- Europe
- Asia-Pacific
- Rest of the World
Microbiome Manufacturing Market: Growth and Trends
The human body contains many communities of microbes, encompassing both advantageous and harmful species, which are collectively called microbiota. Similarly, the ecological system of commensal, symbiotic, and pathogenic microorganisms living within a host system is referred to as the microbiome. Considering the influence of microbiota on disease development and pathogenesis, the concept of microbiome-targeted therapies has gradually captivated the attention of the medical research communities.
Microbiome based therapeutics provide an effective and alternative treatment option for a range of conditions, such as obesity, diabetes, immune system disorders, and digestive or gastrointestinal disorders. Microbiome-based live biotherapeutic products (LBPs) are formulations containing live microorganisms, such as bacteria or yeasts, designed to restore, modulate, or enhance the gut microbiome to treat or prevent diseases. It is worth highlighting that more than 165 clinical trials are currently underway to explore various microbiome-based therapeutic products across diverse regions. This trend is indicative of the extensive development efforts being undertaken by stakeholders in this domain.
However, microbiome-based therapeutics production is associated with several complexities, including prolonged development timelines, stringent temperature control requirements, complex engineering of diverse aerobic / anaerobic strains (depending on the type of microbe) and inconsistencies related to quality attributes of the final product. The lack of manufacturing capacity is another concern for companies developing intestinal microbiome strains. In the past few years, some players have circumvented this challenges by establishing in-house manufacturing capabilities. Nonetheless, some companies still require proof-of-concept data before investing in the establishment of a new in-house manufacturing facility. Such companies are currently outsourcing their operations to CMOs for live microbiome therapies. This provides significant opportunities for a few contract manufacturers with varying capabilities in this domain. With the ongoing pace of efforts to optimize the manufacturing of microbiome-based products, the CMO market is anticipated to witness steady growth in the coming decade.
Microbiome Manufacturing Market: Key Insights
The report delves into the current state of the microbiome manufacturing market and identifies potential growth opportunities within industry. Some key findings from the report include:
- The current market landscape features the presence of over 20 well-established players and new entrants that are engaged in the production of live biotherapeutics products, on contractual basis.
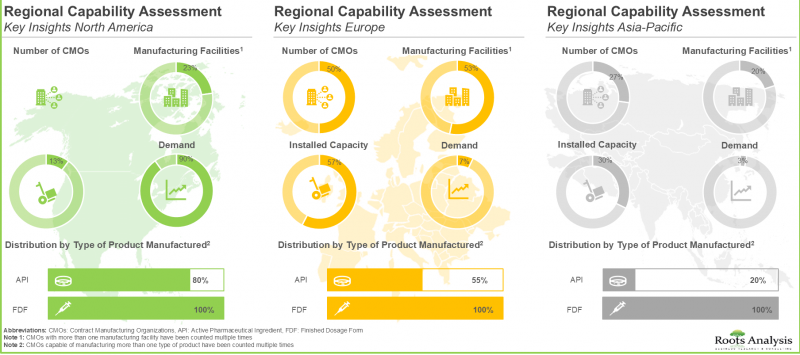
- Stakeholders claim to offer a range of services across different scales of operation; a relatively larger proportion of the finished drug products are manufactured in solid and liquid forms.
- Majority (50%) of the players having in-house manufacturing facilities in the US are mid-sized; these firms primarily have capabilities for pre-clinical / clinical scale production.
- In the past decade, a shift in trend has been observed in the microbiome manufacturing market as more players have set up manufacturing facilities in Europe.
- In pursuit of gaining a competitive edge, industry stakeholders are actively upgrading existing capabilities and enhancing their microbiome-focused service portfolios.
- To keep pace with the growing demand, many contract manufacturers have undertaken strategic initiatives, such as entering into mutually beneficial partnerships and expanding their capacities.
- More than 165 clinical trials (with nearly 22,000 enrolled patients) are currently underway to investigate microbiome based-therapeutic products, across different geographies.
- Microbiome contract manufacturers are anticipated to continue to form strategic alliances with players engaged in the development of microbiome therapeutics for contract manufacturing of their products.
- The global, installed contract manufacturing capacity is spread across various geographies; interestingly, around 43% of the total capacity is installed at the facilities owned by small players.
- Given the rapidly growing pipeline and the increasing demand for effective therapeutic interventions, microbiome developers prefer to leverage the expertise of contract manufacturers to ensure high quality of end-products.
- As more developers outsource various aspects of their respective drug manufacturing operations, it is anticipated that the microbiome CMOs market to grow at an annualized rate of over 14.9% in the coming decade.
Microbiome Manufacturing Market: Key Segments
Currently, API Occupies the Largest Share of the Microbiome Manufacturing Market
Based on the type of product manufactured, the market is segmented into API and FDF. At present, the API segment holds the maximum share of the microbiome manufacturing market. This trend is unlikely to change in the near future.
Currently, Liquid Formulation Segment Accounts for the Largest Share of the Microbiome Manufacturing Market
Based on the type of formulation, the market is segmented into solid, liquid and other formulations. Currently, liquid formulation holds the maximum share of the microbiome manufacturing market. This trend is likely to remain the same in the forthcoming years.
Sachets / Pouches is the Fastest Growing Segment in the Microbiome Manufacturing Market During the Forecast Period
Based on the type of primary packaging used, the market is segmented into blister packs, glass / plastic bottles, sachets / pouches and vials. It is worth highlighting that, at present, sachets / pouches hold a larger share of the microbiome manufacturing market. This trend is likely to remain the same in the coming decade.
By Scale of Operation, Commercial Scale is Likely to Dominate the Microbiome Manufacturing Market During the Forecast Period
Based on the scale of operation, the market is segmented into clinical and commercial scales. Whilst commercial scale manufacturing will be the primary driver of the overall market, it is worth highlighting that the microbiome manufacturing market at the clinical scale is likely to grow at a relatively higher CAGR.
Currently, Small Companies Occupies the Largest Share of the Microbiome Manufacturing Market
Based on the company size, the market is segmented into small, mid-sized, and large and very large companies. At present, small companies generate maximum revenue of the microbiome manufacturing market. This trend is unlikely to change in the near future.
Europe Accounts for the Largest Share of the Market
Based on key geographical regions, the market is segmented into North America, Europe, Asia-Pacific and Rest of the world. Majority of the current microbiome manufacturing market is captured by Europe. It is worth highlighting that the market in the rest of the world is expected to grow at a higher CAGR in the coming years.
Example Players in the Microbiome Manufacturing Market
- Biose
- BJP Laboratories
- Capsugel
- Chr. Hansen
- Infant Bacterial Therapeutics
- Inpac Probiotics
- MaaT Pharma
- Microbiomik Healthcare
- NIZO
- OxThera
- Rebiotix
- Seres Therapeutics
- WACKER
- Winclove
Primary Research Overview
The opinions and insights presented in this study were influenced by discussions conducted with multiple stakeholders. The research report features detailed transcripts of interviews held with the following industry stakeholders:
- Founder and Executive Chairman, Company A
- Managing Director and Scientific Head, Company B
- Managing Director and Chief Executive Officer, Company C
- Co- Founder and Chief Executive Officer, Company D
- Founder and Chief Executive Officer, Company E
- Chief Business Officer, Company F
- Chief Operating Officer, Company G
- Former Vice President, Business Development, Company H
- Former Vice President, Commercial Operations, Company I
- Former Vice President, Business Development, Company J
- Former Vice President. Sales and Business Development, Company K
- Head of Business Development, Company L
- Business Development Manager, Company M
Microbiome Manufacturing Market: Research Coverage
- Market Sizing and Opportunity Analysis: The report features an in-depth analysis of the microbiome manufacturing market, focusing on key market segments, including [A] type of product manufactured, [B] type of formulation, [C] type of primary packaging used, [D] scale of operation, [E] company size and [F] key geographical regions.
- Market Landscape: A comprehensive evaluation of microbiome manufacturing service providers, considering various parameters, such as [A] year of establishment, [B] company size, [C] location of headquarters, [D] scale of operation, [E] type of product manufactured, [F] type of formulation, [G] type of primary packaging used, [H] type of microbe used, [I] type of service offered, [J] number and location of manufacturing facilities and bioprocessing capacity, and [K] type of microbial species used.
- Regional Capability Analysis: A detailed landscape of the microbiome manufacturing facilities established across key geographical regions (North America, Europe and Asia-Pacific), highlighting the key manufacturing hubs for microbiomes.
- Company Competitiveness Analysis: A comprehensive competitive analysis of microbiome manufacturing service providers, examining factors, such as [A] supplier strength [B] portfolio diversity and [C] number of services offered.
- Company Profiles: In-depth profiles of key microbiome manufacturing service providers offering contract services for live biotherapeutic products at both clinical and commercial scale, focusing on [A] company overviews, [B] microbiome-related service portfolio, [C] microbiome manufacturing facilities, [D] recent developments and [E] an informed future outlook.
- Likely Partner Analysis: A detailed evaluation of nearly 70 microbiome-focused drug developers that are most likely to collaborate with contract manufacturers. This analysis considers various relevant parameters, including [A] developer strength (in terms of company size and its experience), [B] pipeline maturity (which takes into account the number of pipeline drugs and their affiliated stage of development), [C] pipeline strength (which takes into account the number of microbiome drugs in the company's pipeline), and [D] availability of in-house manufacturing capabilities.
- Big Pharma Analysis: A comprehensive examination of various microbiome-focused initiatives undertaken by major pharmaceutical companies. This analysis includes heat map visualizations that illustrate the distribution of leading pharmaceutical firms, as well as spider web diagrams that compare their initiatives across multiple relevant parameters.
- Recent Development and Initiatives: An analysis of recent trends, covering partnerships and collaborations, mergers and acquisitions, and expansion initiatives held in this domain.
- Clinical Trials Analysis: Examination of completed, ongoing, and planned clinical studies of various microbiome therapeutics, based on parameters, such as [A] trial registration year, [B] trial status, [C] trial phase, [D] enrolled patient population, [E] type of sponsor, [F] most active industry players (in terms of number of trials conducted), [G] study design, [H] therapeutic area and [I] key geographical regions.
- Capacity Analysis: Estimation of global microbiome-based therapies manufacturing capacity, derived from data provided by various industry stakeholders in the public domain. This analysis emphasizes the distribution of the available capacity on the basis of company size (small, mid-sized, and large and very large) and key geographical regions (North America, Europe, Asia-Pacific and Rest of the World).
- Demand Analysis: Informed estimates of the annual commercial and clinical demand for microbiome therapeutics, taking into account the target patient population in ongoing and planned clinical trials of microbiome therapeutics, sponsored by both industry and non-industry players.
- Make Versus Buy Decision Making Framework: An insightful framework that emphasizes the key indicators and factors that need to be considered by microbiome therapeutics developers to determine whether to manufacture their respective products in-house or outsource the manufacturing operation to contract service providers.
- Case Study: A case study on the current market landscape of microbiome contract research organizations and dietary supplement providers, including information on their year of establishment, company size and location of headquarters.
Key Questions Answered in this Report
- How many companies are currently engaged in this market?
- Which are the leading companies in this market?
- What is the current global capacity of microbiome manufacturers?
- Which microbiome therapy developers are most likely to collaborate with service providers?
- What factors are likely to influence the evolution of this market?
- What is the current and future market size?
- What is the CAGR of this market?
- How is the current and future market opportunity likely to be distributed across key market segments?
Reasons to Buy this Report
- The report provides a comprehensive market analysis, offering detailed revenue projections of the overall market and its specific sub-segments. This information is valuable to both established market leaders and emerging entrants.
- Stakeholders can leverage the report to gain a deeper understanding of the competitive dynamics within the market. By analyzing the competitive landscape, businesses can make informed decisions to optimize their market positioning and develop effective go-to-market strategies.
- The report offers stakeholders a comprehensive overview of the market, including key drivers, barriers, opportunities, and challenges. This information empowers stakeholders to stay abreast of market trends and make data-driven decisions to capitalize on growth prospects.
Additional Benefits
- Complimentary PPT Insights Packs
- Complimentary Excel Data Packs for all Analytical Modules in the Report
- 15% Free Content Customization
- Detailed Report Walkthrough Session with Research Team
- Free Updated report if the report is 6-12 months old or older
TABLE OF CONTENTS
1. PREFACE
1.1. Live Biotherapeutic Products and Microbiome Manufacturing Market Overview
- 1.2. Key Market Insights
- 1.3. Scope of the Report
- 1.4. Inclusions and Exclusions
- 1.5. Key Questions Answered
- 1.6. Chapter Outlines
2. RESEARCH METHODOLOGY
- 2.1. Chapter Overview
- 2.2. Research Assumptions
- 2.3. Project Methodology
- 2.4. Forecast Methodology
- 2.5. Robust Quality Control
- 2.6. Key Market Segmentations
- 2.7. Key Considerations
- 2.7.1. Demographics
- 2.7.2. Economic Factors
- 2.7.3. Government Regulations
- 2.7.4. Supply Chain
- 2.7.5. COVID Impact / Related Factors
- 2.7.6. Market Access
- 2.7.7. Healthcare Policies
- 2.7.8. Industry Consolidation
3. ECONOMIC AND OTHER PROJECT SPECIFIC CONSIDERATIONS
- 3.1. Chapter Overview
- 3.2. Market Dynamics
- 3.2.1. Time Period
- 3.2.1.1. Historical Trends
- 3.2.1.2. Current and Future Estimates
- 3.2.2. Currency Coverage
- 3.2.2.1. Overview of Major Currencies Affecting the Market
- 3.2.2.2. Impact of Currency Fluctuations on the Industry
- 3.2.3. Foreign Exchange Impact
- 3.2.3.1. Evaluation of Foreign Exchange Rates and Their Impact on Market
- 3.2.3.2. Strategies for Mitigating Foreign Exchange Risk
- 3.2.4. Recession
- 3.2.4.1. Historical Analysis of Past Recessions and Lessons Learnt
- 3.2.4.2. Assessment of Current Economic Conditions and Potential Impact on the Market
- 3.2.5. Inflation
- 3.2.5.1. Measurement and Analysis of Inflationary Pressures in the Economy
- 3.2.5.2. Potential Impact of Inflation on the Market Evolution
- 3.2.1. Time Period
4. EXECUTIVE SUMMARY
5. INTRODUCTION
- 5.1. Chapter Overview
- 5.2. Concept of Human Microbiota and Microbiome
- 5.3. Overview of Gut Flora
- 5.3.1. Role of Gut Flora in Healthy Individuals
- 5.3.2. Factors Affecting Human Gut Flora
- 5.4. The Human Microbiome Project (HMP)
- 5.5. Overview of Microbiome Therapies
- 5.5.1. Types of Microbiome Therapies
- 5.5.1.1. Probiotics
- 5.5.1.2. Prebiotics
- 5.5.2. Applications of Microbiome Therapies
- 5.5.3. Microbiome Therapies Supply Chain
- 5.5.1. Types of Microbiome Therapies
- 5.6. Microbiome-based Product Manufacturing
- 5.6.1. Key Steps Involved
- 5.6.2. Challenges Associated with Manufacturing of Microbiome Therapeutics
- 5.6.3. Role of Contract Manufacturing Organizations (CMOs)
- 5.6.4. Demand for Contract Manufacturing Services
- 5.7. Key Considerations while Selecting a Suitable CMO Partner
6. MARKET LANDSCAPE
- 6.1. Chapter Overview
- 6.2. Live Biotherapeutic Products and Microbiome Contract Manufacturers: Market Landscape
- 6.2.1. Analysis by Year of Establishment
- 6.2.2. Analysis by Company Size
- 6.2.3. Analysis by Location of Headquarters
- 6.2.4. Analysis by Scale of Operation
- 6.2.5. Analysis by Type of Product Manufactured
- 6.2.6. Analysis by Type of Formulation
- 6.2.7. Analysis by Scale of Operation and Type of Formulation
- 6.2.8. Analysis by Type of Primary Packaging Used
- 6.2.9. Analysis by Type of Formulation and Type of Primary Packaging Used
- 6.2.10. Analysis by Type of Microbe Used
- 6.2.11. Analysis by Type of Microbe Used and Location of Headquarters
- 6.2.12. Analysis by Type of Service Offered
- 6.2.13. Analysis by Number of Manufacturing Facilities (Region)
- 6.2.14. Analysis by Number of Manufacturing Facilities
(Country)
- 6.2.15. Analysis by Type of Microbial Species Used
- 6.3. Live Biotherapeutic Products and Microbiome In-House Manufacturers: Market Landscape
- 6.3.1. Analysis by Year of Establishment
- 6.3.2. Analysis by Company Size
- 6.3.3. Analysis by Location of Headquarters
- 6.3.4. Analysis by Scale of Operation
- 6.3.5. Analysis by Location of Manufacturing Facilities
7. REGIONAL CAPABILITY ANALYSIS
- 7.1. Chapter Overview
- 7.2. Key Assumptions and Parameters
- 7.3. Live Biotherapeutic Products and Microbiome Contract Manufacturers in North America
- 7.4. Live Biotherapeutic Products and Microbiome Contract Manufacturers in Europe
- 7.5. Live Biotherapeutic Products and Microbiome Contract Manufacturers in Asia-Pacific
8. COMPANY COMPETITIVENESS ANALYSIS
- 8.1. Chapter Overview
- 8.2. Key Assumptions and Parameters
- 8.3. Methodology
- 8.4. Company Competitiveness Analysis: Live Biotherapeutic Products and Microbiome Manufacturers
- 8.5. Capability Benchmarking of Top Microbiome Contract Manufactures
9. COMPANY PROFILES
- 9.1. Chapter Overview
- 9.2. Leading Live Biotherapeutic Products and Microbiome Contract Manufacturers in North America
- 9.2.1. Capsugel
- 9.2.1.1. Company Overview
- 9.2.1.2. Service Portfolio
- 9.2.1.3. Facilities Dedicated to Microbiome Manufacturing
- 9.2.1.4. Recent Developments and Future Outlook
- 9.2.1. Capsugel
- 9.3. Other Prominent Live Biotherapeutic Products and Microbiome Contract Manufacturers in North America
- 9.3.1. Arranta Bio
- 9.3.1.1. Company Overview
- 9.3.1.2. Service Portfolio
- 9.3.2. FUJIFILM Diosynth Biotechnologies
- 9.3.2.1. Company Overview
- 9.3.2.2. Service Portfolio
- 9.3.3. List Biological Laboratories
- 9.3.3.1. Company Overview
- 9.3.3.2. Service Portfolio
- 9.3.4. ProbioFerm
- 9.3.4.1. Company Overview
- 9.3.4.2. Service Portfolio
- 9.3.1. Arranta Bio
- 9.4. Leading Live Biotherapeutic Products and Microbiome Contract Manufacturers in Europe
- 9.4.1. Biose Industrie
- 9.4.1.1. Company Overview
- 9.4.1.2. Service Portfolio
- 9.4.1.3. Facilities Dedicated to Microbiome Manufacturing
- 9.4.1.4. Recent Developments and Future Outlook
- 9.4.2. Cerbios-Pharma
- 9.4.2.1. Company Overview
- 9.4.2.2. Service Portfolio
- 9.4.2.3. Facilities Dedicated to Microbiome Manufacturing
- 9.4.2.4. Recent Developments and Future Outlook
- 9.4.3. Chr. Hansen
- 9.4.3.1. Company Overview
- 9.4.3.2. Financial Information
- 9.4.3.3. Service Portfolio
- 9.4.3.4. Facilities Dedicated to Microbiome Manufacturing
- 9.4.3.5. Recent Developments and Future Outlook
- 9.4.4. Inpac Probiotics
- 9.4.4.1. Company Overview
- 9.4.4.2. Service Portfolio
- 9.4.4.3. Facilities Dedicated to Microbiome Manufacturing
- 9.4.4.4. Recent Developments and Future Outlook
- 9.4.5. NIZO
- 9.4.5.1. Company Overview
- 9.4.5.2. Service Portfolio
- 9.4.5.3. Facilities Dedicated to Microbiome Manufacturing
- 9.4.5.4. Recent Developments and Future Outlook
- 9.4.6. WACKER
- 9.4.6.1. Company Overview
- 9.4.6.2. Service Portfolio
- 9.4.6.3. Facilities Dedicated to Microbiome Manufacturing
- 9.4.6.4. Recent Developments and Future Outlook
- 9.4.7 Winclove Probiotics
- 9.4.7.1. Company Overview
- 9.4.7.2. Service Portfolio
- 9.4.7.3. Facilities Dedicated to Microbiome Manufacturing
- 9.4.7.4. Recent Developments and Future Outlook
- 9.4.1. Biose Industrie
- 9.5. Other Prominent Live Biotherapeutic Products and Microbiome Contract Manufacturers in Europe
- 9.5.1. BacThera
- 9.5.1.1. Company Overview
- 9.5.1.2. Service Portfolio
- 9.5.2. Evologic Technologies
- 9.5.2.1 Company Overview
- 9.5.2.2. Service Portfolio
- 9.5.3. Probiotical
- 9.5.3.1. Company Overview
- 9.5.3.2. Service Portfolio
- 9.5.4. QUAY Pharma
- 9.5.4.1. Company Overview
- 9.5.4.2. Service Portfolio
- 9.5.1. BacThera
- 9.6. Leading Live Biotherapeutic Products and Microbiome Contract Manufacturers in Asia-Pacific
- 9.6.1. BJP Laboratories
- 9.6.1.1. Company Overview
- 9.6.1.2. Service Portfolio
- 9.6.1.3. Facilities Dedicated to Microbiome Manufacturing
- 9.6.1.4. Recent Developments and Future Outlook
- 9.6.1. BJP Laboratories
- 9.7. Other Prominent Live Biotherapeutic Products and Microbiome Contract Manufacturers in Asia-Pacific
- 9.7.1. Aumgene Biosciences
- 9.7.1.1 Company Overview
- 9.7.1.2. Service Portfolio
- 9.7.2. AcuraBio
- 9.7.2.1. Company Overview
- 9.7.2.2. Service Portfolio
- 9.7.3. Meteoric Biopharmaceuticals
- 9.7.3.1. Company Overview
- 9.7.3.2. Service Portfolio
- 9.7.4. Probiotics Australia
- 9.7.4.1. Company Overview
- 9.7.4.2. Service Portfolio
- 9.7.5. Unique Biotech
- 9.7.5.1 Company Overview
- 9.7.5.2. Service Portfolio
- 9.7.1. Aumgene Biosciences
10. LIKELY PARTNER ANALYSIS
- 10.1. Chapter Overview
- 10.2. Key Assumptions and Parameters
- 10.3. Methodology
- 10.4. Key Potential Strategic Partners for Live Biotherapeutic Products and Microbiome Contract Manufacturers
- 10.4.1. Likely Partners in North America
- 10.4.2. Likely Partners in Europe
- 10.4.3. Likely Partners in Asia-Pacific
11. BIG PHARMA INITIATIVES
- 11.1. Chapter Overview
- 11.2. Methodology
- 11.3. Live Biotherapeutic Products and Microbiome-related Initiatives of Big Pharmaceutical Players
- 11.3.1. Analysis by Portfolio Diversity
- 11.3.2. Analysis by Trial Phase
- 11.3.3. Analysis by Type of Therapy
- 11.3.4. Analysis by Type of Molecule
- 11.3.5. Analysis by Therapeutic Area
- 11.3.6. Analysis by Number of Partnership and Funding Instances
- 11.4. Benchmark Analysis of Big Pharmaceutical Players
- 11.4.1. Spider Web Analysis: Early Stage / Late Stage Products
- 11.4.2. Spider Web Analysis: Portfolio Diversity
- 11.4.3. Spider Web Analysis: Funding and Investments
- 11.4.4. Spider Web Analysis: Partnerships and Collaborations
- 11.4.5. Spider Web Analysis: Therapeutic Areas
12. RECENT DEVELOPMENTS AND INITIATIVES
- 12.1. Chapter Overview
- 12.2. Partnerships and Collaborations
- 12.2.1. Partnership Models
- 12.2.2. Live Biotherapeutic Products and Microbiome Manufacturing: List of Partnerships and Collaborations
- 12.2.3. Analysis by Year of Partnership
- 12.2.4. Analysis by Type of Partnership
- 12.2.5. Analysis by Year and Type of Partnership
- 12.2.6. Analysis by Type of Organization
- 12.2.7. Analysis by Type of Partnership and Type of Organization
- 12.2.8. Analysis by Therapeutic Area
- 12.2.9. Most Active Players: Analysis by Number of Partnerships
- 12.2.9. Analysis by Geography
- 12.2.9.1. Intracontinental and Intercontinental Agreements
- 12.2.9.2. Local and International Agreements
- 12.3. Cumulative Year-wise Trend of Merger / Acquisition
- 12.3.1. Analysis by Key Value Drivers
- 12.3.2. Analysis by Year of Acquisition and Key Value Drivers
- 12.4. Recent Expansions
- 12.4.1. Purpose of Expansions
- 12.4.2. Live Biotherapeutic Products and Microbiome Manufacturing: Recent Expansions
- 12.4.1. Analysis by Year of Expansion
- 12.4.2. Analysis by Purpose of Expansion
- 12.4.3. Analysis by Year and Purpose of Expansion
- 12.4.4. Analysis by Scale of Operation
- 12.4.5. Analysis by Purpose of Expansion and Scale of Operation
- 12.4.6. Analysis by Geography
- 12.4.6.1. Analysis by Location of Expanded Facility (Region)
- 12.4.6.2. Analysis by Location of Expanded Facility (Country)
- 12.4.7. Analysis by Purpose of Expansion and Location of Expanded Facility (Region)
13. CLINICAL TRIAL ANALYSIS
- 13.1. Chapter Overview
- 13.2. Scope and Methodology
- 13.3. Live Biotherapeutic Products and Microbiome Manufacturing: Clinical Trial Analysis
- 13.3.1. Analysis by Trial Registration Year
- 13.3.2. Analysis by Trial Status
- 13.3.3. Analysis by Trial Registration Year and Trial Status
- 13.3.4. Analysis by Trial Phase
- 13.3.5. Analysis by Trial Registration Year and Trial Phase
- 13.3.6. Analysis of Enrolled Patient Population by Trial Registration Year
- 13.3.7. Analysis of Enrolled Patient Population by Trial Phase
- 13.3.8. Analysis by Type of Sponsor
- 13.3.9. Most Active Players: Analysis by Number of Registered Trials
- 13.3.10. Analysis by Study Design
- 13.3.11. Analysis by Therapeutic Area
- 13.3.12. Analysis of Number of Registered Trials by Geography
- 13.3.13. Analysis of Number of Registered Trials by Trial Status and Geography
- 13.3.14. Analysis of Enrolled Patient Population by Geography
- 13.3.15. Analysis of Enrolled Patient Population by Trial Status and Geography
14. CAPACITY ANALYSIS
- 14.1. Chapter Overview
- 14.2. Key Assumptions
- 14.3. Methodology
- 14.4. Live Biotherapeutic Products and Microbiome Contract Manufacturing: Global Installed Capacity
- 14.4.1. Analysis by Company Size
- 14.4.2. Analysis by Geography
- 14.4.2.1. Analysis of Installed Live Biotherapeutic Products and Microbiome Contract Manufacturing Capacity in North America
- 14.4.2.2. Analysis of Installed Live Biotherapeutic Products and Microbiome Contract Manufacturing Capacity in Europe
- 14.4.2.3. Analysis of Installed Live Biotherapeutic Products and Microbiome Contract Manufacturing Capacity Asia-Pacific and Rest of the World
15. DEMAND ANALYSIS
- 15.1. Chapter Overview
- 15.2. Methodology
- 15.3. Global Clinical Demand for Live Biotherapeutic Products and Microbiome Manufacturing
- 15.3.1. Analysis by Number of Trials Conducted
- 15.3.2. Analysis by Enrolled Patient Population
- 15.3.3. Analysis by Trial Phase
- 15.3.4. Analysis by Geography
- 15.3.4.1. Clinical Demand in North America
- 15.3.4.2. Clinical Demand in Europe
- 15.3.4.3. Clinical Demand in Asia-Pacific and Rest of the World
- 15.4. Global Commercial Demand for Live Biotherapeutic Products and Microbiome Manufacturing
16. MAKE VERSUS BUY DECISION MAKING FRAMEWORK
- 16.1. Chapter Overview
- 16.2. Key Assumptions and Parameters
- 16.3. Live Biotherapeutic Products and Microbiome Contract Manufacturers: Make versus Buy Decision Making Framework
- 16.3.1. Scenario 1
- 16.3.2. Scenario 2
- 16.3.3. Scenario 3
- 16.3.4. Scenario 4
- 16.4. Concluding Remarks
17. CASE STUDY: LIVE BIOTHERAPEUTIC PRODUCTS AND MICROBIOME CONTRACT RESEARCH ORGANIZATIONS (CROs) AND DIETARY SUPPLEMENT MANUFACTURERS
- 17.1 Chapter Overview
- 17.2. Live Biotherapeutic Products and Microbiome CROs
- 17.3. Live Biotherapeutic Products and Microbiome CROs: Market Landscape
- 17.3.1. Analysis by Year of Establishment
- 17.3.2. Analysis by Company Size
- 17.3.3. Analysis by Location of Headquarters
- 17.4. Microbiome Dietary Supplement Manufacturers: Market Landscape
- 17.4.1. Analysis by Year of Establishment
- 17.4.2. Analysis by Company Size
- 17.4.3. Analysis by Location of Headquarters
18. MARKET IMPACT ANALYSIS: DRIVERS, RESTRAINTS, OPPORTUNITIES AND CHALLENGES
- 18.1. Chapter Overview
- 18.2. Market Drivers
- 18.3. Market Restraints
- 18.4. Market Opportunities
- 18.5. Market Challenges
- 18.6. Conclusion
19. LIVE BIOTHERAPEUTIC PRODUCTS AND MICROBIOME CONTRACT MANUFACTURING MARKET
- 19.1. Chapter Overview
- 19.2. Key Assumptions and Methodology
- 19.3. Global Live Biotherapeutic Products and Microbiome Contract Manufacturing Market, till 2035
- 19.4. Scenario Analysis
- 19.4.1. Conservative Scenario
- 19.4.2. Optimistic Scenario
- 19.5. Key Market Segmentations
20. LIVE BIOTHERAPEUTIC PRODUCTS AND MICROBIOME CONTRACT MANUFACTURING MARKET, BY TYPE OF PRODUCT MANUFACTURED
- 20.1. Chapter Overview
- 20.2. Key Assumptions and Methodology
- 20.3. Live Biotherapeutic Products and Microbiome Contract Manufacturing Market: Distribution by Type of Product Manufactured, Current Year and 2035
- 20.3.1. Live Biotherapeutic Products and Microbiome Contract Manufacturing Market for APIs, till 2035
- 20.3.2. Live Biotherapeutic Products and Microbiome Contract Manufacturing Market for FDFs, till 2035
- 20.4. Data Triangulation
21. LIVE BIOTHERAPEUTIC PRODUCTS AND MICROBIOME CONTRACT MANUFACTURING MARKET, BY TYPE OF FORMULATION
- 21.1. Chapter Overview
- 21.2. Key Assumptions and Methodology
- 21.3. Live Biotherapeutic Products and Microbiome Contract Manufacturing Market: Distribution by Type of Formulation, Current Year and 2035
- 21.3.1. Live Biotherapeutic Products and Microbiome Contract Manufacturing Market for Solids, till 2035
- 21.3.2. Live Biotherapeutic Products and Microbiome Contract Manufacturing Market for Liquids, till 2035
- 21.3.3. Live Biotherapeutic Products and Microbiome Contract Manufacturing Market for Others, till 2035
- 21.4. Data Triangulation
22. LIVE BIOTHERAPEUTIC PRODUCTS AND MICROBIOME CONTRACT MANUFACTURING MARKET, BY TYPE OF PRIMARY PACKAGING USED
- 22.1. Chapter Overview
- 22.2. Key Assumptions and Methodology
- 22.3. Live Biotherapeutic Products and Microbiome Contract Manufacturing Market: Distribution by Type of Primary Packaging Used, Current Year and 2035
- 22.3.1. Live Biotherapeutic Products and Microbiome Contract Manufacturing Market for Blister Packs, till 2035
- 22.3.2. Live Biotherapeutic Products and Microbiome Contract Manufacturing Market for Glass / Plastic Bottles, till 2035
- 22.3.3. Live Biotherapeutic Products and Microbiome Contract Manufacturing Market for Pouches / Sachets, till 2035
- 22.3.4. Live Biotherapeutic Products and Microbiome Contract Manufacturing Market for Vials, till 2035
- 22.4. Data Triangulation
23. LIVE BIOTHERAPEUTIC PRODUCTS AND MICROBIOME CONTRACT MANUFACTURING MARKET, BY SCALE OF OPERATION
- 23.1. Chapter Overview
- 23.2. Key Assumptions and Methodology
- 23.3. Live Biotherapeutic Products and Microbiome Contract Manufacturing Market: Distribution by Type of Scale of Operation, Current Year and 2035
- 23.3.1. Live Biotherapeutic Products and Microbiome Contract Manufacturing Market for Clinical, till 2035
- 23.3.2. Live Biotherapeutic Products and Microbiome Contract Manufacturing Market for Commercial, till 2035
- 23.4. Data Triangulation
24. LIVE BIOTHERAPEUTIC PRODUCTS AND MICROBIOME CONTRACT MANUFACTURING MARKET, BY COMPANY SIZE
- 24.1. Chapter Overview
- 24.2. Key Assumptions and Methodology
- 24.3. Live Biotherapeutic Products and Microbiome Contract Manufacturing Market: Distribution by Company Size, Current Year and 2035
- 24.3.1. Live Biotherapeutic Products and Microbiome Contract Manufacturing Market for Small Companies, till 2035
- 24.3.2. Live Biotherapeutic Products and Microbiome Contract Manufacturing Market for Mid-Sized Companies, till 2035
- 24.3.3. Live Biotherapeutic Products and Microbiome Contract Manufacturing Market for Large and Very Large Companies, till 2035
- 24.4. Data Triangulation
25. LIVE BIOTHERAPEUTIC PRODUCTS AND MICROBIOME CONTRACT MANUFACTURING MARKET, BY KEY GEOGRAPHICAL REGIONS
- 25.1. Chapter Overview
- 25.2. Key Assumptions and Methodology
- 25.3. Live Biotherapeutic Products and Microbiome Contract Manufacturing Market: Distribution by Key Geographical Regions, Current Year and 2035
- 25.3.1. Live Biotherapeutic Products and Microbiome Contract Manufacturing Market for North America, till 2035
- 25.3.2. Live Biotherapeutic Products and Microbiome Contract Manufacturing Market for Europe, till 2035
- 25.3.3. Live Biotherapeutic Products and Microbiome Contract Manufacturing Market for Asia-Pacific, till 2035
- 25.3.4. Live Biotherapeutic Products and Microbiome Contract Manufacturing Market for Rest of the World, till 2035
- 25.4. Data Triangulation
26. LEADING DEVELOPERS FOR LIVE BIOTHERAPEUTIC PRODUCTS AND MICROBIOME THERAPIES
- 26.1. Chapter Overview
- 26.2. Key Assumptions and Methodology
- 26.3. Live Biotherapeutic Products and Microbiome Therapeutics Market: Distribution by Leading Developers
- 26.4. Data Triangulation
27. EXECUTIVE INSIGHTS
- 27.1. Chapter Overview
- 27.2. Company A
- 27.2.1. Company Snapshot
- 27.2.2. Interview Transcript: Founder and Executive Chairman
- 27.3. Company B
- 27.3.1. Company Snapshot
- 27.3.2. Interview Transcript: Managing Director and Scientific Head
- 27.4. Company C
- 27.4.1. Company Snapshot
- 27.4.2. Interview Transcript: Managing Director and Chief Executive Officer
- 27.5. Company D
- 27.5.1. Company Snapshot
- 27.5.2. Interview Transcript: Co- Founder and Chief Executive Officer
- 27.6. Company E
- 27.6.1. Company Snapshot
- 27.6.2. Interview Transcript: Founder and Chief Executive Officer
- 27.7. Company F
- 27.7.1. Company Snapshot
- 27.8.2. Interview Transcript: Chief Business Officer
- 27.8. Company G
- 27.8.1. Company Snapshot
- 27.8.2. Interview Transcript: Chief Operating Officer
- 27.9. Company H
- 27.9.1. Company Snapshot
- 27.9.2. Interview Transcript: Vice President, Business Development
- 27.10. Company I
- 27.10.1. Company Snapshot
- 27.10.2. Interview Transcript: Vice President, Commercial Operations
- 27.11. Company J
- 27.11.1. Company Snapshot
- 27.11.2. Interview Transcript: Vice President, Business Development
- 27.12. Company K
- 27.12.1. Company Snapshot
- 27.12.2. Interview Transcript: Vice President. Sales and Business Development
- 27.13. Company L
- 27.13.1. Company Snapshot
- 27.13.2. Interview Transcript: Head of Business Development
- 27.14. Company M
- 27.14.1. Company Snapshot
- 27.14.2. Interview Transcript: Business Development Manager
28. CONCLUDING REMARKS
29. APPENDIX I: TABULATED DATA
30. APPENDIX II: LIST OF COMPANIES AND ORGANIZATIONS
List of Tables
- Table 5.1 Different Types of Microbiota in the Gastrointestinal Tract
- Table 5.2 Various Food Items Containing Prebiotics
- Table 5.3 Harvey Ball Analysis: Comparison of Key Factors for the Selection of CMOs
- Table 6.1 List of Live Biotherapeutic Products and Microbiome Contract Manufacturers: Market Landscape
- Table 6.2 Live Biotherapeutic Products and Microbiome Contract Manufacturers: Information on Type of Product Manufactured
- Table 6.3 Live Biotherapeutic Products and Microbiome Contract Manufacturers: Information on Type of Formulation
- Table 6.4 Live Biotherapeutic Products and Microbiome Contract Manufacturers: Information on Type of Primary Packaging Used
- Table 6.5 Live Biotherapeutic Products and Microbiome Contract Manufacturers: Information on Type of Microbe Used
- Table 6.6 Live Biotherapeutic Products and Microbiome Contract Manufacturers: Information on Type of Service Offered
- Table 6.7 Live Biotherapeutic Products and Microbiome Contract Manufacturers: Information on Manufacturing Facilities
- Table 6.8 Live Biotherapeutic Products and Microbiome Contract Manufacturers: Information on Type of Microbial Species Used
- Table 6.9 List of Live Biotherapeutic Products and Microbiome In-House Manufacturers: Market Landscape
- Table 9.1 Capsugel: Company Overview
- Table 9.2. Arranta Bio: Company Overview
- Table 9.3. FUJIFILM Diosynth Biotechnologies: Company Overview
- Table 9.4 List Biological Laboratories: Company Overview
- Table 9.5 ProbioFerm: Company Overview
- Table 9.6 Biose: Company Overview
- Table 9.7 Biose: Recent Developments and Future Outlook
- Table 9.8 Cerbios-Pharma: Company Overview
- Table 9.9 Cerbios Pharma: Recent Developments and Future Outlook
- Table 9.10 Chr. Hansen: Company Overview
- Table 9.11 Chr Hansen: Recent Developments and Future Outlook
- Table 9.12 Inpac Probiotics: Company Overview
- Table 9.13 Inpac Probiotics: Recent Developments and Future Outlook
- Table 9.14 NIZO: Company Overview
- Table 9.15 NIZO: Recent Developments and Future Outlook
- Table 9.16 WACKER: Company Overview
- Table 9.17 WACKER: Recent Developments and Future Outlook
- Table 9.18 Winclove Probiotics: Company Overview
- Table 9.19 Winclove Probiotics: Recent Developments and Future Outlook
- Table 9.20 BacThera: Company Overview
- Table 9.21 Evologic Technologies: Company Overview
- Table 9.22 Probiotical: Company Overview
- Table 9.23 QUAY Pharma: Company Overview
- Table 9.24 BJP Laboratories: Company Overview
- Table 9.25 BJP Laboratories: Recent Developments and Future Outlook
- Table 9.26 Aumgene Biosciences: Company Overview
- Table 9.27 AcuraBio: Company Overview
- Table 9.28 Meteoric Biopharmaceuticals: Company Overview
- Table 9.29 Probiotics Australia: Company Overview
- Table 9.30: Unique Biotech: Company Overview
- Table 10.1 Likely Partners for Live Biotherapeutic Products and Microbiome Contract Manufacturers in North America
- Table 10.2 Likely Partners for Live Biotherapeutic Products and Microbiome Contract Manufacturers in Europe
- Table 10.3 Likely Partners for Live Biotherapeutic Products and Microbiome Contract Manufacturers in Asia-Pacific
- Table 12.1 Live Biotherapeutic Products and Microbiome Manufacturing: List of Partnerships and Collaborations, since 2016
- Table 12.2 Partnerships and Collaborations: Information on Type of Agreement, since 2016
- Table 12.3 Mergers and Acquisitions: Information on Key Value Drivers, since 2016
- Table 12.4 Live Biotherapeutic Products and Microbiome Manufacturing: List of Recent Expansions, since 2019
- Table 14.1 Live Biotherapeutic Products and Microbiome Contract Manufacturers: Information on Total Capacity (Sample Data Set)
- Table 14.2 Live Biotherapeutic Products and Microbiome Contract Manufacturers: Average Capacity by Company Size (Sample Data Set)
- Table 15.1 Global Clinical Demand for Live Biotherapeutic Products and Microbiome Manufacturing: Information on Number of Enrolled Patients and Trial Phase
- Table 15.2 Global Commercial Demand for Live Biotherapeutic Products and Microbiome Manufacturing: List of Microbiome-based Live Biotherapeutic Products
- Table 17.1 List of Live Biotherapeutic Products and Microbiome CROs: Market Landscape
- Table 17.2 Microbiome Dietary Supplement Manufacturers: Market Landscape
- Table 26.1 List of Leading Live Biotherapeutic Product and Microbiome Contract Manufacturing Companies
- Table 28.1 Osel: Company Snapshots
- Table 28.2 Unique Biotech: Company Snapshots
- Table 28.3 Meteoric Biopharmaceuticals: Company Snapshots
- Table 28.4 Biomedic: Company Snapshots
- Table 28.5 Siolta Therapeutics: Company Snapshots
- Table 28.6 BiomX: Company Snapshots
- Table 28.7 Vedanta Biosciences: Company Snapshots
- Table 28.8 Universal Stabilization Technologies: Company Snapshots
- Table 28.9 Arranta Bio: Company Snapshots
- Table 28.10 Assembly Biosciences: Company Snapshots
- Table 28.11 List Biological Laboratories: Company Snapshots
- Table 28.12 Luina Bio: Company Snapshots
- Table 28.13 WACKER: Company Snapshots
- Table 29.1 Live Biotherapeutic Products and Microbiome Contract Manufacturers: Distribution by Year of Establishment
- Table 29.2 Live Biotherapeutic Products and Microbiome Contract Manufacturers: Distribution by Company Size
- Table 29.3 Live Biotherapeutic Products and Microbiome Contract Manufacturers: Distribution by Location of Headquarters
- Table 29.4 Live Biotherapeutic Products and Microbiome Contract Manufacturers: Distribution by Scale of Operation
- Table 29.5 Microbiome Therapeutics Contract Manufacturers: Distribution by Type of Product Manufactured
- Table 29.6 Live Biotherapeutic Products and Microbiome Contract Manufacturers: Distribution by Type of Formulation
- Table 29.7 Live Biotherapeutic Products and Microbiome Contract Manufacturers: Distribution by Scale of Operation and Type of Formulation
- Table 29.8 Live Biotherapeutic Products and Microbiome Contract Manufacturers: Distribution by Type of Primary Packaging Used
- Table 29.9 Live Biotherapeutic Products and Microbiome Contract Manufacturers: Distribution by Type of Formulation and Type of Primary Packaging Used
- Table 29.10 Live Biotherapeutic Products and Microbiome Contract Manufacturers: Distribution by Type of Microbe Used
- Table 29.11 Live Biotherapeutic Products and Microbiome Contract Manufacturers: Distribution by Type of Microbe Used and Location of Headquarters
- Table 29.12 Live Biotherapeutic Products and Microbiome Contract Manufacturers: Distribution by Type of Service Offered
- Table 29.13 Live Biotherapeutic Products and Microbiome Contract Manufacturers: Distribution by Number of Manufacturing Facilities (Region)
- Table 29.14 Live Biotherapeutic Products and Microbiome Contract Manufacturers: Distribution by Number of Manufacturing Facilities (Country)
- Table 29.15 Live Biotherapeutic Products and Microbiome Contract Manufacturers: Distribution by Type of Microbial Species Used
- Table 29.16 Live Biotherapeutic Products and Microbiome In-House Manufacturers: Distribution by Year of Establishment
- Table 29.17 Live Biotherapeutic Products and Microbiome In-House Manufacturers: Distribution by Company Size
- Table 29.18 Live Biotherapeutic Products and Microbiome In-House Manufacturers: Distribution by Location of Headquarters
- Table 29.19 Live Biotherapeutic Products and Microbiome In-House Manufacturers: Distribution by Scale of Operation
- Table 29.20 Live Biotherapeutic Products and Microbiome In-House Manufacturers: Distribution by Location of Manufacturing Facilities
- Table 29.21 Live Biotherapeutic Products and Microbiome Contract Manufacturing Facilities in North America
- Table 29.22 Live Biotherapeutic Products and Microbiome Contract Manufacturing Facilities in Europe
- Table 29.23 Live Biotherapeutic Products and Microbiome Contract Manufacturing Facilities in Asia-Pacific
- Table 29.24 Partnerships and Collaborations: Distribution by Year of Partnership
- Table 29.25 Partnerships and Collaborations: Distribution by Type of Partnership
- Table 29.26 Partnerships and Collaborations: Distribution by Year and Type of Partnership
- Table 29.27 Partnerships and Collaborations: Distribution by Type of Organization
- Table 29.28 Partnerships and Collaborations: Distribution by Type of Partnership and Type of Organization
- Table 29.29 Partnerships and Collaborations: Distribution by Therapeutic Area
- Table 29.30 Most Active Players: Distribution by Number of Partnerships
- Table 29.31 Partnerships and Collaborations: Intracontinental and Intercontinental Agreements
- Table 29.32 Partnerships and Collaborations: Local and International Agreements
- Table 29.33 Mergers and Acquisitions: Year-wise Cumulative Trend, since 2016
- Table 29.34 Mergers and Acquisitions: Distribution by Key Value Drivers
- Table 29.35 Mergers and Acquisitions: Distribution by Year of Mergers and Acquisitions and Key Value Driver
- Table 29.36 Recent Expansions: Distribution by Year of Expansion
- Table 29.37 Recent Expansions: Distribution by Purpose of Expansion
- Table 29.38 Recent Expansions: Distribution by Year and Purpose of Expansion
- Table 29.39 Recent Expansions: Distribution by Scale of Operation
- Table 29.40 Recent Expansions: Distribution by Purpose of Expansion and Scale of Operation
- Table 29.41 Recent Expansions: Distribution by Location of Expanded Facility (Region)
- Table 29.42 Recent Expansions: Distribution by Location of Expanded Facility (Country)
- Table 29.43 Recent Expansions: Distribution by Purpose of Expansion and Location of Expanded Facility (Region)
- Table 29.44 Clinical Trial Analysis: Distribution by Trial Registration Year
- Table 29.45 Clinical Trial Analysis: Distribution by Trial Status
- Table 29.46 Clinical Trial Analysis: Distribution by Trial Registration Year and Trial Status
- Table 29.47 Clinical Trial Analysis: Distribution by Trial Phase
- Table 29.48 Clinical Trial Analysis: Distribution by Trial Registration Year and Trial Phase
- Table 29.49 Clinical Trial Analysis: Distribution of Enrolled Patient Population by Trial Registration Year
- Table 29.50 Clinical Trial Analysis: Distribution of Enrolled Patient Population by Trial Phase
- Table 29.51 Clinical Trial Analysis: Distribution by Type of Sponsor
- Table 29.52 Most Active Players: Distribution by Number of Registered Trials
- Table 29.53 Clinical Trial Analysis: Distribution by Study Design
- Table 29.54 Clinical Trial Analysis: Distribution by Therapeutic Area
- Table 29.55 Clinical Trial Analysis: Distribution of Number of Registered Trials by Geography
- Table 29.56 Clinical Trial Analysis: Distribution of Number of Registered Trials by Trial Status and Geography
- Table 29.57 Clinical Trial Analysis: Distribution of Enrolled Patient Population by Geography
- Table 29.58 Clinical Trial Analysis: Distribution of Enrolled Patient Population by Trial Status and Geography
- Table 29.59 Capacity Analysis: Distribution by Company Size
- Table 29.60 Capacity Analysis: Distribution by Geography
- Table 29.61 Global Installed Live Biotherapeutic Products and Microbiome Contract Manufacturing Capacity in North America
- Table 29.62 Global Installed Live Biotherapeutic Products and Microbiome Contract Manufacturing Capacity in Europe
- Table 29.63 Global Installed Live Biotherapeutic Products and Microbiome Contract Manufacturing Capacity in Asia-Pacific and RoW
- Table 29.64 Global Demand for Live Biotherapeutic Products and Microbiome Manufacturing, till 2035: Distribution by Number of Trials Conducted
- Table 29.65 Global Clinical Demand for Live Biotherapeutic Products and Microbiome Manufacturing: Distribution by Number of Enrolled Patient Population
- Table 29.66 Global Clinical Demand for Live Biotherapeutic Products and Microbiome Manufacturing: Distribution by Trial Phase
- Table 29.67 Global Clinical Demand for Live Biotherapeutic Products and Microbiome Manufacturing: Distribution by Geography
- Table 29.68 Global Clinical Demand for Live Biotherapeutic Products and Microbiome Manufacturing in North America, till 2035
- Table 29.69 Global Clinical Demand for Live Biotherapeutic Products and Microbiome Manufacturing in Europe, till 2035
- Table 29.70 Global Clinical Demand for Live Biotherapeutic Products and Microbiome Manufacturing in Asia-Pacific and Rest of the World, till 2035
- Table 29.71Global Commercial Demand for Live Biotherapeutic Products and Microbiome Manufacturing, till 2035: Distribution by Number of Target Patient Population (in Million)
- Table 29.72 Global Commercial Demand for Live Biotherapeutic Products and Microbiome Manufacturing, till 2035 (in cfu)
- Table 29.73 Live Biotherapeutic Products and Microbiome CROs: Distribution by Year of Establishment
- Table 29.74 Live Biotherapeutic Products and Microbiome CROs: Distribution by Company Size
- Table 29.75 Live Biotherapeutic Products and Microbiome CROs: Distribution by Location of Headquarters
- Table 29.76 Microbiome Dietary Supplement Manufacturers: Distribution by Year of Establishment
- Table 29.77 Microbiome Dietary Supplement Manufacturers: Distribution by Company Size
- Table 29.78 Microbiome Dietary Supplement Manufacturers: Distribution by Location of Headquarters
- Table 29.79 Global Live Biotherapeutic Products and Microbiome Contract Manufacturing Market, Conservative, Base and Optimistic Scenarios, till 2035 (USD Million)
- Table 29.80 Live Biotherapeutic Products and Microbiome Contract Manufacturing Market: Distribution by Type of Product Manufactured, Current Year and 2035 (USD Million)
- Table 29.81 Live Biotherapeutic Products and Microbiome Contract Manufacturing Market for APIs: (till 2035) Conservative, Base and Optimistic (USD Million)
- Table 29.82 Live Biotherapeutic Products and Microbiome Contract Manufacturing Market for FDFs: (till 2035) Conservative, Base and Optimistic (USD Million)
- Table 29.83 Live Biotherapeutic Products and Microbiome Contract Manufacturing Market: Distribution by Type of Product Formulation, Current Year and 2035 (USD Million)
- Table 29.84 Live Biotherapeutic Products and Microbiome Contract Manufacturing Market for Solid: (till 2035) Conservative, Base and Optimistic (USD Million)
- Table 29.85 Live Biotherapeutic Products and Microbiome Contract Manufacturing Market for Liquid: (till 2035) Conservative, Base and Optimistic (USD Million)
- Table 29.86 Live Biotherapeutic Products and Microbiome Contract Manufacturing Market for Others: (till 2035) Conservative, Base and Optimistic (USD Million)
- Table 29.87 Live Biotherapeutic Products and Microbiome Contract Manufacturing Market: Distribution by Type of Primary Packaging Used, Current Year and 2035 (USD Million)
- Table 29.88 Live Biotherapeutic Products and Microbiome Contract Manufacturing Market for Blister Packs: Future Estimates (till 2035) Conservative, Base and Optimistic (USD Million)
- Table 29.89 Live Biotherapeutic Products and Microbiome Contract Manufacturing Market for Glass / Plastic Bottles: (till 2035) Conservative, Base and Optimistic (USD Million)
- Table 29.90 Live Biotherapeutic Products and Microbiome Contract Manufacturing Market for Pouches / Sachets: (till 2035) Conservative, Base and Optimistic (USD Million)
- Table 29.91 Live Biotherapeutic Products and Microbiome Contract Manufacturing Market for Vials: (till 2035) Conservative, Base and Optimistic (USD Million)
- Table 29.92 Live Biotherapeutic Products and Microbiome Contract Manufacturing Market: Distribution by Scale of Operation, Current Year and 2035 (USD Million)
- Table 29.93 Live Biotherapeutic Products and Microbiome Contract Manufacturing Market for Clinical: (till 2035) Conservative, Base and Optimistic (USD Million)
- Table 29.94 Live Biotherapeutic Products and Microbiome Contract Manufacturing Market for Commercial: (till 2035) Conservative, Base and Optimistic (USD Million)
- Table 29.95 Live Biotherapeutic Products and Microbiome Contract Manufacturing Market: Distribution by Company Size, Current Year and 2035 (USD Million)
- Table 29.96 Live Biotherapeutic Products and Microbiome Contract Manufacturing Market for Small Companies: (till 2035) Conservative, Base and Optimistic (USD Million)
- Table 29.97 Live Biotherapeutic Products and Microbiome Contract Manufacturing Market for Mid-sized Companies: (till 2035) Conservative, Base and Optimistic (USD Million)
- Table 29.98 Live Biotherapeutic Products and Microbiome Contract Manufacturing Market for Large and Very Large Companies: (till 2035) Conservative, Base and Optimistic (USD Million)
- Table 29.99 Live Biotherapeutic Products and Microbiome Contract Manufacturing Market: Distribution by Key Geographical Regions, Current Year and 2035 (USD Million)
- Table 29.100 Live Biotherapeutic Products and Microbiome Contract Manufacturing Market in North America:(till 2035) Conservative, Base and Optimistic (USD Million)
- Table 29.101 Live Biotherapeutic Products and Microbiome Contract Manufacturing Market in Europe (till 2035) Conservative, Base and Optimistic (USD Million)
- Table 29.102 Live Biotherapeutic Products and Microbiome Contract Manufacturing Market in Asia-Pacific: till 2035) Conservative, Base and Optimistic (USD Million)
- Table 29.103 Live Biotherapeutic Products and Microbiome Contract Manufacturing Market in Rest of the World: (till 2035) Conservative, Base and Optimistic (USD Million)
- Table 29.104 Live Biotherapeutic Products and Microbiome Therapeutics Market, Distribution by Leading Developers, 2035
List of Figures
- Figure 2.1 Research Methodology: Research Assumptions
- Figure 2.2 Research Methodology: Project Methodology
- Figure 2.3 Research Methodology: Forecast Methodology
- Figure 2.4 Research Methodology: Robust Quality Control
- Figure 2.5 Research Methodology: Key Market Segmentations
- Figure 4.1 Executive Summary: Overall Market Landscape
- Figure 4.2 Executive Summary:
Recent Developments and
Initiatives
- Figure 4.3 Executive Summary: Clinical Trial Analysis
- Figure 4.4 Executive Summary: Capacity Analysis
- Figure 4.5 Executive Summary: Demand Analysis
- Figure 4.6 Executive Summary: Market Sizing and Opportunity Analysis
- Figure 5.1 Key Benefits of Human Microbiota
- Figure 5.2 Factors Affecting the Gut Flora
- Figure 5.3 Human Microbiome Project: Key Achievements
- Figure 5.4 Microbiome Therapies: Design Approaches
- Figure 5.5 Types of Microbiome Therapies
- Figure 5.6 Probiotic Drugs: Overview of Beneficial Bacterial Strains
- Figure 5.7 Microbiome Therapies: Potential Application Areas
- Figure 5.8 Key Steps Involved in Microbiome Therapeutics Supply Chain
- Figure 5.9 Key Steps Involved in Microbiome Therapeutics Manufacturing
- Figure 5.10 Key Challenges in Manufacturing of Microbiome Therapeutics
- Figure 5.11 Key Strategies to Increase Efficiency in Manufacturing Microbiome Therapeutics
- Figure 6.1 Live Biotherapeutic Products and Microbiome Contract Manufacturers: Distribution by Year of Establishment
- Figure 6.2 Live Biotherapeutic Products and Microbiome Contract Manufacturers: Distribution by Company Size
- Figure 6.3 Live Biotherapeutic Products and Microbiome Contract Manufacturers: Distribution by Location of Headquarters
- Figure 6.4 Live Biotherapeutic Products and Microbiome Contract Manufacturers: Distribution by Scale of Operation
- Figure 6.5 Live Biotherapeutic Products and Microbiome Contract Manufacturers: Distribution by Type of Product Manufactured
- Figure 6.6 Live Biotherapeutic Products and Microbiome Contract Manufacturers: Distribution by Type of Formulation
- Figure 6.7 Live Biotherapeutic Products and Microbiome Contract Manufacturers: Distribution by Scale of Operation and Type of Formulation
- Figure 6.8 Live Biotherapeutic Products and Microbiome Contract Manufacturers: Distribution by Type of Primary Packaging Used
- Figure 6.9 Live Biotherapeutic Products and Microbiome Contract Manufacturers: Distribution by Type of Formulation and Type of Primary Packaging Used
- Figure 6.10 Live Biotherapeutic Products and Microbiome Contract Manufacturers: Distribution by Type of Microbe Used
- Figure 6.11 Live Biotherapeutic Products and Microbiome Contract Manufacturers: Distribution by Type of Microbe Used and Location of Headquarters
- Figure 6.12 Live Biotherapeutic Products and Microbiome Contract Manufacturers: Distribution by Type of Service Offered
- Figure 6.13 Live Biotherapeutic Products and Microbiome Contract Manufacturers: Distribution by Number of Manufacturing Facilities (Region)
- Figure 6.14 Live Biotherapeutic Products and Microbiome Contract Manufacturers: Distribution by Number of Manufacturing Facilities (Country)
- Figure 6.15 Live Biotherapeutic Products and Microbiome Contract Manufacturers: Distribution by Type of Microbial Species Used
- Figure 6.16 Live Biotherapeutic Products and Microbiome In-House Manufacturers: Distribution by Year of Establishment
- Figure 6.17 Live Biotherapeutic Products and Microbiome In-House Manufacturers: Distribution by Company Size
- Figure 6.18 Live Biotherapeutic Products and Microbiome In-House Manufacturers: Distribution by Location of Headquarters
- Figure 6.19 Live Biotherapeutic Products and Microbiome In-House Manufacturers: Distribution by Scale of Operation
- Figure 6.20 Live Biotherapeutic Products and Microbiome In-House Manufacturers: Distribution by Location of Manufacturing Facilities
- Figure 7.1 Live Biotherapeutic Products and Microbiome Contract Manufacturers in North America
- Figure 7.2 Live Biotherapeutic Products and Microbiome Contract Manufacturers in Europe
- Figure 7.3 Live Biotherapeutic Products and Microbiome Contract Manufacturers in Asia-Pacific
- Figure 8.1 Company Competitiveness Analysis: Live Biotherapeutic Products and Microbiome Contract Manufacturers
- Figure 8.2 Benchmarking Analysis: Top Live Biotherapeutic Products and Microbiome Contract Manufacturers
- Figure 9.1 Capsugel: Service Portfolio
- Figure 9.2 Biose Industrie: Service Portfolio
- Figure 9.3 Cerbios-Pharma: Service Portfolio
- Figure 9.4 Chr. Hansen: Service Portfolio
- Figure 9.5 Inpac Probiotics: Service Portfolio
- Figure 9.6 NIZO: Service Portfolio
- Figure 9.7 WACKER: Service Portfolio
- Figure 9.8 Winclove Probiotics: Service Portfolio
- Figure 9.9 BJP Laboratories: Service Portfolio
- Figure 11.1 Big Pharma Initiatives: Top Pharmaceutical Companies
- Figure 11.2 Big Pharma Initiatives Distribution by Portfolio Diversity
- Figure 11.3 Big Pharma Initiatives Distribution by Trial Phase
- Figure 11.4 Big Pharma Initiatives Distribution by Type of Therapy
- Figure 11.5 Big Pharma Initiatives Distribution by Type of Molecule
- Figure 11.6 Big Pharma Initiatives Distribution by Therapeutic Areas
- Figure 11.7 Big Pharma Initiatives Distribution by Number of Partnerships and Funding
- Figure 11.8 Spider Web Analysis: Early Stage / Late Stage Products
- Figure 11.9 Spider Web Analysis: Portfolio Diversity
- Figure 11.10 Spider Web Analysis: Funding and Investments
- Figure 11.11 Spider Web Analysis: Partnerships and Collaboration
- Figure 11.12 Spider Web Analysis: Therapeutic Areas
- Figure 12.1 Partnerships and Collaborations: Distribution by Year of Partnership
- Figure 12.2 Partnerships and Collaborations: Distribution by Type of Partnership
- Figure 12.3 Partnerships and Collaborations: Distribution by Year and Type of Partnership
- Figure 12.4 Partnerships and Collaborations: Distribution by Type of Organization
- Figure 12.5 Partnerships and Collaborations: Distribution by Type of Partnership and Type of Organization
- Figure 12.6 Partnerships and Collaborations: Distribution by Therapeutic Area
- Figure 12.7 Most Active Players: Distribution by Number of Partnerships
- Figure 12.8 Partnerships and Collaborations: Intracontinental and Intercontinental Agreements
- Figure 12.9 Partnerships and Collaborations: Local and International Agreement
- Figure 12.10 Mergers and Acquisitions: Cumulative Year-wise Trend, since 2016
- Figure 12.11 Mergers and Acquisitions: Distribution by Key Value Drivers
- Figure 12.12 Mergers and Acquisitions: Distribution by Year of Mergers and Acquisitions and Key Value Driver
- Figure 12.13 Recent Expansions: Distribution by Year of Expansion
- Figure 12.14 Recent Expansions: Distribution by Purpose of Expansion
- Figure 12.15 Recent Expansions: Distribution by Year and Purpose of Expansion
- Figure 12.16 Recent Expansions: Distribution by Scale of Operation
- Figure 12.17 Recent Expansions: Distribution by Purpose of Expansion and Scale of Operation
- Figure 12.18 Recent Expansions: Distribution by Location of Expanded Facility (Region)
- Figure 12.19 Recent Expansions: Distribution by Location of Expanded Facility (Country)
- Figure 12.20 Recent Expansions: Distribution by Purpose of Expansion and Location of Expanded Facility (Region)
- Figure 13.1 Clinical Trial Analysis: Scope and Methodology
- Figure 13.2 Clinical Trial Analysis: Distribution by Trial Registration Year
- Figure 13.3 Clinical Trial Analysis: Distribution by Trial Status
- Figure 13.4 Clinical Trial Analysis: Distribution by Trial Registration Year and Trial Status
- Figure 13.5 Clinical Trial Analysis: Distribution by Trial Phase
- Figure 13.6 Clinical Trial Analysis: Distribution by Trial Registration Year and Trial Phase
- Figure 13.7 Clinical Trial Analysis: Distribution of Enrolled Patient Population by Trial Registration Year
- Figure 13.8 Clinical Trial Analysis: Distribution of Enrolled Patient Population by Trial Phase
- Figure 13.9 Clinical Trial Analysis: Distribution by Type of Sponsor
- Figure 13.10 Most Active Players: Distribution by Number of Registered Trials
- Figure 13.11 Clinical Trial Analysis: Distribution by Study Design
- Figure 13.12 Clinical Trial Analysis: Distribution by Therapeutic Area
- Figure 13.13 Clinical Trial Analysis: Distribution of Number of Registered Trials by Geography
- Figure 13.14 Clinical Trial Analysis: Distribution of Number of Registered Trials by Trial Status and Geography
- Figure 13.15 Clinical Trial Analysis: Distribution of Enrolled Patient Population by Geography
- Figure 13.16 Clinical Trial Analysis: Distribution of Enrolled Patient Population by Trial Status and Geography
- Figure 14.1 Global Installed Live Biotherapeutic Products and Microbiome Contract Manufacturing Capacity: Distribution by Company Size
- Figure 14.2 Global Installed Live Biotherapeutic Products and Microbiome Contract Manufacturing Capacity: Distribution by Geography
- Figure 14.3 Global Installed Live Biotherapeutic Products and Microbiome Contract Manufacturing Capacity in North America
- Figure 14.4 Global Installed Live Biotherapeutic Products and Microbiome Contract Manufacturing Capacity in Europe
- Figure 14.5 Global Installed Live Biotherapeutic Products and Microbiome Contract Manufacturing Capacity in Asia-Pacific and Rest of the World
- Figure 15.1 Global Demand for Live Biotherapeutic Products and Microbiome Manufacturing, till 2035: Distribution by Number of Trials Conducted
- Figure 15.2 Global Clinical Demand for Live Biotherapeutic Products and Microbiome Manufacturing, till 2035: Distribution by Enrolled Patient Population
- Figure 15.3 Global Clinical Demand for Live Biotherapeutic Products and Microbiome Manufacturing, till 2035: Distribution by Trial Phase
- Figure 15.4 Global Clinical Demand for Live Biotherapeutic Products and Microbiome Manufacturing: Distribution by Geography
- Figure 15.5 Global Clinical Demand for Live Biotherapeutic Products and Microbiome Manufacturing in North America, till 2035
- Figure 15.6 Global Clinical Demand for Live Biotherapeutic Products and Microbiome Manufacturing in Europe, till 2035
- Figure 15.7 Global Clinical Demand for Live Biotherapeutic Products and Microbiome Manufacturing in Asia-Pacific and Rest of the World, till 2035
- Figure 15.8 Global Commercial Demand for Live Biotherapeutic Products and Microbiome Manufacturing, till 2035: Distribution by Number of Target Patient Population (in Million)
- Figure 15.9 Global Commercial Demand for Live Biotherapeutic Products and Microbiome Manufacturing, till 2035 (in cfu)
- Figure 16.1 Make versus Buy Decision Making Framework
- Figure 16.2 Make versus Buy Decision Making: Possible Scenario Descriptions
- Figure 17.1 Live Biotherapeutic Products and Microbiome CROs: Distribution by Year of Establishment
- Figure 17.2 Live Biotherapeutic Products and Microbiome CROs: Distribution by Company Size
- Figure 17.3 Live Biotherapeutic Products and Microbiome CROs: Distribution by Location of Headquarters
- Figure 17.4 Microbiome Dietary Supplement Manufacturers: Distribution by Year of Establishment
- Figure 17.5 Microbiome Dietary Supplement Manufacturers: Distribution by Company Size
- Figure 17.6 Microbiome Dietary Supplement Manufacturers: Distribution by Location of Headquarters
- Figure 18.1 Live Biotherapeutic Products and Microbiome Contract Manufacturing: Market Drivers
- Figure 18.2 Live Biotherapeutic Products and Microbiome Contract Manufacturing: Market Restraints
- Figure 18.3 Live Biotherapeutic Products and Microbiome Contract Manufacturing: Market Opportunities
- Figure 18.4 Live Biotherapeutic Products and Microbiome Contract Manufacturing: Market Challenges
- Figure 19.1 Global Live Biotherapeutic Products and Microbiome Contract Manufacturing Market, till 2035: Base Scenario (USD Million)
- Figure 19.2 Global Live Biotherapeutic Products and Microbiome Contract Manufacturing Market, till 2035: Conservative Scenario (USD Million)
- Figure 19.3 Global Live Biotherapeutic Products and Microbiome Contract Manufacturing Market, till 2035: Optimistic Scenario (USD Million)
- Figure 20.1 Live Biotherapeutic Products and Microbiome Contract Manufacturing Market: Distribution by Type of Product Manufactured,
Current Year and 2035
- Figure 20.2 Live Biotherapeutic Products and Microbiome Contract Manufacturing Market for APIs, till 2035 (USD Million)
- Figure 20.3 Live Biotherapeutic Products and Microbiome Contract Manufacturing Market for FDFs, till 2035 (USD Million)
- Figure 21.1 Live Biotherapeutic Products and Microbiome Contract Manufacturing Market: Distribution by Type of
Formulation, Current Year and 2035
- Figure 21.2 Live Biotherapeutic Products and Microbiome Contract Manufacturing Market for Solids, till 2035 (USD Million)
- Figure 21.3 Live Biotherapeutic Products and Microbiome Contract Manufacturing Market for Liquids, till 2035 (USD Million)
- Figure 21.4 Live Biotherapeutic Products and Microbiome Contract Manufacturing Market for Others, till 2035 (USD Million)
- Figure 22.1 Live Biotherapeutic Products and Microbiome Contract Manufacturing Market: Distribution by Type of Primary Packaging Used,
Current Year and 2035
- Figure 22.2 Live Biotherapeutic Products and Microbiome Contract Manufacturing Market for Blister Packs, till 2035 (USD Million)
- Figure 22.3 Live Biotherapeutic Products and Microbiome Contract Manufacturing Market for Glass / Plastic Bottles, till 2035 (USD Million)
- Figure 22.4 Live Biotherapeutic Products and Microbiome Contract Manufacturing Market for Pouches / Sachets, till 2035 (USD Million)
- Figure 22.5 Live Biotherapeutic Products and Microbiome Contract Manufacturing Market for Vials, till 2035 (USD Million)
- Figure 23.1 Live Biotherapeutic Products and Microbiome Contract Manufacturing Market: Distribution by Scale of Operation, Current Year and 2035
- Figure 23.2 Live Biotherapeutic Products and Microbiome Contract Manufacturing Market for Clinical, till 2035 (USD Million)
- Figure 23.3 Live Biotherapeutic Products and Microbiome Contract Manufacturing Market for Commercial, till 2035 (USD Million)
- Figure 24.1 Live Biotherapeutic Products and Microbiome Contract Manufacturing Market: Distribution by Company Size, Current Year and 2035
- Figure 24.2 Live Biotherapeutic Products and Microbiome Contract Manufacturing Market for Small Companies, till 2035 (USD Million)
- Figure 24.3 Live Biotherapeutic Products and Microbiome Contract Manufacturing Market for Mid-sized Companies, till 2035 (USD Million)
- Figure 24.4 Live Biotherapeutic Products and Microbiome Contract Manufacturing Market for Large and Very Large Companies, till 2035 (USD Million)
- Figure 25.1 Live Biotherapeutic Products and Microbiome Contract Manufacturing Market: Distribution by Key Geographical Regions,
Current Year and 2035
- Figure 25.2 Live Biotherapeutic Products and Microbiome Contract Manufacturing Market in North America, till 2035 (USD Million)
- Figure 25.3 Live Biotherapeutic Products and Microbiome Contract Manufacturing Market in Europe, till 2035 (USD Million)
- Figure 25.4 Live Biotherapeutic Products and Microbiome Contract Manufacturing Market in Asia-Pacific, till 2035 (USD Million)
- Figure 25.5 Live Biotherapeutic Products and Microbiome Contract Manufacturing Market in Rest of the World, till 2035 (USD Million)
- Figure 26.1 Live Biotherapeutic Products and Microbiome Therapeutics Market, Distribution by Leading Developers
- Figure 27.1 Concluding Remarks: Live Biotherapeutic Products and Microbiome Manufacturing: Market Landscape
- Figure 27.2 Concluding Remarks: Live Biotherapeutic Products and Microbiome Manufacturing: Recent Developments and Initiatives
- Figure 27.3 Concluding Remarks: Live Biotherapeutic Products and Microbiome Manufacturing: Clinical Trial Analysis
- Figure 27.4 Concluding Remarks: Live Biotherapeutic Products and Microbiome Manufacturing: Capacity Analysis
- Figure 27.5 Concluding Remarks: Live Biotherapeutic Products and Microbiome Manufacturing: Demand Analysis
- Figure 27.6 Concluding Remarks: Live Biotherapeutic Products and Microbiome Manufacturing: Market Sizing and Opportunity Analysis

 微生物组技术在消费者健康领域的成长机会(2026-2030 年)全球微生物样本製备技术市场规模、份额、趋势和成长分析报告(2026-2034年)全球微生物组疗法市场规模、份额、趋势和成长分析报告(2026-2034年)
 微生物组样本製备技术市场-全球产业规模、份额、趋势、机会和预测:按产品、工作流程、应用、疾病类型、最终用户、地区和竞争格局划分,2021-2031年活体生物疗法和微生物CDMO市场-全球产业规模、份额、趋势、机会及预测(按应用、产品、製剂类型、规模、地区和竞争格局划分,2021-2031年)微生物组疗法市场-全球产业规模、份额、趋势、机会和预测,按类型、应用、地区和竞争格局划分,2021-2031年预测
 微生物组市场规模、份额和成长分析(按产品、应用和地区划分)-2026-2033年产业预测
 微生物组疗法市场预测至2032年:按治疗方法类型、目标领域、技术、应用、最终用户和地区分類的全球分析
 微生物组合作研究和许可协议(2016-2025)