


 |
市场调查报告书
商品编码
1883286
光电感测器市场:产业趋势及全球预测(至 2035 年)-依检测范围、光源、感测器类型、终端用户、结构、技术、公司规模及主要地区划分Photoelectric Sensor Market Till 2035: Distribution by Type of Range, Type of Source, Type of Sensor, Type of End-User, Type of Structure, Type of Technology, Company Size, and Key Geographical Regions: Industry Trends and Global Forecasts |
||||||
光电感测器市场概述
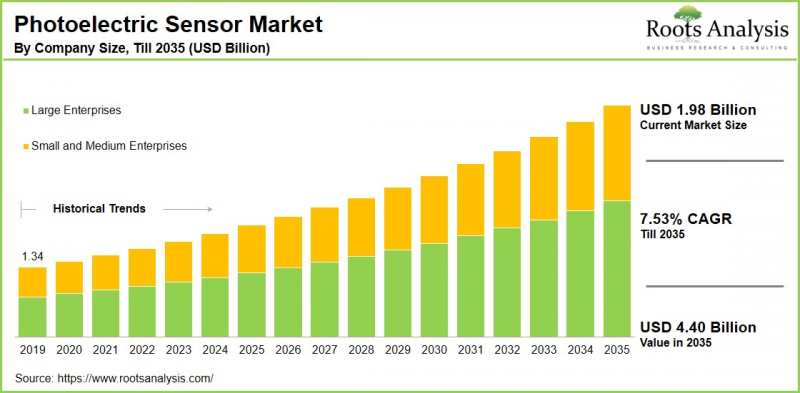
根据 Roots Analysis 预测,全球光电感测器市场规模预计将从 19.8 亿美元增长至 2035 年的 44 亿美元,预测期内(至 2035 年)复合年增长率 (CAGR) 为 7.53%。
光电感测器市场机会可区隔为以下几个部分:
侦测范围
- 小于 100 毫米
- 101 毫米至 1,000 毫米
- 1,001 毫米至 10,000 毫米
- 10,000 毫米以上
光源类型
- 红外线 (IR)
- LED
- 雷射光束
感测器类型
- 光纤光电感测器
- 雷射光电感测器
最终使用者类型
- 汽车与交通运输
- 楼宇自动化
- 消费性电子
- 电子与半导体
- 食品与饮料
- 工业製造
- 军事与航空航天
- 包装
- 製药与医疗
结构类型
- 内建放大器
- 光纤型
- 内建电源
- 独立扩大机
技术型别
- 漫反射
- 固定距离反射
- 集中反射
- 逆反射
- 小点固定反射
- 透射式光束
- 其他
公司规模
- 大型公司
- 中小企业
地区
- 北美洲
- 美国
- 加拿大
- 墨西哥
- 其他北美洲国家
- 欧洲
- 奥地利
- 比利时
- 丹麦
- 法国
- 德国
- 爱尔兰
- 义大利
- 荷兰
- 挪威
- 俄罗斯
- 西班牙
- 瑞典
- 瑞士
- 英国
- 其他欧洲国家
- 亚洲
- 中国
- 印度
- 日本
- 新加坡
- 东南亚韩国
- 其他亚洲国家
- 拉丁美洲
- 巴西
- 智利
- 哥伦比亚
- 委内瑞拉
- 其他拉丁美洲国家
- 中东和北非
- 埃及
- 伊朗
- 伊拉克
- 以色列
- 科威特
- 沙乌地阿拉伯
- 阿拉伯联合大公国
- 其他中东和北非国家
- 世界其他地区
- 澳大利亚
- 纽西兰
- 其他国家
光电感测器市场:成长与趋势
光电感测器是用来辨识物体颜色和距离的装置。这些感测器用作位置侦测器,并使用发光二极体 (LED) 作为光源。其工作原理是感测器向物体发射光,物体将光反射回感测器。透过计算光线到达物体并返回所需的时间,感测器可以精确测量到物体的距离。光电感测器的应用正在各个行业不断扩展,包括建筑和汽车行业。
近年来,全球光电感测器市场经历了显着成长和技术进步。这一增长主要得益于自动化程度的提高以及各种工业应用对高效物体检测感测器和监控解决方案日益增长的需求。此外,智慧互联设备的日益普及以及这些感测器与物联网 (IoT) 系统的整合进一步加速了市场成长。无线连接和紧凑型设计等创新正在拓展光电感测器的潜在应用。此外,工业 4.0 计画和对工作场所安全法规日益重视,也推动了对具有高精度、远距离检测和环境耐久性等先进功能的感测器的需求。
光电感测器市场:主要区隔市场
依侦测范围划分的市占率
根据侦测范围类型,全球光电感测器市场可区隔为小于 100 毫米、101 毫米至 1,000 毫米、1,001 毫米至 10,000 毫米以及大于 10,000 毫米四个部分。据我们估计,101 毫米至 1,000 毫米区隔市场目前占了大部分市场占有率。这一趋势的推动因素是市场对能够检测各种材质物体且检测距离远近不同的感测器的需求不断增长。此外,该区隔市场在各种应用中的适应性和高效性也促进了其在各个工业领域的广泛应用。
依光源类型划分的市占率
根据光源类型,全球光电感测器市场可分为红外线 (IR)、LED 和雷射光束三个部分。据我们估计,光电感测器目前占了大部分市场占有率。其成长主要得益于其卓越的精度、宽广的检测范围和可靠的距离测量能力。这些特性使其在汽车、包装和物流等对精确物体检测至关重要的行业中尤为重要。
依感测器类型划分的市占率
根据感测器类型,全球光电感测器市场可分为光纤光电感测器和雷射光电感测器。据我们估计,光纤光电感测器目前占了大部分市场占有率。这主要归功于其在各种工业应用中的灵活性和适应性。此外,其抗电磁干扰能力使其在製造业、包装业和食品加工业等对精确检测微小物体至关重要的行业中尤为重要。
然而,预计在预测期内,雷射光电感测器的复合年增长率将更高。这是由于市场对高精度、远距离检测能力的需求日益增长,因为与其他类型的感测器相比,雷射感测器在距离测量和物体检测方面具有更高的精度。
依最终用户划分的市占率
根据最终用户类型,全球光电感测器市场分为六个区隔市场:汽车与交通运输、建筑自动化、消费性电子、电子与半导体、食品与饮料、工业製造、军事与航空航太、包装、医药与医疗保健。据我们估计,包装领域目前占了大部分市场占有率。这一增长归功于光电感测器在物体检测、标籤检测、液位监控和包装品质保证等功能中的广泛应用。这些感测器有助于实现高效、精确的包装流程,从而提高生产效率并减少错误。
此外,预计汽车与交通运输领域在预测期内将以较高的复合年增长率成长。 这一成长主要得益于高级驾驶辅助系统 (ADAS) 和自动驾驶汽车的日益普及,这些感测器在碰撞避免、车道偏离预警、物体侦测、自适应照明等方面发挥着至关重要的作用。
依结构类型划分的市占率
依结构类型划分,全球光电感测器市场可分为整合式放大器、光纤、整合式电源和分立放大器。据我们估计,综合扩大机目前占了大部分市场占有率。这主要归功于其在半导体製造领域的广泛应用,在半导体製造中,对积体电路 (IC) 和晶圆进行可靠的检测至关重要。
然而,在预测期内,由于市场对光纤技术提供的灵活紧凑型感测解决方案的需求不断增长,因此光纤型感测器的复合年增长率预计将更高。
依技术类型划分的市占率
依技术类型划分,全球光电感测器市场可分为漫反射式、定距式、聚焦光束反射式、反射式、小光斑固定反射式、对射式及其他类型。据我们估计,反射式光电感测器目前占了大部分市场占有率。这主要归功于其在汽车、包装和製药等多个行业的广泛应用。反射式感测器利用反射器将光反射回感测器,因此其可靠的物体侦测能力使其备受欢迎,即使在复杂条件下也能实现有效检测。
依公司规模划分的市占率
依公司规模划分,全球光电感测器市场可分为大型企业及中小企业。据我们估计,大型企业目前占了大部分市场占有率。这种成长可归因于大型企业的敏捷性、创新能力、对专业市场的专注以及适应不断变化的客户偏好和市场动态的能力。
依地区划分的市占率
依地区划分,光电感测器市场分为北美、欧洲、亚洲、拉丁美洲、中东和北非以及世界其他地区。据我们估计,亚洲目前占了大部分市场占有率。这一增长可归因于主要市场参与者的存在、快速的工业化进程以及工业物联网 (IIoT) 对各种工业环境中光电感测器日益增长的影响。
光电感测器市场代表性公司范例
- Autonics
- Balluff
- Banner Engineering
- Baumer
- Carlo Gavazzi
- Contrinex
- DIS Sensors
- Eaton
- Fargo Controls
- HTM Sensors
- IFM Electronic
- Keyence
- Leuze electronic
- Locon Sensor Systems
- OMRON
- Optex
- Panasonic
- Pepperl+Fuchs
- Rockwell Automation
- Schneider Electric
- SensoPart Industriessensorik
- Sick Optical Electronic
- Turck
- Tri-Tronics
- Wrangler Sensoric
光电感测器市场:研究范围
本光电感测器市场报告深入分析以下几个面向:
- 市场规模与机会分析:对光电感测器市场进行详细分析。重点在于主要市场区隔,涵盖[A]检测范围、[B]光源类型、[C]感测器类型、[D]终端用户类型、[E]结构类型、[F]技术类型、[G]公司规模和[H]主要地区。
- 竞争格局:针对参与光电感测器市场的公司,基于多个相关参数的综合分析,例如产业规模、[C] 总部所在地、[D] 所有权结构等。
- 公司简介:提供光电感测器市场主要参与公司的详细简介,包括[A] 总部所在地、[B] 公司规模、[C] 企业理念、[D] 地理位置、[E] 管理层、[F] 联络方式、[G] 公司规模、[C] 企业理念、[D] 地理位置、[E] 管理层、[F] 联络方式、[G] 财务资讯、[H] 业务板块、[I] 光电感测器产品组合、[JK] 优势分析以及未来竞争发展与未来竞争。
- 宏观趋势:评估光电感测器产业当前的宏观趋势。
- 专利分析:提供光电感测器领域已提交和已授权专利的深入分析,涵盖[A] 专利类型、[B] 专利公开年份、[C] 专利年龄以及[D] 基于相关参数的主要参与者。
- 近期发展:概述光电感测器市场近期发展情况,并基于相关参数进行分析,例如[A] 启动年份、[B] 启动类型、[C] 地理分布和[D] 主要参与者。
- 波特五力分析:分析光电感测器市场中存在的五种竞争力量(新进入者的威胁、买方的议价能力、供应商的议价能力、替代品的威胁以及现有竞争对手之间的竞争)。
- SWOT 分析:深入的 SWOT 分析框架,突显该产业的优势、劣势、机会和威胁。此外,还提供哈维鲍尔分析,强调每个 SWOT 参数的相对影响。
- 价值链分析:全面的价值链分析,提供光电感测器市场各个阶段和利害关係人的资讯。
目录
第一部分:报告概述
第一章:引言
第二章:研究方法
第三章:市场动态
第四章:宏观经济指标
第二部分:质性分析
第五章:摘要整理
第六章:引言
- 章节概述
- 光电感测器市场概述
- 量程类型
- 光源类型
- 感测器类型
- 最终使用者类型
- 结构类型
- 技术类型
- 未来展望
第七章 监理环境
第三部分:市场概览
第八章:主要参与者综合资料库
第九章:竞争格局
第十章:市场空白分析
第十一章:竞争分析
第十二章:光电感测器市场的新创企业生态系
- 光电感测器市场:新创企业市场概况
- 主要发现
第四部分:公司简介
第十三章:公司个人资料
- 章节概述
- 奥托尼克斯
- 巴鲁夫
- 横幅工程
- 堡盟
- 卡洛·加瓦齐
- Contrinex
- DIS 感测器
- 伊顿
- 法哥控制
- HTM 感测器
- 易福门电子
- 基恩士
- 劳易测电子
- Locon 感测器系统
- 欧姆龙
- Optex
- Panasonic
- 罗克韦尔自动化
第五部分:市场趋势
第 14 章大趋势分析
第十五章 未满足需求分析
第十六章 专利分析
第十七章 最新进展
第六部分:市场机会分析
第十八章:全球光电感测器市场
第十九章:依侦测范围划分的市场机会
第二十章:依光源类型划分的市场机会
第二十一章:依感测器类型划分的市场机会
第二十二章:依最终使用者类型划分的市场机会
第二十三章:依结构划分的市场机会类型
第24章:依技术类型划分的市场机会
第25章:依公司规模划分的市场机会
第26章:北美光电感测器市场机会
第27章:欧洲光电感测器市场机会
第28章:亚洲光电感测器市场机会
第29章:中东和北非(MENA)光电感测器市场机会
第30章:拉丁美洲光电感测器市场机会
第31章:其他地区光电感测器市场机会
第32章:市场集中度分析:主要参与者的分布
第33章:邻近市场分析
第七部分:策略工具
第34章:关键制胜策略
第35章:波特五力分析
第36章:SWOT分析
第37章:价值链分析
第38章 ROOTS策略建议
第八部分:其他独家见解
第39章:来自一手研究的见解
第40章:报告结论
第九部分:附录
第41章:表格资料
第42章:公司与组织清单
第43章:客製化机会
第44章:ROOTS订阅服务
第45章:作者资讯
Photoelectric Sensor Market Overview
As per Roots Analysis, the global photoelectric sensor market size is estimated to grow from USD 1.98 billion in the current year USD 4.40 billion by 2035, at a CAGR of 7.53% during the forecast period, till 2035.
The opportunity for photoelectric sensor market has been distributed across the following segments:
Type of Range
- <100 mm
- 101 mm-1,000 mm
- 1,001 mm-10,000 mm
- >10,000 mm
Type of Source
- Infrared (IR)
- LED
- Laser Beam
Type of Sensor
- Fiber Optics Photoelectric sensor
- Laser Photoelectric sensor
Type of End User
- Automotive and Transportation
- Building Automation
- Consumer Electronics
- Electronics & Semiconductor
- Food & Beverages
- Industrial Manufacturing
- Military & Aerospace
- Packaging
- Pharmaceuticals & Medical
Type of Structure
- Amplifier Built-in
- Fiber Type
- Power Supply Built-in
- Separate Amplifier
Type of Technology
- Diffuse Reflective
- Fixed Distance
- Focused Beam Reflective
- Retroreflective
- Small Spot Definite Reflective
- Thru Beam
- Others
Company Size
- Large Enterprises
- Small and Medium Enterprises
Geographical Regions
- North America
- US
- Canada
- Mexico
- Other North American countries
- Europe
- Austria
- Belgium
- Denmark
- France
- Germany
- Ireland
- Italy
- Netherlands
- Norway
- Russia
- Spain
- Sweden
- Switzerland
- UK
- Other European countries
- Asia
- China
- India
- Japan
- Singapore
- South Korea
- Other Asian countries
- Latin America
- Brazil
- Chile
- Colombia
- Venezuela
- Other Latin American countries
- Middle East and North Africa
- Egypt
- Iran
- Iraq
- Israel
- Kuwait
- Saudi Arabia
- UAE
- Other MENA countries
- Rest of the World
- Australia
- New Zealand
- Other countries
Photoelectric Sensor Market: Growth and Trends
Photoelectric sensors are instruments created to identify the color and distance of objects. These sensors act as position detectors, employing light-emitting diodes (LEDs) as their source of illumination. The way they operate involves sending light from the sensor towards an object, which then reflects the light back to the sensor. By calculating the time, it takes for the light to reach the object and return, the sensor can precisely assess the object's distance. The application of photoelectric sensors is growing across different industries, especially in construction and automotive fields.
Recently, the global market for photoelectric sensors has experienced notable growth and technological progress. This expansion is primarily driven by a rise in automation and the need for efficient object detection sensors and monitoring solutions in various industrial applications. Furthermore, the increasing popularity of smart and interconnected devices, along with the incorporation of these sensors into internet of things (IoT) systems, has further propelled market growth. Innovations such as wireless connectivity and compact designs have widened the potential uses for photoelectric sensors. Additionally, initiatives associated with Industry 4.0 and an increased emphasis on workplace safety regulations have heightened the demand for these sensors, particularly those with advanced features like high precision, long-range detection, and environmental durability.
Photoelectric Sensor Market: Key Segments
Market Share by Type of Range
Based on type of range, the global photoelectric sensor market is segmented into <100 mm, 101 mm- 1,000 mm, 1,001mm- 10,000 mm, > 10,000 mm. According to our estimates, currently, the 101 mm-1,000 mm segment captures the majority of the market share. This trend is driven by the rising demand for sensors that can detect objects both at long and short ranges across various materials. Additionally, the adaptability and efficiency of this segment in multiple applications contribute to its popularity in various industries.
Market Share by Type of Source
Based on type of source, the global photoelectric sensor market is segmented into infrared (IR), LED, and laser beam. According to our estimates, currently, the photoelectric sensor segment captures the majority of the market share. This growth is driven by their exceptional precision, extensive detection ranges, and reliable distance measurement capabilities. These attributes render them especially vital in sectors like automotive, packaging, and logistics where accurate object detection is essential.
Market Share by Type of Sensor
Based on type of sensor, the global photoelectric sensor market is segmented into fiber optics photoelectric sensor, and laser photoelectric sensor. According to our estimates, currently, the fiber optics photoelectric segment captures the majority of the market share. This is due to its flexibility and adaptability across a range of industrial applications. Additionally, their immunity to electromagnetic interference makes them especially valuable for uses in manufacturing, packaging, and food processing sectors, where accurate detection of small items is crucial.
However, the laser photoelectric sensor segment is expected to grow at a higher CAGR during the forecast period. This can be attributed to the rising demand for high-precision and long-range detection capabilities, as laser sensors offer enhanced accuracy in distance measurement and object detection compared to other types of sensors.
Market Share by Type of End User
Based on type of end user, the global photoelectric sensor market is segmented into 6 automotive and transportation, building automation, consumer electronics, electronics & semiconductors, food & beverages, industrial manufacturing, military & aerospace, packaging, and pharmaceuticals & medical. According to our estimates, currently, the packaging segment captures the majority of the market share. This increase can be attributed to the widespread application of photoelectric sensors in functions such as object detection, label detection, fill level monitoring, and ensuring packaging quality. These sensors facilitate efficient and precise packaging processes, boost productivity, and reduce errors.
Furthermore, the automotive & transportation segment is expected to grow at a higher CAGR during the forecast period. This growth is driven by the increasing adoption of advanced driver-assistance systems (ADAS) and self-driving vehicles, where these sensors are vital for collision avoidance, lane departure warning, object detection, and adaptive lighting.
Market Share by Type of Structure
Based on type of structure, the global photoelectric sensor market is segmented into amplifier built-in, fiber type, power supply built-in, and separate amplifier. According to our estimates, currently, the built-in amplifier segment captures the majority of the market share. This is due to its wide application in semiconductor manufacturing, where the dependable detection of integrated circuits (ICs) and wafers is essential.
However, the fiber type segment is expected to grow at a higher CAGR during the forecast period, owing to the rising demand for flexible and compact sensing solutions provided by fiber optic technology.
Market Share by Type of Technology
Based on type of technology, the global photoelectric sensor market is segmented into diffuse reflective, fixed distance, focused beam reflective, retroreflective, small spot definite reflective, thru beam and others. According to our estimates, currently, the retro-reflective photoelectric sensor segment captures the majority of the market share. This is due to its extensive use in multiple industries such as automotive, packaging, and pharmaceuticals. Retro-reflective sensors are preferred for their reliable object detection capabilities since they use a reflector to redirect light back to the sensor, enabling effective detection even in difficult conditions.
Market Share by Company Size
Based on company size, the global photoelectric sensor market is segmented into large and small and medium enterprise. According to our estimates, currently, the large enterprise segment captures the majority of the market share. This can be attributed to their agility, ability to innovate, focus on specialized markets, and capability to adapt to evolving customer preferences and market dynamics.
Market Share by Geographical Regions
Based on geographical regions, the photoelectric sensor market is segmented into North America, Europe, Asia, Latin America, Middle East and North Africa, and the rest of the world. According to our estimates, currently Asia captures the majority share of the market. This growth can be attributed to the presence of key market players, the swift advancement of industrialization, the growing influence of the Industrial Internet of Things (IIoT) on photoelectric sensors in various industrial settings.
Example Players in Photoelectric Sensor Market
- Autonics
- Balluff
- Banner Engineering
- Baumer
- Carlo Gavazzi
- Contrinex
- DIS Sensors
- Eaton
- Fargo Controls
- HTM Sensors
- IFM Electronic
- Keyence
- Leuze electronic
- Locon Sensor Systems
- OMRON
- Optex
- Panasonic
- Pepperl+Fuchs
- Rockwell Automation
- Schneider Electric
- SensoPart Industriesensorik
- Sick Optic Electronic
- Turck
- Tri-Tronics
- Wrangler Sensoric
Photoelectric Sensor Market: Research Coverage
The report on the photoelectric sensor market features insights on various sections, including:
- Market Sizing and Opportunity Analysis: An in-depth analysis of the photoelectric sensor market, focusing on key market segments, including [A] type of range, [B] type of source, [C] type of sensor, [D] type of end-user, [E] type of structure, [F] type of technology, [G] company size, and [H] key geographical regions.
- Competitive Landscape: A comprehensive analysis of the companies engaged in the photoelectric sensor market, based on several relevant parameters, such as [A] year of establishment, [B] company size, [C] location of headquarters and [D] ownership structure.
- Company Profiles: Elaborate profiles of prominent players engaged in the photoelectric sensor market, providing details on [A] location of headquarters, [B] company size, [C] company mission, [D] company footprint, [E] management team, [F] contact details, [G] financial information, [H] operating business segments, [I] photoelectric sensor portfolio, [J] moat analysis, [K] recent developments, and an informed future outlook.
- Megatrends: An evaluation of ongoing megatrends in the photoelectric sensor industry.
- Patent Analysis: An insightful analysis of patents filed / granted in the photoelectric sensor domain, based on relevant parameters, including [A] type of patent, [B] patent publication year, [C] patent age and [D] leading players.
- Recent Developments: An overview of the recent developments made in the photoelectric sensor market, along with analysis based on relevant parameters, including [A] year of initiative, [B] type of initiative, [C] geographical distribution and [D] most active players.
- Porter's Five Forces Analysis: An analysis of five competitive forces prevailing in the photoelectric sensor market, including threats of new entrants, bargaining power of buyers, bargaining power of suppliers, threats of substitute products and rivalry among existing competitors.
- SWOT Analysis: An insightful SWOT framework, highlighting the strengths, weaknesses, opportunities and threats in the domain. Additionally, it provides Harvey ball analysis, highlighting the relative impact of each SWOT parameter.
- Value Chain Analysis: A comprehensive analysis of the value chain, providing information on the different phases and stakeholders involved in the photoelectric sensor market.
Key Questions Answered in this Report
- How many companies are currently engaged in photoelectric sensor market?
- Which are the leading companies in this market?
- What factors are likely to influence the evolution of this market?
- What is the current and future market size?
- What is the CAGR of this market?
- How is the current and future market opportunity likely to be distributed across key market segments?
Reasons to Buy this Report
- The report provides a comprehensive market analysis, offering detailed revenue projections of the overall market and its specific sub-segments. This information is valuable to both established market leaders and emerging entrants.
- Stakeholders can leverage the report to gain a deeper understanding of the competitive dynamics within the market. By analyzing the competitive landscape, businesses can make informed decisions to optimize their market positioning and develop effective go-to-market strategies.
- The report offers stakeholders a comprehensive overview of the market, including key drivers, barriers, opportunities, and challenges. This information empowers stakeholders to stay abreast of market trends and make data-driven decisions to capitalize on growth prospects.
Additional Benefits
- Complimentary Excel Data Packs for all Analytical Modules in the Report
- 15% Free Content Customization
- Detailed Report Walkthrough Session with Research Team
- Free Updated report if the report is 6-12 months old or older
TABLE OF CONTENTS
SECTION I: REPORT OVERVIEW
1. PREFACE
- 1.1. Introduction
- 1.2. Market Share Insights
- 1.3. Key Market Insights
- 1.4. Report Coverage
- 1.5. Key Questions Answered
- 1.6. Chapter Outlines
2. RESEARCH METHODOLOGY
- 2.1. Chapter Overview
- 2.2. Research Assumptions
- 2.3. Database Building
- 2.3.1. Data Collection
- 2.3.2. Data Validation
- 2.3.3. Data Analysis
- 2.4. Project Methodology
- 2.4.1. Secondary Research
- 2.4.1.1. Annual Reports
- 2.4.1.2. Academic Research Papers
- 2.4.1.3. Company Websites
- 2.4.1.4. Investor Presentations
- 2.4.1.5. Regulatory Filings
- 2.4.1.6. White Papers
- 2.4.1.7. Industry Publications
- 2.4.1.8. Conferences and Seminars
- 2.4.1.9. Government Portals
- 2.4.1.10. Media and Press Releases
- 2.4.1.11. Newsletters
- 2.4.1.12. Industry Databases
- 2.4.1.13. Roots Proprietary Databases
- 2.4.1.14. Paid Databases and Sources
- 2.4.1.15. Social Media Portals
- 2.4.1.16. Other Secondary Sources
- 2.4.2. Primary Research
- 2.4.2.1. Introduction
- 2.4.2.2. Types
- 2.4.2.2.1. Qualitative
- 2.4.2.2.2. Quantitative
- 2.4.2.3. Advantages
- 2.4.2.4. Techniques
- 2.4.2.4.1. Interviews
- 2.4.2.4.2. Surveys
- 2.4.2.4.3. Focus Groups
- 2.4.2.4.4. Observational Research
- 2.4.2.4.5. Social Media Interactions
- 2.4.2.5. Stakeholders
- 2.4.2.5.1. Company Executives (CXOs)
- 2.4.2.5.2. Board of Directors
- 2.4.2.5.3. Company Presidents and Vice Presidents
- 2.4.2.5.4. Key Opinion Leaders
- 2.4.2.5.5. Research and Development Heads
- 2.4.2.5.6. Technical Experts
- 2.4.2.5.7. Subject Matter Experts
- 2.4.2.5.8. Scientists
- 2.4.2.5.9. Doctors and Other Healthcare Providers
- 2.4.2.6. Ethics and Integrity
- 2.4.2.6.1. Research Ethics
- 2.4.2.6.2. Data Integrity
- 2.4.3. Analytical Tools and Databases
- 2.4.1. Secondary Research
3. MARKET DYNAMICS
- 3.1. Forecast Methodology
- 3.1.1. Top-Down Approach
- 3.1.2. Bottom-Up Approach
- 3.1.3. Hybrid Approach
- 3.2. Market Assessment Framework
- 3.2.1. Total Addressable Market (TAM)
- 3.2.2. Serviceable Addressable Market (SAM)
- 3.2.3. Serviceable Obtainable Market (SOM)
- 3.2.4. Currently Acquired Market (CAM)
- 3.3. Forecasting Tools and Techniques
- 3.3.1. Qualitative Forecasting
- 3.3.2. Correlation
- 3.3.3. Regression
- 3.3.4. Time Series Analysis
- 3.3.5. Extrapolation
- 3.3.6. Convergence
- 3.3.7. Forecast Error Analysis
- 3.3.8. Data Visualization
- 3.3.9. Scenario Planning
- 3.3.10. Sensitivity Analysis
- 3.4. Key Considerations
- 3.4.1. Demographics
- 3.4.2. Market Access
- 3.4.3. Reimbursement Scenarios
- 3.4.4. Industry Consolidation
- 3.5. Robust Quality Control
- 3.6. Key Market Segmentations
- 3.7. Limitations
4. MACRO-ECONOMIC INDICATORS
- 4.1. Chapter Overview
- 4.2. Market Dynamics
- 4.2.1. Time Period
- 4.2.1.1. Historical Trends
- 4.2.1.2. Current and Forecasted Estimates
- 4.2.2. Currency Coverage
- 4.2.2.1. Overview of Major Currencies Affecting the Market
- 4.2.2.2. Impact of Currency Fluctuations on the Industry
- 4.2.3. Foreign Exchange Impact
- 4.2.3.1. Evaluation of Foreign Exchange Rates and Their Impact on Market
- 4.2.3.2. Strategies for Mitigating Foreign Exchange Risk
- 4.2.4. Recession
- 4.2.4.1. Historical Analysis of Past Recessions and Lessons Learnt
- 4.2.4.2. Assessment of Current Economic Conditions and Potential Impact on the Market
- 4.2.5. Inflation
- 4.2.5.1. Measurement and Analysis of Inflationary Pressures in the Economy
- 4.2.5.2. Potential Impact of Inflation on the Market Evolution
- 4.2.6. Interest Rates
- 4.2.6.1. Overview of Interest Rates and Their Impact on the Market
- 4.2.6.2. Strategies for Managing Interest Rate Risk
- 4.2.7. Commodity Flow Analysis
- 4.2.7.1. Type of Commodity
- 4.2.7.2. Origins and Destinations
- 4.2.7.3. Values and Weights
- 4.2.7.4. Modes of Transportation
- 4.2.8. Global Trade Dynamics
- 4.2.8.1. Import Scenario
- 4.2.8.2. Export Scenario
- 4.2.9. War Impact Analysis
- 4.2.9.1. Russian-Ukraine War
- 4.2.9.2. Israel-Hamas War
- 4.2.10. COVID Impact / Related Factors
- 4.2.10.1. Global Economic Impact
- 4.2.10.2. Industry-specific Impact
- 4.2.10.3. Government Response and Stimulus Measures
- 4.2.10.4. Future Outlook and Adaptation Strategies
- 4.2.11. Other Indicators
- 4.2.11.1. Fiscal Policy
- 4.2.11.2. Consumer Spending
- 4.2.11.3. Gross Domestic Product (GDP)
- 4.2.11.4. Employment
- 4.2.11.5. Taxes
- 4.2.11.6. R&D Innovation
- 4.2.11.7. Stock Market Performance
- 4.2.11.8. Supply Chain
- 4.2.11.9. Cross-Border Dynamics
- 4.2.1. Time Period
SECTION II: QUALITATIVE INSIGHTS
5. EXECUTIVE SUMMARY
6. INTRODUCTION
- 6.1. Chapter Overview
- 6.2. Overview of Photoelectric Sensor Market
- 6.2.1. Type of Range
- 6.2.2. Type of Source
- 6.2.3. Type of Sensor
- 6.2.4. Type of End User
- 6.2.5. Type of Structure
- 6.2.6. Type of Technology
- 6.3. Future Perspective
7. REGULATORY SCENARIO
SECTION III: MARKET OVERVIEW
8. COMPREHENSIVE DATABASE OF LEADING PLAYERS
9. COMPETITIVE LANDSCAPE
- 9.1. Chapter Overview
- 9.2. Photoelectric Sensor: Overall Market Landscape
- 9.2.1. Analysis by Year of Establishment
- 9.2.2. Analysis by Company Size
- 9.2.3. Analysis by Location of Headquarters
- 9.2.4. Analysis by Ownership Structure
10. WHITE SPACE ANALYSIS
11. COMPANY COMPETITIVENESS ANALYSIS
12. STARTUP ECOSYSTEM IN THE PHOTOELECTRIC SENSOR MARKET
- 12.1. Photoelectric Sensor Market: Market Landscape of Startups
- 12.1.1. Analysis by Year of Establishment
- 12.1.2. Analysis by Company Size
- 12.1.3. Analysis by Company Size and Year of Establishment
- 12.1.4. Analysis by Location of Headquarters
- 12.1.5. Analysis by Company Size and Location of Headquarters
- 12.1.6. Analysis by Ownership Structure
- 12.2. Key Findings
SECTION IV: COMPANY PROFILES
13. COMPANY PROFILES
- 13.1. Chapter Overview
- 13.2. Autonics*
- 13.2.1. Company Overview
- 13.2.2. Company Mission
- 13.2.3. Company Footprint
- 13.2.4. Management Team
- 13.2.5. Contact Details
- 13.2.6. Financial Performance
- 13.2.7. Operating Business Segments
- 13.2.8. Service / Product Portfolio (project specific)
- 13.2.9. MOAT Analysis
- 13.2.10. Recent Developments and Future Outlook
- 13.3. Balluff
- 13.4. Banner Engineering
- 13.5. Baumer
- 13.6. Carlo Gavazzi
- 13.7. Contrinex
- 13.8. DIS Sensors
- 13.9. Eaton
- 13.10. Fargo Controls
- 13.11. HTM Sensors
- 13.12. IFM Electronic
- 13.13. Keyence
- 13.14. Leuze electronic
- 13.15. Locon Sensor Systems
- 13.16. OMRON
- 13.17. Optex
- 13.18. Panasonic
- 13.19. Rockwell Automation
SECTION V: MARKET TRENDS
14. MEGA TRENDS ANALYSIS
15. UNMEET NEED ANALYSIS
16. PATENT ANALYSIS
17. RECENT DEVELOPMENTS
- 17.1. Chapter Overview
- 17.2. Recent Funding
- 17.3. Recent Partnerships
- 17.4. Other Recent Initiatives
SECTION VI: MARKET OPPORTUNITY ANALYSIS
18. GLOBAL PHOTOELECTRIC SENSOR MARKET
- 18.1. Chapter Overview
- 18.2. Key Assumptions and Methodology
- 18.3. Trends Disruption Impacting Market
- 18.4. Demand Side Trends
- 18.5. Supply Side Trends
- 18.6. Global Photoelectric Sensor Market, Historical Trends (Since 2019) and Forecasted Estimates (Till 2035)
- 18.7. Multivariate Scenario Analysis
- 18.7.1. Conservative Scenario
- 18.7.2. Optimistic Scenario
- 18.8. Investment Feasibility Index
- 18.9. Key Market Segmentations
19. MARKET OPPORTUNITIES BASED ON TYPE OF RANGE
- 19.1. Chapter Overview
- 19.2. Key Assumptions and Methodology
- 19.3. Revenue Shift Analysis
- 19.4. Market Movement Analysis
- 19.5. Penetration-Growth (P-G) Matrix
- 19.6. Photoelectric Sensor Market for <100 mm: Historical Trends (Since 2019) and Forecasted Estimates (Till 2035)
- 19.7. Photoelectric Sensor Market for 101 mm-1,000mm: Historical Trends (Since 2019) and Forecasted Estimates (Till 2035)
- 19.8. Photoelectric Sensor Market for 1,001 mm-10,000mm: Historical Trends (Since 2019) and Forecasted Estimates (Till 2035)
- 19.9. Photoelectric Sensor Market for >10,000mm: Historical Trends (Since 2019) and Forecasted Estimates (Till 2035)
- 19.10. Data Triangulation and Validation
- 19.10.1. Secondary Sources
- 19.10.2. Primary Sources
- 19.10.3. Statistical Modeling
20. MARKET OPPORTUNITIES BASED ON TYPE OF SOURCE
- 20.1. Chapter Overview
- 20.2. Key Assumptions and Methodology
- 20.3. Revenue Shift Analysis
- 20.4. Market Movement Analysis
- 20.5. Penetration-Growth (P-G) Matrix
- 20.6. Photoelectric Sensor Market for Infrared (IR): Historical Trends (Since 2019) and Forecasted Estimates (Till 2035)
- 20.7. Photoelectric Sensor Market for LED: Historical Trends (Since 2019) and Forecasted Estimates (Till 2035)
- 20.8. Photoelectric Sensor Market for Laser Beam: Historical Trends (Since 2019) and Forecasted Estimates (Till 2035)
- 20.9. Data Triangulation and Validation
- 20.9.1. Secondary Sources
- 20.9.2. Primary Sources
- 20.9.3. Statistical Modeling
21. MARKET OPPORTUNITIES BASED ON TYPE OF SENSOR
- 21.1. Chapter Overview
- 21.2. Key Assumptions and Methodology
- 21.3. Revenue Shift Analysis
- 21.4. Market Movement Analysis
- 21.5. Penetration-Growth (P-G) Matrix
- 21.6. Photoelectric Sensor Market for Fiber Optics Photoelectric Sensor: Historical Trends (Since 2019) and Forecasted Estimates (Till 2035)
- 21.7. Photoelectric Sensor Market for Laser Photoelectric Sensor: Historical Trends (Since 2019) and Forecasted Estimates (Till 2035)
- 21.8. Data Triangulation and Validation
- 21.8.1. Secondary Sources
- 21.8.2. Primary Sources
- 21.8.3. Statistical Modeling
22. MARKET OPPORTUNITIES BASED ON TYPE OF END-USER
- 22.1. Chapter Overview
- 22.2. Key Assumptions and Methodology
- 22.3. Revenue Shift Analysis
- 22.4. Market Movement Analysis
- 22.5. Penetration-Growth (P-G) Matrix
- 22.6. Photoelectric Sensor Market for Automotive & Transportation: Historical Trends (Since 2019) and Forecasted Estimates (Till 2035)
- 22.7. Photoelectric Sensor Market for Building Automation: Historical Trends (Since 2019) and Forecasted Estimates (Till 2035)
- 22.8. Photoelectric Sensor Market for Consumer Electronics: Historical Trends (Since 2019) and Forecasted Estimates (Till 2035)
- 22.9. Photoelectric Sensor Market for Electronics & Semiconductor: Historical Trends (Since 2019) and Forecasted Estimates (Till 2035)
- 22.10. Photoelectric Sensor Market for Food & Beverages: Historical Trends (Since 2019) and Forecasted Estimates (Till 2035)
- 22.11. Photoelectric Sensor Market for Industrial Manufacturing: Historical Trends (Since 2019) and Forecasted Estimates (Till 2035)
- 22.12. Photoelectric Sensor Market for Military & Aerospace: Historical Trends (Since 2019) and Forecasted Estimates (Till 2035)
- 22.13. Photoelectric Sensor Market for Packaging: Historical Trends (Since 2019) and Forecasted Estimates (Till 2035)
- 22.14. Photoelectric Sensor Market for Pharmaceuticals & Medical: Historical Trends (Since 2019) and Forecasted Estimates (Till 2035)
- 22.15. Data Triangulation and Validation
- 22.15.1. Secondary Sources
- 22.15.2. Primary Sources
- 22.15.3. Statistical Modeling
23. MARKET OPPORTUNITIES BASED ON TYPE OF STRUCTURE
- 23.1. Chapter Overview
- 23.2. Key Assumptions and Methodology
- 23.3. Revenue Shift Analysis
- 23.4. Market Movement Analysis
- 23.5. Penetration-Growth (P-G) Matrix
- 23.6. Photoelectric Sensor Market for Amplifier Built-in: Historical Trends (Since 2019) and Forecasted Estimates (Till 2035)
- 23.7. Photoelectric Sensor Market for Fiber Type: Historical Trends (Since 2019) and Forecasted Estimates (Till 2035)
- 23.8. Photoelectric Sensor Market for Power Supply Built-in: Historical Trends (Since 2019) and Forecasted Estimates (Till 2035)
- 23.9. Photoelectric Sensor Market for Separate Amplifier: Historical Trends (Since 2019) and Forecasted Estimates (Till 2035)
- 23.10. Data Triangulation and Validation
- 23.10.1. Secondary Sources
- 23.10.2. Primary Sources
- 23.10.3. Statistical Modeling
24. MARKET OPPORTUNITIES BASED ON TYPE OF TECHNOLOGY
- 24.1. Chapter Overview
- 24.2. Key Assumptions and Methodology
- 24.3. Revenue Shift Analysis
- 24.4. Market Movement Analysis
- 24.5. Penetration-Growth (P-G) Matrix
- 24.6. Photoelectric Sensor Market for Diffuse Reflective: Historical Trends (Since 2019) and Forecasted Estimates (Till 2035)
- 24.7. Photoelectric Sensor Market for Fixed Distance: Historical Trends (Since 2019) and Forecasted Estimates (Till 2035)
- 24.8. Photoelectric Sensor Market for Focused Beam Reflective: Historical Trends (Since 2019) and Forecasted Estimates (Till 2035)
- 24.9. Photoelectric Sensor Market for Retroreflective: Historical Trends (Since 2019) and Forecasted Estimates (Till 2035)
- 24.10. Photoelectric Sensor Market for Small Spot Definite Reflective: Historical Trends (Since 2019) and Forecasted Estimates (Till 2035)
- 24.11. Photoelectric Sensor Market for Thru Beam: Historical Trends (Since 2019) and Forecasted Estimates (Till 2035)
- 24.12. Photoelectric Sensor Market for Others: Historical Trends (Since 2019) and Forecasted Estimates (Till 2035)
- 24.13. Data Triangulation and Validation
- 24.13.1. Secondary Sources
- 24.13.2. Primary Sources
- 24.13.3. Statistical Modeling
25. MARKET OPPORTUNITIES BASED ON COMPANY SIZE
- 25.1. Chapter Overview
- 25.2. Key Assumptions and Methodology
- 25.3. Revenue Shift Analysis
- 25.4. Market Movement Analysis
- 25.5. Penetration-Growth (P-G) Matrix
- 25.6. Photoelectric Sensor Market for Large Enterprises: Historical Trends (Since 2019) and Forecasted Estimates (Till 2035)
- 25.7. Photoelectric Sensor Market for Small and Medium Enterprises: Historical Trends (Since 2019) and Forecasted Estimates (Till 2035)
- 25.8. Data Triangulation and Validation
- 25.8.1. Secondary Sources
- 25.8.2. Primary Sources
- 25.8.3. Statistical Modeling
26. MARKET OPPORTUNITIES FOR PHOTOELECTRIC SENSOR IN NORTH AMERICA
- 26.1. Chapter Overview
- 26.2. Key Assumptions and Methodology
- 26.3. Revenue Shift Analysis
- 26.4. Market Movement Analysis
- 26.5. Penetration-Growth (P-G) Matrix
- 26.6. Photoelectric Sensor Market in North America: Historical Trends (Since 2019) and Forecasted Estimates (Till 2035)
- 26.6.1. Photoelectric Sensor Market in the US: Historical Trends (Since 2019) and Forecasted Estimates (Till 2035)
- 26.6.2. Photoelectric Sensor Market in Canada: Historical Trends (Since 2019) and Forecasted Estimates (Till 2035)
- 26.6.3. Photoelectric Sensor Market in Mexico: Historical Trends (Since 2019) and Forecasted Estimates (Till 2035)
- 26.6.4. Photoelectric Sensor Market in Other North American Countries: Historical Trends (Since 2019) and Forecasted Estimates (Till 2035)
- 26.7. Data Triangulation and Validation
27. MARKET OPPORTUNITIES FOR PHOTOELECTRIC SENSOR IN EUROPE
- 27.1. Chapter Overview
- 27.2. Key Assumptions and Methodology
- 27.3. Revenue Shift Analysis
- 27.4. Market Movement Analysis
- 27.5. Penetration-Growth (P-G) Matrix
- 27.6. Photoelectric Sensor Market in Europe: Historical Trends (Since 2019) and Forecasted Estimates (Till 2035)
- 27.6.1. Photoelectric Sensor Market in Austria: Historical Trends (Since 2019) and Forecasted Estimates (Till 2035)
- 27.6.2. Photoelectric Sensor Market in Belgium: Historical Trends (Since 2019) and Forecasted Estimates (Till 2035)
- 27.6.3. Photoelectric Sensor Market in Denmark: Historical Trends (Since 2019) and Forecasted Estimates (Till 2035)
- 27.6.4. Photoelectric Sensor Market in France: Historical Trends (Since 2019) and Forecasted Estimates (Till 2035)
- 27.6.5. Photoelectric Sensor Market in Germany: Historical Trends (Since 2019) and Forecasted Estimates (Till 2035)
- 27.6.6. Photoelectric Sensor Market in Ireland: Historical Trends (Since 2019) and Forecasted Estimates (Till 2035)
- 27.6.7. Photoelectric Sensor Market in Italy: Historical Trends (Since 2019) and Forecasted Estimates (Till 2035)
- 27.6.8. Photoelectric Sensor Market in Netherlands: Historical Trends (Since 2019) and Forecasted Estimates (Till 2035)
- 27.6.9. Photoelectric Sensor Market in Norway: Historical Trends (Since 2019) and Forecasted Estimates (Till 2035)
- 27.6.10. Photoelectric Sensor Market in Russia: Historical Trends (Since 2019) and Forecasted Estimates (Till 2035)
- 27.6.11. Photoelectric Sensor Market in Spain: Historical Trends (Since 2019) and Forecasted Estimates (Till 2035)
- 27.6.12. Photoelectric Sensor Market in Sweden: Historical Trends (Since 2019) and Forecasted Estimates (Till 2035)
- 27.6.13. Photoelectric Sensor Market in Switzerland: Historical Trends (Since 2019) and Forecasted Estimates (Till 2035)
- 27.6.14. Photoelectric Sensor Market in the UK: Historical Trends (Since 2019) and Forecasted Estimates (Till 2035)
- 27.6.15. Photoelectric Sensor Market in Other European Countries: Historical Trends (Since 2019) and Forecasted Estimates (Till 2035)
- 27.7. Data Triangulation and Validation
28. MARKET OPPORTUNITIES FOR PHOTOELECTRIC SENSOR IN ASIA
- 28.1. Chapter Overview
- 28.2. Key Assumptions and Methodology
- 28.3. Revenue Shift Analysis
- 28.4. Market Movement Analysis
- 28.5. Penetration-Growth (P-G) Matrix
- 28.6. Photoelectric Sensor Market in Asia: Historical Trends (Since 2019) and Forecasted Estimates (Till 2035)
- 28.6.1. Photoelectric Sensor Market in China: Historical Trends (Since 2019) and Forecasted Estimates (Till 2035)
- 28.6.2. Photoelectric Sensor Market in India: Historical Trends (Since 2019) and Forecasted Estimates (Till 2035)
- 28.6.3. Photoelectric Sensor Market in Japan: Historical Trends (Since 2019) and Forecasted Estimates (Till 2035)
- 28.6.4. Photoelectric Sensor Market in Singapore: Historical Trends (Since 2019) and Forecasted Estimates (Till 2035)
- 28.6.5. Photoelectric Sensor Market in South Korea: Historical Trends (Since 2019) and Forecasted Estimates (Till 2035)
- 28.6.6. Photoelectric Sensor Market in Other Asian Countries: Historical Trends (Since 2019) and Forecasted Estimates (Till 2035)
- 28.7. Data Triangulation and Validation
29. MARKET OPPORTUNITIES FOR PHOTOELECTRIC SENSOR IN MIDDLE EAST AND NORTH AFRICA (MENA)
- 29.1. Chapter Overview
- 29.2. Key Assumptions and Methodology
- 29.3. Revenue Shift Analysis
- 29.4. Market Movement Analysis
- 29.5. Penetration-Growth (P-G) Matrix
- 29.6. Photoelectric Sensor Market in Middle East and North Africa (MENA): Historical Trends (Since 2019) and Forecasted Estimates (Till 2035)
- 29.6.1. Photoelectric Sensor Market in Egypt: Historical Trends (Since 2019) and Forecasted Estimates (Till 205)
- 29.6.2. Photoelectric Sensor Market in Iran: Historical Trends (Since 2019) and Forecasted Estimates (Till 2035)
- 29.6.3. Photoelectric Sensor Market in Iraq: Historical Trends (Since 2019) and Forecasted Estimates (Till 2035)
- 29.6.4. Photoelectric Sensor Market in Israel: Historical Trends (Since 2019) and Forecasted Estimates (Till 2035)
- 29.6.5. Photoelectric Sensor Market in Kuwait: Historical Trends (Since 2019) and Forecasted Estimates (Till 2035)
- 29.6.6. Photoelectric Sensor Market in Saudi Arabia: Historical Trends (Since 2019) and Forecasted Estimates (Till 2035)
- 29.6.7. Photoelectric Sensor Market in United Arab Emirates (UAE): Historical Trends (Since 2019) and Forecasted Estimates (Till 2035)
- 29.6.8. Photoelectric Sensor Market in Other MENA Countries: Historical Trends (Since 2019) and Forecasted Estimates (Till 2035)
- 29.7. Data Triangulation and Validation
30. MARKET OPPORTUNITIES FOR PHOTOELECTRIC SENSOR IN LATIN AMERICA
- 30.1. Chapter Overview
- 30.2. Key Assumptions and Methodology
- 30.3. Revenue Shift Analysis
- 30.4. Market Movement Analysis
- 30.5. Penetration-Growth (P-G) Matrix
- 30.6. Photoelectric Sensor Market in Latin America: Historical Trends (Since 2019) and Forecasted Estimates (Till 2035)
- 30.6.1. Photoelectric Sensor Market in Argentina: Historical Trends (Since 2019) and Forecasted Estimates (Till 2035)
- 30.6.2. Photoelectric Sensor Market in Brazil: Historical Trends (Since 2019) and Forecasted Estimates (Till 2035)
- 30.6.3. Photoelectric Sensor Market in Chile: Historical Trends (Since 2019) and Forecasted Estimates (Till 2035)
- 30.6.4. Photoelectric Sensor Market in Colombia Historical Trends (Since 2019) and Forecasted Estimates (Till 2035)
- 30.6.5. Photoelectric Sensor Market in Venezuela: Historical Trends (Since 2019) and Forecasted Estimates (Till 2035)
- 30.6.6. Photoelectric Sensor Market in Other Latin American Countries: Historical Trends (Since 2019) and Forecasted Estimates (Till 2035)
- 30.7. Data Triangulation and Validation
31. MARKET OPPORTUNITIES FOR PHOTOELECTRIC SENSOR IN REST OF THE WORLD
- 31.1. Chapter Overview
- 31.2. Key Assumptions and Methodology
- 31.3. Revenue Shift Analysis
- 31.4. Market Movement Analysis
- 31.5. Penetration-Growth (P-G) Matrix
- 31.6. Photoelectric Sensor Market in Rest of the World: Historical Trends (Since 2019) and Forecasted Estimates (Till 2035)
- 31.6.1. Photoelectric Sensor Market in Australia: Historical Trends (Since 2019) and Forecasted Estimates (Till 2035)
- 31.6.2. Photoelectric Sensor Market in New Zealand: Historical Trends (Since 2019) and Forecasted Estimates (Till 2035)
- 31.6.3. Photoelectric Sensor Market in Other Countries
- 31.7. Data Triangulation and Validation
32. MARKET CONCENTRATION ANALYSIS: DISTRIBUTION BY LEADING PLAYERS
- 32.1. Leading Player 1
- 32.2. Leading Player 2
- 32.3. Leading Player 3
- 32.4. Leading Player 4
- 32.5. Leading Player 5
- 32.6. Leading Player 6
- 32.7. Leading Player 7
- 32.8. Leading Player 8
33. ADJACENT MARKET ANALYSIS
SECTION VII: STRATEGIC TOOLS
34. KEY WINNING STRATEGIES
35. PORTER'S FIVE FORCES ANALYSIS
36. SWOT ANALYSIS
37. VALUE CHAIN ANALYSIS
38. ROOTS STRATEGIC RECOMMENDATIONS
- 38.1. Chapter Overview
- 38.2. Key Business-related Strategies
- 38.2.1. Research & Development
- 38.2.2. Product Manufacturing
- 38.2.3. Commercialization / Go-to-Market
- 38.2.4. Sales and Marketing
- 38.3. Key Operations-related Strategies
- 38.3.1. Risk Management
- 38.3.2. Workforce
- 38.3.3. Finance
- 38.3.4. Others
SECTION VIII: OTHER EXCLUSIVE INSIGHTS
39. INSIGHTS FROM PRIMARY RESEARCH
40. REPORT CONCLUSION
SECTION IX: APPENDIX
41. TABULATED DATA
42. LIST OF COMPANIES AND ORGANIZATIONS
43. CUSTOMIZATION OPPORTUNITIES
44. ROOTS SUBSCRIPTION SERVICES
45. AUTHOR DETAILS
 光电感测器:全球市场份额和排名、总收入和需求预测(2026-2032年)
 全球光电感测器市场:依侦测模式、侦测范围、结构、光束光源、安装方式、最终用户、国家及地区划分-产业分析、市场规模、份额及预测(2025-2032年)
 光电感测器市场分析及预测(至2035年):依类型、产品类型、技术、应用、组件、功能、安装类型及最终用户划分
 2026 年至 2035 年光电感测器市场的机会、成长要素、产业趋势分析与预测。
 2026年全球光电感测器市场报告
 光电感测器市场 - 全球产业规模、份额、趋势、机会及预测(按类型、光束源、产业、地区和竞争格局划分,2021-2031年)
 光电感测器市场规模、占有率、成长及全球产业分析:按类型、应用和地区划分的洞察与预测(2026-2034)
 光电感测器市场规模、份额和成长分析(按类型、产品、检测距离、结构、光源、输出、应用和地区划分)-2026-2033年产业预测
 全球光电感测器市场:依检测方法、结构、安装方式及光源分類的2032年预测
 2025-2029年全球光电感测器市场