


 |
市场调查报告书
商品编码
1883719
金属和脂质奈米颗粒製造市场:产业趋势及全球预测(至 2035 年)-依公司规模、奈米颗粒类型、企业规模、终端用户类型和地区划分Metal and Lipid Nanoparticle Manufacturing Market: Industry Trends and Global Forecasts, Till 2035 - Distribution by Type of Service, Company Size, Type of Nanoparticles Manufactured, Scale of Operation, Type of End User and Key Geographical Regions |
||||||
金属与脂质奈米颗粒製造市场概述
根据 Roots Analysis 预测,金属和脂质奈米颗粒製造市场今年的规模预计为 21 亿美元,预计到 2035 年将以 8.6% 的复合年增长率增长。
金属与脂质奈米颗粒製造市场
市场规模和机会分析基于以下参数进行区隔:
公司规模
- 超小型
- 小型
- 中型
- 大型
奈米颗粒类型
- 脂质奈米颗粒
- 金属奈米颗粒奈米颗粒
业务规模
- 临床前
- 临床
- 商业
最终使用者类型
- 学术机构
- 製药公司
- 研究机构
- 其他最终用户
地理区域
- 北美
- 欧洲
- 亚洲
- 中东和北非
- 拉丁美洲
- 世界其他地区
金属与脂质奈米颗粒製造市场 - 成长与趋势
过去几十年,製药业经历了显着增长,药物研发管线中不断增加的候选药物(包括已上市和处于不同研发阶段的药物)便是明证。近期发表在 "分析与药物研究" 杂誌上的一项研究发现,目前约90%处于临床前研发阶段的候选药物和超过40%的上市药物都存在溶解度/渗透性问题。此外,研究也发现,每次药物与其他药物合併使用时,由于药物不相容性,其稳定性都会降低10%。因此,金属和脂质奈米颗粒製造市场的参与者正在积极寻求增强和完善药物的理化和药学特性的方法。在众多选择中,奈米颗粒的应用吸引了许多药物研发者的注意。在新冠疫情期间,新研发的疫苗被包裹了一层脂质奈米颗粒,用于将活性成分输送到目标。此外,许多药物研发者正在利用脂质/金属奈米颗粒重新设计其现有候选药物,以提高其生物利用度和生物相容性。然而,医疗产业使用的某些奈米颗粒面临着许多挑战,包括高度复杂且成本高昂的生产流程、对专业知识的需求(尤其是脂质奈米颗粒)、缺乏必要的基础设施以及储存和稳定性问题。鑑于这些日常营运和技术方面的挑战,越来越多的製药公司选择将奈米颗粒的生产流程外包给专业的服务提供者。
金属与脂质奈米颗粒生产市场-关键洞察
本报告深入分析了金属和脂质奈米颗粒生产市场的现状,并指出了该行业的潜在成长机会。报告的主要发现包括:
- 目前,全球有超过50家公司声称具备提供与脂质/金属奈米颗粒的开发和生产相关的各种服务的必要能力。
- 多家合约生产机构 (CMO) 拥有必要的专业知识,能够以各种规模生产不同类型的奈米颗粒,满足众多终端用户的需求。
- 许多为终端用户提供奈米颗粒合约服务的公司总部设在北美和欧洲。美国和德国已成为该地区最突出的国家。
- 为了在这个竞争激烈的行业中获得优势,奈米颗粒合约製造商不断努力改进其现有服务。
- 这种日益增长的兴趣也体现在合作活动的增加上,其中大部分交易都是与北美公司签署的。
- 受能够克服现有溶解性挑战的药物需求不断增长的推动,奈米颗粒合约製造市场预计到 2035 年将以 8.6% 的年增长率增长。
- 预计市场机会将受多种因素影响,包括企业规模、公司规模和主要地区。
金属和脂质奈米颗粒製造市场 - 主要区隔市场
大型公司主导金属和脂质奈米颗粒製造市场
依公司规模划分,市场分为超小型、小型、中型和大型公司。目前,金属和脂质奈米颗粒製造市场预计将占总市场占有率的约 40%。此外,预计中型企业的市场在预测期内将以更高的复合年增长率 (CAGR) 成长,达到 9.78%。
预期金属奈米颗粒将主导金属和脂质奈米颗粒製造市场。
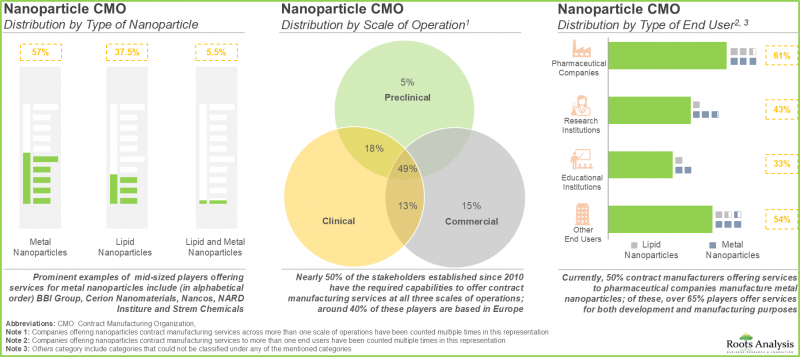
根据所製造的奈米颗粒类型,市场可分为脂质奈米颗粒和金属奈米颗粒。目前,预计金属奈米颗粒製造市场将占总市场占有率的约 60%。此外,脂质奈米颗粒市场预计在预测期内将以更高的复合年增长率 (CAGR) 成长,达到 8.98%。
预计商业规模将占金属和脂质奈米颗粒製造市场更大的占有率。
依营运规模,市场可分为临床前、临床及商业化三个部分。目前,商业领域占金属奈米颗粒製造市场的大部分占有率(60%)。此外,预计在预测期内,临床前和临床领域的复合年增长率将达到9.24%。
预计製药公司将占金属和脂质奈米颗粒製造市场的大部分占有率。
依最终用户划分,市场分为教育机构、製药公司、研究机构和其他最终用户。目前,製药公司占金属奈米颗粒製造市场的大部分占有率(60%)。此外,预计在预测期内,研究机构的市场复合年增长率将达到10.27%。
预计北美将占金属和脂质奈米颗粒製造市场的大部分占有率。
依地区划分,市场分为北美、欧洲、亚洲、中东和北非、拉丁美洲以及世界其他地区。目前,北美製药公司占了金属奈米颗粒製造市场的大部分占有率(40%)。此外,预计中东和北非市场在预测期内将以10.83%的复合年增长率成长。
金属和脂质奈米颗粒製造市场主要参与者
- Ardena
- CordenPharma
- Curia
- Evonik
- LSNE Contract Manufacturing
- Polymun
- TechNanoIndia
金属和脂质奈米颗粒製造市场 - 研究范围
- 市场规模和机会分析:本报告对金属和脂质奈米颗粒製造市场进行了详细分析,重点关注以下关键市场区隔:[A] 服务类型,[B] 公司规模,[C] 生产的奈米颗粒类型,[D] 营运规模,[E] 最终用户类型,以及 [F] 地理区域。
- 市场概况:本报告基于多个相关参数,对奈米颗粒代工生产商进行详细评估,这些参数包括:[A] 公司规模,[B] 总部所在地,[C] 组织结构,[D] 生产的奈米颗粒类型,[E] 生产设施的所在地和数量,[F] 运营规模,[G] 最终用户,[H] 生产设施的所在地和数量,[F] 运营规模,[G] 最终用户,[H] 提供监管机构的服务类型,
- 竞争分析:本报告对奈米颗粒代工生产商进行全面的竞争分析,考察了以下因素:[A] 服务优势和 [B] 合作伙伴关係优势。
- 公司简介:本报告详细介绍了领先的奈米颗粒代工生产商,重点关注:[A] 成立年份,[B] 总部所在地,[C] 产品组合,[D] 近期发展,以及 [E] 未来前景。
- 合作伙伴关係:本报告基于各种相关参数,例如[A] 合作年限、[B] 合作结构、[C] 合作伙伴类型和[D] 最活跃的参与者,对金属和脂质奈米颗粒製造市场利益相关者之间的合作伙伴关係和协作进行了深入分析。
- 外包:决策架构:本报告深入分析了奈米颗粒疗法开发商在决定是自行生产还是使用合约生产组织 (CMO) 时应考虑的各种因素。
目录
第一章:前言
第二章:摘要整理
第三章:导论
第四章:市场概况
第五章:关键洞见
第六章:竞争分析
第七章:公司简介
- 章节概述
- Ardena
- CordenPharma
- Curia
- Evonik
- LSNE合约製造
- Polymun
- TechNanoIndia
第八章 伙伴关係与合作
第九章:外包:可行/不可行架构
第十章:市场预测与机会分析
- 章节概述
- 预测研究方法与关键假设
- 2035年全球奈米颗粒合约製造市场
- 奈米颗粒合约製造市场 - 依公司规模划分
- 奈米颗粒合约製造市场 - 依奈米颗粒类型划分
- 奈米颗粒合约製造市场 - 依企业规模划分
- 奈米颗粒合约製造市场 - 依最终用户划分
- 奈米颗粒合约製造市场 - 依地区划分
- 奈米颗粒合约製造市场 - 依奈米颗粒依类型和地区划分的分布
- 结论
第十一章:结论
- 章节概述
第十二章:高阶主管见解
第十三章:附录一:表格资料
第十四章:附录二:公司与组织清单
Metal and Lipid nanoparticle Manufacturing Market: Overview
As per Roots Analysis, the metal and lipid nanoparticle manufacturing market is estimated to be worth USD 2.1 billion in the current year and is likely to grow at a CAGR of 8.6% during the forecast period, till 2035.
Metal And Lipid Nanoparticle Manufacturing Market
The market sizing and opportunity analysis has been segmented across the following parameters:
Company Size
- Very Small
- Small
- Mid-sized
- Large
Type of Nanoparticle(s) Manufactured
- Lipid Nanoparticle
- Metal Nanoparticle
Scale of Operation
- Preclinical
- Clinical
- Commercial
Type of End-user
- Educational Institutions
- Pharmaceutical Companies
- Research Institutions
- Other End Users
Geographical Regions
- North America
- Europe
- Asia
- Middle East and North Africa
- Latin America
- Rest of the World
Metal and Lipid nanoparticle Manufacturing Market: Growth and Trends
In recent decades, the pharmaceutical sector has experienced considerable growth, as reflected in the steadily increasing pipeline of drug candidates that have been launched or are under development at various development stages. A recent study featured in the journal of Analytical and Pharmaceutical Research has stated that approximately 90% of candidates in the ongoing preclinical development pipeline and over 40% of marketed pharmaceutical drugs are associated with issues concerning solubility / permeability. Additionally, it was observed that a pharmacological product exhibited a 10% decrease in robustness each time it was combined with another product, resulting from drug incompatibility. Consequently, participants in the metal and lipid nanoparticle manufacturing market are actively seeking methods to enhance or supplement the physicochemical attributes and drug-like characteristics of pharmacological products. Among other options, the application of nanoparticles has attracted the interest of numerous pharmaceutical developers. During the COVID-19 pandemic, the newly developed vaccines designed were encapsulated in a layer of lipid nanoparticles helping transport the active components to the intended area of effect. Additionally, numerous drug developers are utilizing lipid / metal nanoparticles to re-engineer current product candidates to enhance their bioavailability / biocompatibility. However, certain nanoparticles used in medical industry have manufacturing processes that are very intricate, costly, and filled with various challenges, including the requirement for specialized knowledge (particularly with lipid nanoparticles), insufficient facilities with the requisite infrastructure, and issues concerning storage and stability. Given the routine operational and technical difficulties, a growing number of pharmaceutical firms have shown a preference for outsourcing their nanoparticle manufacturing processes to specialized service providers.
Metal and Lipid nanoparticle Manufacturing Market: Key Insights
The report delves into the current state of the metal and lipid nanoparticle manufacturing market and identifies potential growth opportunities within industry. Some key findings from the report include:
- At present, more than 50 companies across the globe claim to have the required capabilities to offer a range of services for the development and manufacturing of lipid / metal nanoparticles.
- Several CMOs have the necessary expertise to provide production services for different types of nanoparticles across varied scales of operations; such players cater to the needs of a number of end users.
- Most of the players offering contract services for nanoparticles to different end users are headquartered in North America and Europe; the US and Germany have emerged as the most prominent countries within these regions.
- In order to gain an edge in this competitive industry, nanoparticle contract manufacturers are continuously undertaking initiatives to upgrade their existing service offerings.
- The growing interest is also evident from the rise in partnership activity; a major proportion of the deals were signed by companies based in North America.
- Driven by the rising demand for drugs that can overcome the existing challenges associated with solubility, the nanoparticle contract manufacturing market is estimated to grow at an annualized rate of 8.6%, till 2035.
- The projected market opportunity is likely to be distributed across different scales of operations, company size and key geographical regions.
Metal and Lipid Nanoparticle Manufacturing Market: Key Segments
Large Players Dominate the Metal and Lipid Nanoparticle Manufacturing Market
In terms of company size, the market is segmented across very small, small, mid-sized, and larger players. Currently, the metal and lipid nanoparticle manufacturing market is likely to capture around 40% of the overall market share. Further, the market for mid-sized players is likely to grow at a higher CAGR of 9.78%, during the given time period.
Metal Nanoparticles are Anticipated to Dominate the Metal and Lipid Nanoparticle Manufacturing Market
In terms of nanoparticle manufactured, the market is segmented across lipid and metal nanoparticles. Currently, the metal nanoparticle manufacturing market is likely to capture around 60% of the overall market share. Further, the market for lipid nanoparticles will grow at a higher CAGR of 8.98%, during the given time period.
Commercial Scale is Anticipated to Capture a Higher Metal and Lipid Nanoparticle Manufacturing Market Share
In terms of scale of operation, the market is segmented across preclinical, clinical and commercial segments. Currently, the majority (60%) of the metal nanoparticle manufacturing market is captured by commercial segment. Further, the market for preclinical and clinical segments is likely to grow at a higher CAGR of 9.24%, each during the forecast period.
Pharmaceutical Companies are Likely to Hold Majority of the Metal and Lipid Nanoparticle Manufacturing Market Share
In terms of end-user, the market is segmented across educational institutions, pharmaceutical companies, research institutes, and other end users. Currently, the majority (60%) of the metal nanoparticle manufacturing market is captured by pharmaceutical companies. Further, the market for research institutes is likely to grow at a higher CAGR of 10.27%, during the forecast period.
North America is Anticipated to Hold the Majority of the Metal and Lipid Nanoparticle Manufacturing Market Share
In terms of region, the market is segmented across North America, Europe, Asia, Middle East and North Africa, Latin America and Rest of the World. Currently, the majority (40%) of the metal nanoparticle manufacturing market is captured by pharmaceutical North America. Further, the market in Middle East and North Africa is likely to grow at a higher CAGR of 10.83%, during the forecast period.
Example Players in the Metal and Lipid Nanoparticle Manufacturing Market
- Ardena
- CordenPharma
- Curia
- Evonik
- LSNE Contract Manufacturing
- Polymun
- TechNanoIndia
Metal and Lipid nanoparticle Manufacturing Market: Research Coverage
- Market Sizing and Opportunity Analysis: The report features an in-depth analysis of the metal and lipid nanoparticle manufacturing market, focusing on key market segments, including [A] type of service, [B] company size, [C] type of nanoparticles manufactured, [D] scale of operation, [E] type of end-user [F] geographical regions.
- Market Landscape: provides a detailed assessment of nanoparticle contract manufacturers based on several relevant parameters, such as [A] company size, [B] location of headquarters, [C] type of organization, [D] type of nanoparticle(s) manufactured, [E] location and number of manufacturing facilities, [F] scale of operation, [G] type of end user, [H] type of service(s) offered, [I] quality certifications and [J] regulatory organizations.
- Company Competitiveness Analysis: A comprehensive competitive analysis of nanoparticle contract manufacturers, examining factors, such as [A] service strength and [B] partnership strength.
- Company Profiles: In-depth profiles of prominent players engaged in this domain that offer contract manufacturing services for nanoparticle(s), focusing on [A] year of establishment, [B] location of headquarters, [C] product portfolio, [D] recent developments and [E] an informed future outlook.
- Partnerships and Collaborations An insightful analysis of the partnerships and collaborations inked between stakeholders engaged in the metal and lipid nanoparticle manufacturing market based on various relevant parameters, including [A] year of partnership, [B] type of partnership, [C] type of partner and [D] most active players.
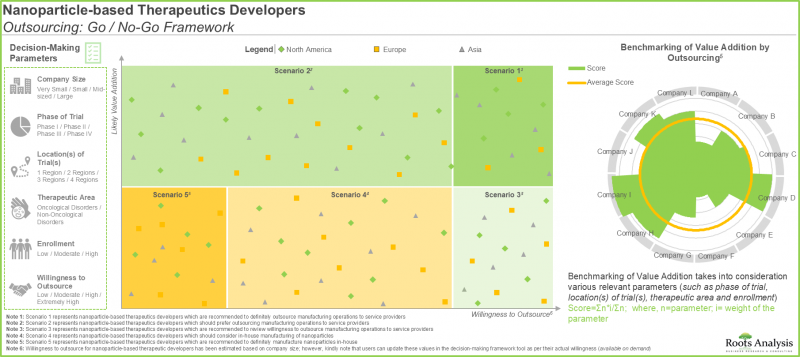
- Outsourcing: Go / No-Go Framework: An insightful analysis that highlights the various factors that need to be taken into consideration by nanoparticle-based therapeutics developers, while deciding whether to manufacture their respective therapeutics in-house or engage the services of a CMOs.
Key Questions Answered in this Report
- How many companies are currently engaged in this market?
- Which are the leading companies in this market?
- What is the current global capacity of developers?
- What factors are likely to influence the evolution of this market?
- What is the current and future market size?
- What is the CAGR of this market?
- How is the current and future market opportunity likely to be distributed across key market segments?
Reasons to Buy this Report
- The report provides a comprehensive market analysis, offering detailed revenue projections of the overall market and its specific sub-segments. This information is valuable to both established market leaders and emerging entrants.
- Stakeholders can leverage the report to gain a deeper understanding of the competitive dynamics within the market. By analyzing the competitive landscape, businesses can make informed decisions to optimize their market positioning and develop effective go-to-market strategies.
- The report offers stakeholders a comprehensive overview of the market, including key drivers, barriers, opportunities, and challenges. This information empowers stakeholders to stay abreast of market trends and make data-driven decisions to capitalize on growth prospects.
Additional Benefits
- Complimentary PPT Insights Packs
- Complimentary Excel Data Packs for all Analytical Modules in the Report
- 15% Free Content Customization
- Detailed Report Walkthrough Session with Research Team
- Free Updated report if the report is 6-12 months old or older
TABLE OF CONTENTS
1. PREFACE
- 1.1. Scope of the Report
- 1.2. Research Methodology
- 1.3. Key Questions Answered
- 1.4. Chapter Outlines
2. EXECUTIVE SUMMARY
3. INTRODUCTION
- 3.1. Chapter Overview
- 3.2. Introduction to Nanoparticles
- 3.2.1. Type of Nanoparticles
- 3.3. Challenges Associated with Manufacturing of Nanoparticles
- 3.4 Overview of Contract Manufacturing
- 3.4.1 Commonly Outsourced Nanoparticle Manufacturing Operations
- 3.5. Advantages of Outsourcing Nanoparticle Manufacturing Operations
- 3.6. Key Considerations while Selecting a Contract Manufacturing Partner
- 3.7. Future Perspective
4. MARKET LANDSCAPE
- 4.1. Chapter Overview
- 4.2. Nanoparticle Contract Manufacturers: Overall Market Landscape
- 4.2.1. Analysis by Year of Establishment
- 4.2.2. Analysis by Company Size
- 4.2.3. Analysis by Location of Headquarters
- 4.2.4. Analysis by Type of Organization
- 4.2.5. Analysis by Type of Nanoparticle(s) Manufactured
- 4.2.6. Analysis by Location of Manufacturing Facilities
- 4.2.7. Analysis by Scale of Operation
- 4.2.8. Analysis by Type of End User
- 4.2.9. Analysis by Type of Service(s) Offered
- 4.2.10. Analysis by Quality Certifications
- 4.2.11. Analysis by Regulatory Organizations
- 4.2.12. Leading Nanoparticle Contract Manufacturers: Analysis by Number of Manufacturing Facilities
5. KEY INSIGHTS
- 5.1. Chapter Overview
- 5.2. Analysis by Company Size and Type of Organization
- 5.3. Analysis by Company Size and Type of Nanoparticle(s) Manufactured
- 5.4. Analysis by Company Size and Scale of Operation
- 5.5. Analysis by Location of Headquarters (Country-wise)
- 5.6. Analysis by Company Size, Type of Nanoparticle(s) Manufactured, Number of Manufacturing Facilities, and Number of Services Offered (4D Bubble Representation)
- 5.7. Analysis by Type of Organization, Type of Nanoparticle(s) Manufactured, Scale of Operation, Type of End User, Type of Service(s) Offered (Grid Representation)
6. COMPANY COMPETITIVENESS ANALYSIS
- 6.1. Chapter Overview
- 6.2. Assumptions and Key Parameters
- 6.3. Methodology
- 6.4. Benchmarking of Service Strength
- 6.5. Benchmarking of Partnership Activity
- 6.6. Nanoparticle Contract Manufacturers: Company Competitiveness Analysis
- 6.6.1. Company Competitiveness Analysis: Very Small Companies
- 6.6.2. Company Competitiveness Analysis: Small Companies
- 6.6.3. Company Competitiveness Analysis: Mid-Sized Companies
- 6.6.4. Company Competitiveness Analysis: Large Companies
7. COMPANY PROFILES
- 7.1. Chapter Overview
- 7.2. Ardena
- 7.2.1. Company Overview
- 7.2.2. Recent Developments and Future Outlook
- 7.3. CordenPharma
- 7.3.1. Company Overview
- 7.3.2. Recent Developments and Future Outlook
- 7.4. Curia
- 7.4.1. Company Overview
- 7.4.2. Recent Developments and Future Outlook
- 7.5. Evonik
- 7.5.1. Company Overview
- 7.5.2. Recent Developments and Future Outlook
- 7.6. LSNE Contract Manufacturing
- 7.6.1. Company Overview
- 7.6.2. Recent Developments and Future Outlook
- 7.7. Polymun
- 7.7.1. Company Overview
- 7.7.2. Recent Developments and Future Outlook
- 7.8. TechNanoIndia
- 7.8.1. Company Overview
- 7.8.2. Recent Developments and Future Outlook
8. PARTNERSHIPS AND COLLABORATIONS
- 8.1. Chapter Overview
- 8.2. Partnership Models
- 8.3. Nanoparticle Contract Manufacturing: Partnerships and Collaborations
- 8.3.1. Analysis by Year of Partnership
- 8.3.2. Analysis by Type of Partnership
- 8.3.3. Analysis by Type of Partner
- 8.3.4. Analysis by Type of Nanoparticle(s) Manufactured
- 8.3.5. Emerging Focus Areas
- 8.3.6. Most Active Players: Analysis by Number of Partnerships
- 8.3.7. Analysis by Geography
- 8.3.7.1. Region-wise Distribution
- 8.3.7.2. Country-wise Distribution
- 8.8. Concluding Remarks
9. OUTSOURCING: GO / NO-GO FRAMEWORK
- 9.1. Chapter Overview
- 9.2. Outsourcing: Go / No-Go Framework
- 9.3. Nanoparticle-based Therapeutics Developers Outsourcing: Go / No-Go Framework
- 9.3.1. Assumptions and Parameter Definitions
- 9.3.2. Methodology
- 9.3.3. Results and Interpretations
- 9.3.3.1. Very Small Companies
9. 3.3.2. Small Companies
9. 3.3.3. Mid-Sized Companies
9. 3.3.4. Large Companies
9. 3.3.4. Very Large Companies
10. MARKET FORECAST AND OPPORTUNITY ANALYSIS
- 10.1. Chapter Overview
- 10.2. Forecast Methodology and Key Assumptions
- 10.3. Global Nanoparticle Contract Manufacturing Market, Till 2035
- 10.4. Nanoparticle Contract Manufacturing Market: Distribution by Company Size
- 10.4.1. Nanoparticle Contract Manufacturing Market for Very Small Companies, Till 2035
- 10.4.2. Nanoparticle Contract Manufacturing Market for Small Companies, Till 2035
- 10.4.3. Nanoparticle Contract Manufacturing Market for Mid-Sized Companies, Till 2035
- 10.4.4. Nanoparticle Contract Manufacturing Market for Large Companies, Till 2035
- 10.5. Nanoparticle Contract Manufacturing Market: Distribution by Type of Nanoparticle(s) Manufactured
- 10.5.1. Nanoparticle Contract Manufacturing Market for Lipid Nanoparticles, Till 2035
- 10.5.2. Nanoparticle Contract Manufacturing Market for Metal Nanoparticles, Till 2035
- 10.6. Nanoparticle Contract Manufacturing Market: Distribution by Scale of Operation
- 10.6.1. Nanoparticle Contract Manufacturing Market for Preclinical Scale Operations, Till 2035
- 10.6.2. Nanoparticle Contract Manufacturing Market for Clinical Scale Operations, Till 2035
- 10.6.3. Nanoparticle Contract Manufacturing Market for Commercial Scale Operations, Till 2035
- 10.7. Nanoparticle Contract Manufacturing Market: Distribution by Type of End User
- 10.7.1. Nanoparticle Contract Manufacturing Market for Educational Institutions, Till 2035
- 10.7.2. Nanoparticle Contract Manufacturing Market for Pharmaceutical Companies, Till 2035
- 10.7.3. Nanoparticle Contract Manufacturing Market for Research Institutions, Till 2035
- 10.7.4. Nanoparticle Contract Manufacturing Market for Other End Users, Till 2035
- 10.8. Nanoparticle Contract Manufacturing Market: Distribution by Region
- 10.8.1. Nanoparticle Contract Manufacturing Market in North America, Till 2035
- 10.8.2. Nanoparticle Contract Manufacturing Market in Europe, Till 2035
- 10.8.3. Nanoparticle Contract Manufacturing Market in Asia, Till 2035
- 10.8.4. Nanoparticle Contract Manufacturing Market in MENA, Till 2035
- 10.8.5. Nanoparticle Contract Manufacturing Market in Latin America, Till 2035
- 10.8.6. Nanoparticle Contract Manufacturing Market in Rest of the World, Till 2035
- 10.9. Nanoparticle Contract Manufacturing Market: Distribution by Type of Nanoparticle and Region
- 10.9.1. Nanoparticle Contract Manufacturing Market for Lipid Nanoparticles in North America, Till 2035
- 10.9.2. Nanoparticle Contract Manufacturing Market for Lipid Nanoparticles in Europe, Till 2035
- 10.9.3. Nanoparticle Contract Manufacturing Market for Lipid Nanoparticles in Asia, Till 2035
- 10.9.4. Nanoparticle Contract Manufacturing Market for Lipid Nanoparticles in MENA, Till 2035
- 10.9.5. Nanoparticle Contract Manufacturing Market for Lipid Nanoparticles in Latin America, Till 2035
- 10.9.6. Nanoparticle Contract Manufacturing Market for Lipid Nanoparticles in Rest of the World, Till 2035
- 10.9.7. Nanoparticle Contract Manufacturing Market for Metal Nanoparticles in North America, Till 2035
- 10.9.8. Nanoparticle Contract Manufacturing Market for Metal Nanoparticles in Europe, Till 2035
- 10.9.9. Nanoparticle Contract Manufacturing Market for Metal Nanoparticles in Asia, Till 2035
- 10.9.10. Nanoparticle Contract Manufacturing Market for Metal Nanoparticles in MENA, Till 2035
- 10.9.11. Nanoparticle Contract Manufacturing Market for Metal Nanoparticles in Latin America, Till 2035
- 10.9.12. Nanoparticle Contract Manufacturing Market for Metal Nanoparticles in Rest of the World, Till 2035
- 10.10. Concluding Remarks
11. CONCLUDING REMARKS
- 11.1. Chapter Overview
12. EXECUTIVE INSIGHTS
13. APPENDIX I: TABULATED DATA
14. APPENDIX II: LIST OF COMPANIES AND ORGANIZATION
List of Tables
- Table 4.1 Nanoparticle Contract Manufacturers: List of Companies
- Table 4.2 Nanoparticle Contract Manufacturers: Information on Type of Organization and Type of Nanoparticle(s) Manufactured
- Table 4.3 Nanoparticle Contract Manufacturers: Information on Location of Manufacturing Facility
- Table 4.4 Nanoparticle Contract Manufacturers: Information on Scale of Operation
- Table 4.5 Nanoparticle Contract Manufacturers: Information on Type of End User
- Table 4.6 Nanoparticle Contract Manufacturers: Information on Type of Service(s) Offered
- Table 4.7 Nanoparticle Contract Manufacturers: Information on Quality Certifications and Regulatory Bodies
- Table 6.1 Company Competitiveness Analysis: Benchmarking of Service Strength
- Table 6.2 Company Competitiveness Analysis: Benchmarking of Partnership Strength
- Table 6.3 Company Competitiveness Analysis: List of Very Small Players
- Table 6.3 Company Competitiveness Analysis: List of Small Players
- Table 6.3 Company Competitiveness Analysis: List of Mid-Sized Players
- Table 6.3 Company Competitiveness Analysis: List of Large Players
- Table 7.1 Nanoparticle Contract Manufacturers: List of Companies Profiled
- Table 7.2 Ardena: Company Snapshot
- Table 7.3 Ardena: Recent Developments and Future Outlook
- Table 7.4 CordenPharma: Company Snapshot
- Table 7.5 CordenPharma: Recent Developments and Future Outlook
- Table 7.6 Curia: Company Snapshot
- Table 7.7 Curia: Recent Developments and Future Outlook
- Table 7.8 Evonik: Company Snapshot
- Table 7.9 Evonik: Recent Developments and Future Outlook
- Table 7.10 LSNE Contract Manufacturing: Company Snapshot
- Table 7.11 LSNE Contract Manufacturing: Recent Developments and Future Outlook
- Table 7.12 Polymun: Company Snapshot
- Table 7.13 Polymun: Recent Developments and Future Outlook
- Table 7.14 TeachNanoIndia: Company Snapshot
- Table 8.1 Nanoparticle Contract Manufacturers: List of Collaborations, Since 2015
- Table 8.2 Nanoparticle Contract Manufacturers: Partnerships and Collaborations, Information on Type of Agreement (Region-wise and Geography-wise) and Designation of Stakeholder
- Table 12.1: LIPOSOMA: Company Snapshot
- Table 13.1 Nanoparticle Contract Manufactures: Cumulative Distribution by Year of Establishment
- Table 13.2 Nanoparticle Contract Manufactures: Distribution by Company Size
- Table 13.3 Nanoparticle Contract Manufactures: Distribution by Location of Headquarters
- Table 13.4 Nanoparticle Contract Manufactures: Distribution by Company Size and Location of Headquarters
- Table 13.5 Nanoparticle Contract Manufactures: Distribution by Type of Organization
- Table 13.6 Nanoparticle Contract Manufactures: Distribution by Type of Nanoparticle(s) Manufactured
- Table 13.7 Nanoparticle Contract Manufactures: Distribution by Location of Headquarters and Type of Nanoparticle(s) Manufactured
- Table 13.8 Nanoparticle Contract Manufactures: Distribution by Type of Organization and Type of Nanoparticle(s) Manufactured
- Table 13.9 Nanoparticle Contract Manufactures: Distribution by Location of Manufacturing Facility
- Table 13.10 Nanoparticle Contract Manufactures: Distribution by Location of Manufacturing Facility (Country-wise)
- Table 13.11 Nanoparticle Contract Manufactures: Distribution by Scale of Operation
- Table 13.12 Nanoparticle Contract Manufactures: Distribution by Type of Organization and Scale of Operation
- Table 13.13 Nanoparticle Contract Manufactures: Distribution by Type of Nanoparticle(s) Manufactured and Scale of Operation
- Table 13.14 Nanoparticle Contract Manufactures: Distribution by Type of End User
- Table 13.15 Nanoparticle Contract Manufactures: Distribution by Type of Nanoparticle(s) Manufactured and Type of End User
- Table 13.16 Nanoparticle Contract Manufactures: Distribution by Type of Service(s) Offered
- Table 13.17 Nanoparticle Contract Manufactures: Distribution by Type of Organization and Type of End User
- Table 13.18 Nanoparticle Contract Manufactures: Distribution by Type of Nanoparticle(s) Manufactured and Type of Service(s) Offered
- Table 13.19 Nanoparticle Contract Manufactures: Distribution by Quality Certifications
- Table 13.20 Nanoparticle Contract Manufactures: Distribution by Regulatory Bodies
- Table 13.21 Leading Nanoparticle Contract Manufacturers: Distribution by Number of Manufacturing Facilities
- Table 13.22 Key Insights: Distribution by Company Size and Type of Organization
- Table 13.23 Key Insights: Distribution by Company Size and Type of Nanoparticle(s) Manufactured
- Table 13.24 Key Insights: Distribution by Company Size and Scale of Operation
- Table 13.25 Key Insights: Distribution by Location of Headquarters (Country-wise)
- Table 13.26 4D Bubble Representation: Distribution by Number of Manufacturing Facilities, Number of Services Offered, Company Size, and Type of Nanoparticle(s) Manufactured,
- Table 13.27 Grid Representation: Distribution by Type of Organization, Type of Nanoparticle(s) Manufactured, Scale of Operation, Type of End User, and Type of Service(s) Offered
- Table 13.28 Partnerships and Collaborations: Cumulative Year-wise Trend, Since 2015
- Table 13.29 Partnerships and Collaborations: Distribution by Type of Partnership
- Table 13.30 Partnerships and Collaborations: Cumulative Year-wise Trend by Type of Partnership
- Table 13.31 Partnerships and Collaborations: Distribution by Type of Partner
- Table 13.32 Partnerships and Collaborations: Year-wise Distribution by Type of Partner
- Table 13.33 Partnerships and Collaborations: Cumulative Distribution by Type of Partnership and Type of Partner
- Table 13.34 Partnerships and Collaborations: Type of Partner and Company Size
- Table 13.35 Partnerships and Collaborations: Distribution by Type of Partner, Company Size and Location of Headquarters
- Table 13.36 Partnerships and Collaborations: Distribution by Type of Nanoparticle(s) Manufactured
- Table 13.37 Partnerships and Collaborations: Distribution by Type of Partnership and Type of Nanoparticle(s) Manufactured
- Table 13.38 Partnerships and Collaborations: Partnerships and Collaborations: Distribution by Location of Partner and Type of Nanoparticle(s) Manufactured
- Table 13.39 Most Active Players: Distribution by Number of Partnerships
- Table 13.40 Partnerships and Collaborations: Region-wise Distribution
- Table 13.41 Partnerships and Collaborations: Country-wise Distribution
- Table 13.42 Partnerships and Collaborations: Concluding Remarks
- Table 13.43 Global Nanoparticle Contract Manufacturing Market, Conservative, Base and Optimistic Scenarios, Till 2035 (USD Million)
- Table 13.44 Nanoparticle Contract Manufacturing Market: Distribution by Company Size
- Table 13.45 Nanoparticle Contract Manufacturing Market for Very Small Companies, Conservative, Base and Optimistic Scenarios, Till 2035 (USD Million)
- Table 13.46 Nanoparticle Contract Manufacturing Market for Small Companies, Conservative, Base and Optimistic Scenarios, Till 2035 (USD Million)
- Table 13.47 Nanoparticle Contract Manufacturing Market for Mid-Sized Companies, Conservative, Base and Optimistic Scenarios, Till 2035 (USD Million)
- Table 13.48 Nanoparticle Contract Manufacturing Market for Large Companies, Conservative, Base and Optimistic Scenarios, Till 2035 (USD Million)
- Table 13.49 Nanoparticle Contract Manufacturing Market: Distribution by Type of Nanoparticle(s) Manufactured
- Table 13.50 Nanoparticle Contract Manufacturing Market for Lipid Nanoparticles, Conservative, Base and Optimistic Scenarios, Till 2035 (USD Million)
- Table 13.51 Nanoparticle Contract Manufacturing Market for Metal Nanoparticles, Conservative, Base and Optimistic Scenarios, Till 2035 (USD Million)
- Table 13.52 Nanoparticle Contract Manufacturing Market: Distribution by Scale of Operation
- Table 13.53 Nanoparticle Contract Manufacturing Market for Preclinical Scale Operations, Conservative, Base and Optimistic Scenarios, Till 2035 (USD Million)
- Table 13.54 Nanoparticle Contract Manufacturing Market for Clinical Scale Operations, Conservative, Base and Optimistic Scenarios, Till 2035 (USD Million)
- Table 13.55 Nanoparticle Contract Manufacturing Market for Commercial Scale Operations, Conservative, Base and Optimistic Scenarios, Till 2035 (USD Million)
- Table 13.56 Nanoparticle Contract Manufacturing Market: Distribution by Type of End User
- Table 13.57 Nanoparticle Contract Manufacturing Market for Educational Institutions, Conservative, Base and Optimistic Scenarios, Till 2035 (USD Million)
- Table 13.58 Nanoparticle Contract Manufacturing Market for Pharmaceutical Companies, Conservative, Base and Optimistic Scenarios, Till 2035 (USD Million)
- Table 13.59 Nanoparticle Contract Manufacturing Market for Research Institutions, Conservative, Base and Optimistic Scenarios, Till 2035 (USD Million)
- Table 13.60 Nanoparticle Contract Manufacturing Market for Other End Users, Conservative, Base and Optimistic Scenarios, Till 2035 (USD Million)
- Table 13.61 Nanoparticle Contract Manufacturing Market: Distribution by Region
- Table 13.62 Nanoparticle Contract Manufacturing Market in North America, Conservative, Base and Optimistic Scenarios, Till 2035 (USD Million)
- Table 13.63 Nanoparticle Contract Manufacturing Market in Europe, Conservative, Base and Optimistic Scenarios, Till 2035 (USD Million)
- Table 13.64 Nanoparticle Contract Manufacturing Market in Asia, Conservative, Base and Optimistic Scenarios, Till 2035 (USD Million)
- Table 13.65 Nanoparticle Contract Manufacturing Market in MENA, Conservative, Base and Optimistic Scenarios, Till 2035 (USD Million)
- Table 13.66 Nanoparticle Contract Manufacturing Market in Latin America, Conservative, Base and Optimistic Scenarios, Till 2035 (USD Million)
- Table 13.67 Nanoparticle Contract Manufacturing Market in Rest of the World, Conservative, Base and Optimistic Scenarios, Till 2035 (USD Million)
- Table 13.68 Nanoparticle Contract Manufacturing Market: Distribution by Type of Nanoparticle(s) Manufactured and Region
- Table 13.69 Nanoparticle Contract Manufacturing Market for Lipid Nanoparticles in North America, Conservative, Base and Optimistic Scenarios, Till 2035 (USD Million)
- Table 13.70 Nanoparticle Contract Manufacturing Market for Lipid Nanoparticles in Europe, Conservative, Base and Optimistic Scenarios, Till 2035 (USD Million)
- Table 13.71 Nanoparticle Contract Manufacturing Market for Lipid Nanoparticles in Asia, Conservative, Base and Optimistic Scenarios, Till 2035 (USD Million)
- Table 13.72 Nanoparticle Contract Manufacturing Market for Lipid Nanoparticles in MENA, Conservative, Base and Optimistic Scenarios, Till 2035 (USD Million)
- Table 13.73 Nanoparticle Contract Manufacturing Market for Lipid Nanoparticles in Latin America, Conservative, Base and Optimistic Scenarios, Till 2035 (USD Million)
- Table 13.74 Nanoparticle Contract Manufacturing Market for Lipid Nanoparticles in Rest of the World, Conservative, Base and Optimistic Scenarios, Till 2035 (USD Million)
- Table 13.75 Nanoparticle Contract Manufacturing Market for Metal Nanoparticles in North America, Conservative, Base and Optimistic Scenarios, Till 2035 (USD Million)
- Table 13.76 Nanoparticle Contract Manufacturing Market for Metal Nanoparticles in Europe, Conservative, Base and Optimistic Scenarios, Till 2035 (USD Million)
- Table 13.77 Nanoparticle Contract Manufacturing Market for Metal Nanoparticles in Asia, Conservative, Base and Optimistic Scenarios, Till 2035 (USD Million)
- Table 13.78 Nanoparticle Contract Manufacturing Market for Metal Nanoparticles in MENA, Conservative, Base and Optimistic Scenarios, Till 2035 (USD Million)
- Table 13.79 Nanoparticle Contract Manufacturing Market for Metal Nanoparticles in Latin America, Conservative, Base and Optimistic Scenarios, Till 2035 (USD Million)
- Table 13.80 Nanoparticle Contract Manufacturing Market for Metal Nanoparticles in Rest of the World, Till 2035 (USD Million)
- Table 13.81 Nanoparticle Contract Manufacturing Market, Conservative, Base and Optimistic Scenarios (USD Million)
List of Figures
- Figure 2.1 Executive Summary: Market Landscape
- Figure 2.2 Executive Summary: Partnerships and Collaborations
- Figure 2.3 Executive Summary: Market Forecast
- Figure 3.1 Application of Nanoparticles in Healthcare
- Figure 3.2 Type of Nanoparticles: Based on Source of Material
- Figure 3.3 Challenges Associated with Manufacturing of Nanoparticles
- Figure 3.4 Type of the Third- Party Service Providers
- Figure 3.5 Commonly Outsourced Nanoparticle Manufacturing Operations
- Figure 4.1 Nanoparticle Contract Manufactures: Distribution by Year of Establishment
- Figure 4.2 Nanoparticle Contract Manufactures: Distribution by Company Size
- Figure 4.3 Nanoparticle Contract Manufactures: Distribution by Location of Headquarters
- Figure 4.4 Nanoparticle Contract Manufactures: Distribution by Company Size and Location of Headquarters
- Figure 4.5 Nanoparticle Contract Manufactures: Distribution by Type of Organization
- Figure 4.6 Nanoparticle Contract Manufactures: Distribution by Type of Nanoparticle(s) Manufactured
- Figure 4.7 Nanoparticle Contract Manufactures: Distribution by Location of Headquarters and Type of Nanoparticle(s) Manufactured
- Figure 4.8 Nanoparticle Contract Manufactures: Distribution by Type of Organization and Type of Nanoparticle(s) Manufactured
- Figure 4.9 Nanoparticle Contract Manufactures: Distribution by Location of Manufacturing Facility
- Figure 4.10 Nanoparticle Contract Manufactures: Distribution by Location of Manufacturing Facility (Country-wise)
- Figure 4.11 Nanoparticle Contract Manufactures: Distribution by Scale of Operation
- Figure 4.12 Nanoparticle Contract Manufactures: Distribution by Type of Organization and Scale of Operation
- Figure 4.13 Nanoparticle Contract Manufactures: Distribution by Type of Nanoparticle(s) Manufactured and Scale of Operation
- Figure 4.14 Nanoparticle Contract Manufactures: Distribution by Type of End User
- Figure 4.15 Nanoparticle Contract Manufactures: Distribution by Type of Nanoparticle(s) Manufactured and Type of End User
- Figure 4.16 Nanoparticle Contract Manufactures: Distribution by Type of Service(s) Offered
- Figure 4.17 Nanoparticle Contract Manufactures: Distribution by Type of Organization and Type of End User
- Figure 4.18 Nanoparticle Contract Manufactures: Distribution by Type of Nanoparticle(s) Manufactured and Type of Service(s) Offered
- Figure 4.19 Nanoparticle Contract Manufactures: Distribution by Quality Certifications
- Figure 4.20 Nanoparticle Contract Manufactures: Distribution by Regulatory Bodies
- Figure 4.21 Leading Nanoparticle Contract Manufacturers: Distribution by Number of Manufacturing Facilities
- Figure 5.1 Key Insights: Distribution by Company Size and Type of Organization
- Figure 5.2 Key Insights: Distribution by Company Size and Type of Nanoparticle(s) Manufactured
- Figure 5.3 Key Insights: Distribution by Company Size and Scale of Operation
- Figure 5.4 Key Insights: Distribution by Location of Headquarters (Country-wise)
- Figure 5.5 4D Bubble Representation: Distribution by Number of Manufacturing Facilities, Number of Service(s) Offered, Company Size, and Type of Nanoparticle(s) Manufactured
- Figure 5.6 Grid Representation: Distribution by Type of Organization, Type of Nanoparticle(s) Manufactured, Scale of Operation, Type of End User, and Type of Service(s) Offered
- Figure 6.1 Nanoparticle Contract Manufacturers: Benchmarking of Service Strength
- Figure 6.2 Nanoparticle Contract Manufacturers: Benchmarking of Partnership Activity
- Figure 6.3 Company Competitiveness Analysis: Very Small Companies
- Figure 6.4 Company Competitiveness Analysis: Small Companies
- Figure 6.5 Company Competitiveness Analysis: Mid-sized Companies
- Figure 6.6 Company Competitiveness Analysis: Large Companies
- Figure 8.1 Partnerships and Collaborations: Cumulative Year-wise Trend, Since 2015
- Figure 8.2 Partnerships and Collaborations: Distribution by Type of Partnership
- Figure 8.3 Partnerships and Collaborations: Year-wise Cumulative Distribution by Type of Partnership
- Figure 8.4 Partnerships and Collaborations: Distribution by Type of Partner
- Figure 8.5 Partnerships and Collaborations: Year-wise Distribution by Type of Partner
- Figure 8.6 Partnerships and Collaborations: Distribution by Type of Partnership and Type of Partner
- Figure 8.7 Partnerships and Collaborations: Distribution by Type of Partner and Company Size
- Figure 8.8 Partnerships and Collaborations: Distribution by Type of Partner, Company Size and Location of Headquarters
- Figure 8.9 Partnerships and Collaborations: Distribution by Type of Nanoparticle(s) Manufactured
- Figure 8.10 Partnerships and Collaborations: Distribution by Type of Partnership and Type of Nanoparticle(s) Manufactured
- Figure 8.11 Partnerships and Collaborations: Distribution by Location of Partner and Type of Nanoparticle(s) Manufactured
- Figure 8.12 Partnerships and Collaborations: Emerging Focus Area
- Figure 8.13 Most Active Players: Distribution by Number of Partnerships
- Figure 8.14 Partnerships and Collaboration: Region-wise Distribution
- Figure 8.15 Partnerships and Collaborations: Country-wise Distribution
- Figure 8.15 Partnerships and Collaboration: Concluding Remarks
- Figure 9.1 Outsourcing: Go / No-Go Framework
- Figure 9.2 Outsourcing: Go / No-Go Framework Methodology
- Figure 9.3 Outsourcing: Go / No-Go Framework for Nanoparticle-based Therapeutic Developers
- Figure 9.4 Nanoparticle-based Therapeutic Developers: Benchmarking of Very Small Companies
- Figure 9.5 Nanoparticle-based Therapeutic Developers: Benchmarking of Small Companies
- Figure 9.6 Nanoparticle-based Therapeutic Developers: Benchmarking of Mid-sized Companies
- Figure 9.7 Nanoparticle-based Therapeutic Developers: Benchmarking of Large Companies
- Figure 9.8 Nanoparticle-based Therapeutic Developers: Benchmarking of Very Large Companies
- Figure 10.1 Global Nanoparticle Contract Manufacturing Market, Till 2035 (USD Million)
- Figure 10.2 Nanoparticle Contract Manufacturing Market: Distribution by Company Size
- Figure 10.3 Nanoparticle Contract Manufacturing Market for Very Small Companies, Till 2035 (USD Million)
- Figure 10.4 Nanoparticle Contract Manufacturing Market for Small Companies, Till 2035 (USD Million)
- Figure 10.5 Nanoparticle Contract Manufacturing Market for Mid-Sized Companies, Till 2035 (USD Million)
- Figure 10.6 Nanoparticle Contract Manufacturing Market for Large Companies, Till 2035 (USD Million)
- Figure 10.7 Nanoparticle Contract Manufacturing Market: Distribution by Type of Nanoparticle(s) Manufactured
- Figure 10.8 Nanoparticle Contract Manufacturing Market for Lipid Nanoparticles, Till 2035 (USD Million)
- Figure 10.9 Nanoparticle Contract Manufacturing Market for Metal Nanoparticles, Till 2035 (USD Million)
- Figure 10.10 Nanoparticle Contract Manufacturing Market: Distribution by Scale of Operation,
- Figure 10.11 Nanoparticle Contract Manufacturing Market for Preclinical Scale Operations, Till 2035 (USD Million)
- Figure 10.12 Nanoparticle Contract Manufacturing Market for Clinical Scale Operations, Till 2035 (USD Million)
- Figure 10.13 Nanoparticle Contract Manufacturing Market for Commercial Scale Operations, Till 2035 (USD Million)
- Figure 10.14 Nanoparticle Contract Manufacturing Market: Distribution by Type of End User
- Figure 10.15 Nanoparticle Contract Manufacturing Market for Educational Institutions, Till 2035 (USD Million)
- Figure 10.16 Nanoparticle Contract Manufacturing Market for Pharmaceutical Companies, Till 2035 (USD Million)
- Figure 10.17 Nanoparticle Contract Manufacturing Market for Research Institutions, Till 2035 (USD Million)
- Figure 10.18 Nanoparticle Contract Manufacturing Market for Other End Users, Till 2035 (USD Million)
- Figure 10.19 Nanoparticle Contract Manufacturing Market: Distribution by Region
- Figure 10.20 Nanoparticle Contract Manufacturing Market in North America, Till 2035 (USD Million)
- Figure 10.21 Nanoparticle Contract Manufacturing Market in Europe, Till 2035 (USD Million)
- Figure 10.22 Nanoparticle Contract Manufacturing Market in Asia, Till 2035 (USD Million)
- Figure 10.23 Nanoparticle Contract Manufacturing Market in MENA, Till 2035 (USD Million)
- Figure 10.24 Nanoparticle Contract Manufacturing Market in Latin America, Till 2035 (USD Million)
- Figure 10.25 Nanoparticle Contract Manufacturing Market in Rest of the World, Till 2035 (USD Million)
- Figure 10.26 Nanoparticle Contract Manufacturing Market for Lipid Nanoparticles in North America, Till 2035 (USD Million)
- Figure 10.27 Nanoparticle Contract Manufacturing Market for Lipid Nanoparticles in Europe, Till 2035 (USD Million)
- Figure 10.28 Nanoparticle Contract Manufacturing Market for Lipid Nanoparticles in Asia, Till 2035 (USD Million)
- Figure 10.29 Nanoparticle Contract Manufacturing Market for Lipid Nanoparticles in MENA, Till 2035 (USD Million)
- Figure 10.30 Nanoparticle Contract Manufacturing Market for Lipid Nanoparticles in Latin America, Till 2035 (USD Million)
- Figure 10.31 Nanoparticle Contract Manufacturing Market for Lipid Nanoparticles in Rest of the World, Till 2035 (USD Million)
- Figure 10.32 Nanoparticle Contract Manufacturing Market for Metal Nanoparticles in North America, Till 2035 (USD Million)
- Figure 10.33 Nanoparticle Contract Manufacturing Market for Metal Nanoparticles in Europe, Till 2035 (USD Million)
- Figure 10.34 Nanoparticle Contract Manufacturing Market for Metal Nanoparticles in Asia, Till 2035 (USD Million)
- Figure 10.35 Nanoparticle Contract Manufacturing Market for Metal Nanoparticles in MENA, Till 2035 (USD Million)
- Figure 10.36 Nanoparticle Contract Manufacturing Market for Metal Nanoparticles in Latin America, Till 2035 (USD Million)
- Figure 10.37 Nanoparticle Contract Manufacturing Market for Metal Nanoparticles in Rest of the World, Till 2035 (USD Million)
- Figure 10.38 Nanoparticle Contract Manufacturing Market, Conservative, Base and Optimistic Scenarios(USD Million)
- Figure 11.1 Concluding Remarks: Current Market Landscape
- Figure 11.2 Concluding Remarks: Key Insights
- Figure 11.3 Concluding Remarks: Company Competitiveness Analysis: Small Companies
- Figure 11.4 Concluding Remarks: Partnerships and Collaborations
- Figure 11.5 Concluding Remarks: Outsourcing: Go / No-Go Framework
- Figure 11.6 Concluding Remarks: Market Sizing and Opportunity Analysis
- Figure 11.7 Concluding Remarks: Market Sizing and Opportunity Analysis
 脂质奈米颗粒市场:按原料、类型、製造方法、配方、粒径、功能、应用和终端用户产业划分-2026-2032年全球市场预测蛋黄来源磷脂酰胆碱市场:依应用、形态、磷脂酰胆碱含量及萃取方法划分-2026-2032年全球市场预测
 脂质奈米颗粒市场分析与预测(至2035年):按类型、产品类型、技术、应用、材料类型、製程、最终用户、功能、溶液划分脂质奈米颗粒製造市场分析与预测(至2035年):类型、产品、服务、技术、组件、应用、材料类型、製程、最终用户按剂型、包装、剂量强度、应用、最终用户和通路分類的蛋白结合型紫杉醇市场-2026-2032年全球预测氢化磷脂酰胆碱市场:依来源、形态、应用和最终用途产业划分,全球预测(2026-2032年)脂质奈米颗粒开发服务市场(按服务类型、给药途径、材料、应用和最终用户划分)—2026-2032年全球预测
 蛋黄来源磷脂酰胆碱市场规模、份额及成长分析(按类型、形态、应用、动物来源、纯度及地区划分)-2026-2033年产业预测
 脂质奈米颗粒市场机会、成长动力、产业趋势分析及 2025 - 2034 年预测
 脂质奈米颗粒市场规模、份额、趋势分析报告:按脂质奈米颗粒、分子、应用、适应症、最终用途、地区、细分市场、预测,2025-2030 年