


 |
市场调查报告书
商品编码
1883722
RNA定序服务市场:产业趋势及2035年全球预测-依定序方法、应用、终端用户产业及地区划分RNA Sequencing Service Market: Industry Trends and Global Forecasts, Till 2035 - Distribution by Type of Sequencing Method, Application Area, End User Industry and Key Geographical Regions |
||||||
RNA定序服务市场:市场概览
根据Roots Analysis预测,RNA定序服务市场规模预计将从今年的33亿美元成长至2035年的75亿美元,预测期内复合年增长率(CAGR)为8.4%。
RNA定序服务市场
市场规模和机会分析基于以下参数进行区隔:
定序方法类型
- 次世代定序方法
- 其他方法
应用领域
- 诊断
- 研究
终端用户产业
- 学术与研究
- 诊所与医院
- 製药业
- 其他
依地区划分
- 北美
- 欧洲
- 亚太地区
- 拉丁美洲
- 中东和北非
RNA定序服务市场:成长与趋势
RNA定序是RNA定序技术最早由弗雷德里克‧桑格于1977年提出。该技术利用链终止法,也称为桑格定序或第一代定序。它是一种快速技术,能够分析细胞产生的全部RNA谱,并具有更高的覆盖率和解析度。然而,与其他方法相比,桑格定序成本较高,且检测能力有限,因此可扩展性较差。随着时间的推移,RNA定序服务市场经历了多次技术进步,目前各种RNA定序方法已被用于基因和等位基因特异性表现差异分析、小RNA谱分析、可变剪接模式表征、系统生物学等领域。
在各种定序技术中,由Lynx Therapeutics公司于2000年开发的下一代定序(NGS)已成为业界广泛采用的选择。它是一种高通量、平行基因组定序技术,能够进行全基因组和全外显子定序,从而降低整体成本和处理时间。儘管RNA定序技术取得了许多进展,但仍存在一些挑战,包括大型基因定序的难度、人力资源短缺以及资料处理和分析工具的不足。此外,开发和维护基于下一代定序技术的设施需要大量投资。为了克服这些挑战并获得高品质的结果,业内人士认为,与其他方案相比,RNA定序外包是更优的选择。
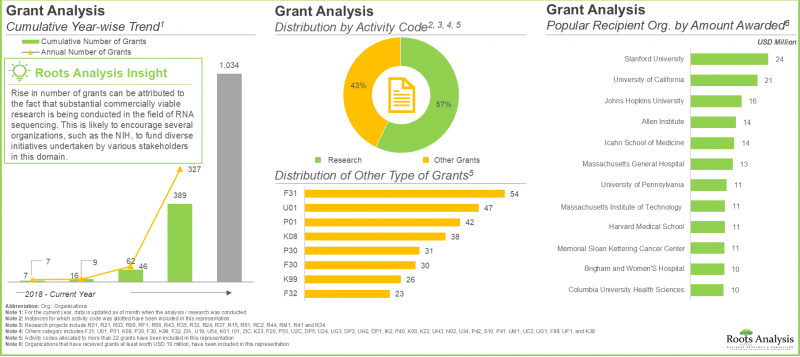
目前,已有超过70家公司提供RNA定序相关服务。其中,一些新创公司成立于过去十年。此外,各方正在开发专有技术,以应对测序过程中扩增和重复率相关的挑战。同时,近期已提交或註册了超过340项与RNA定序相关的专利,显示该领域的技术创新蓬勃发展。此外,美国国立卫生研究院(NIH)近期拨款4.86亿美元,用于促进RNA定序服务领域的研究与发展。在各利益相关方日益增长的兴趣以及该技术广泛应用的推动下,RNA测序服务市场预计在预测期内将实现显着增长。
RNA定序服务市场:关键洞察
本报告深入分析了RNA测序服务市场的现状,并指出了该行业潜在的成长机会。报告的主要发现包括:
1. 全球约有75家公司声称提供RNA定序服务。其中相当一部分是自2010年以来在美国成立的初创企业/中小企业。
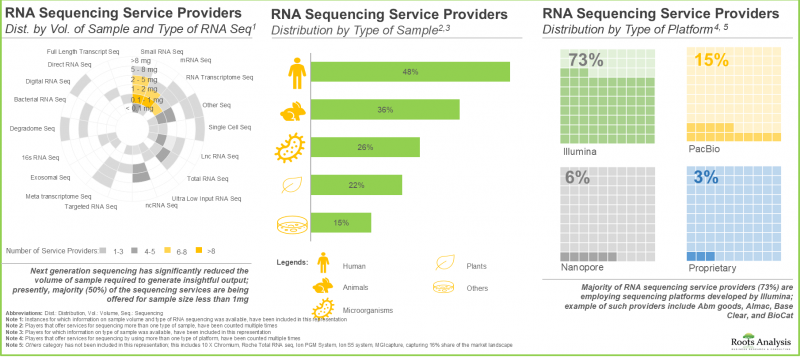
2.大多数服务提供者 (38%) 提供小 RNA 和 mRNA 定序服务。 Illumina 平台是目前应用最广泛的 RNA 样本定序平台。
3. 为了建构竞争优势,各利害关係人正致力于拓展服务范围并升级其先进的定序平台专用设备。
4. 为了保护该领域产生的智慧财产权,各利益相关者已申请并註册了 340 多项与 RNA 定序相关的专利。
5. 过去几年,各组织共获得了 10.34 亿美元的资助,用于支持正在进行的研究、开发和创新。
6.用于转录组分析的 RNA 定序已成为生命科学产业广泛应用的技术,为该领域带来了更多机会。
7. 预计週转时间短的定序平台将为 RNA 定序服务提供者带来更高的获利指标和更大的获利潜力。
8. 预计到 2035 年,RNA 定序服务市场将以每年 8.4% 的速度成长,市场机会广泛分布于各种技术、应用领域、终端用户和地区。
RNA定序服务市场:市场区隔
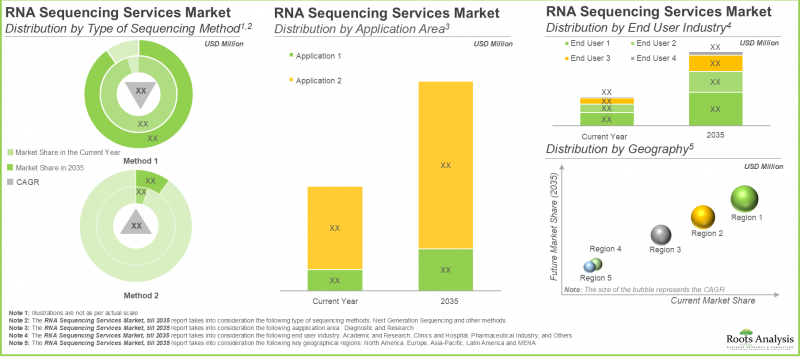
预计次世代定序服务市场将占RNA定序服务市场的大部分占有率。
依定序方法类型划分,下一代定序服务市场可分为下一代定序及其他方法。目前,下一代定序占了大部分市场占有率(约95%),预计这一趋势将在预测期内持续。
医院占了RNA定序服务市场的大部分占有率。
依最终用户类型划分,RNA定序服务市场可分为医院和诊所、製药和生物技术公司、学术和研究机构以及其他机构。目前,医院占了大部分市场占有率(约 45%),预计在预测期内,该区隔市场将以显着的复合年增长率增长。
预计北美将引领 RNA 定序服务市场。
依地理区域划分,RNA 定序服务市场分为北美、欧洲、亚太、拉丁美洲以及中东和北非 (MENA) 地区。北美目前占了大部分市场占有率 (37%),预计这一趋势将持续下去。
RNA定序服务市场领导者
- Admera Health
- Biogazelle(已被CellCarta收购)
- CD Genomics
- Creative Biogene
- IGA Technology
- LC Sciences
- Lexogen
- Novogene
- Otogenetics
- Yaazh Xenomic
目录
第一章:引言
第二章:摘要整理
第三章:导论
- 章节概述
- RNA定序概述
- RNA定序的关键步骤
- RNA的类型定序
- RNA定序方法
- RNA定序应用
- RNA定序的优势
- RNA定序的局限性
- RNA定序平台
- 结论
第四章:RNA定序服务提供者:市场概览
- 章节概述
第五章:竞争分析
- 章节概述
- 假设和关键参数
- 研究范围与方法
- 竞争分析:北美RNA定序服务供应商
- 竞争分析:欧洲RNA定序服务供应商
- 竞争分析:亚太及其他地区RNA定序服务供应商
第六章:公司简介
- 章节概述
- Admera Health
- Biogazelle(已被 CellCarta 收购)
- CD Genomics
- Creative Biogene
- IGA Technology
- LC Sciences
- Lexogen
- Novogene
- Otogenetics
- Yaazh Xenomic
第七章:学术资助分析
- 章节概述
- 研究范围与方法
- 资助年度分析
第八章:专利分析
- 章节概述
- 研究范围与方法
- RNA定序:专利分析
- RNA定序:专利基准分析
- RNA定序:专利价值分析
- 关键专利:引用分析
第九章:波特五力分析
第十章:案例研究:NGS文库製备试剂盒
- 章节概述
- NGS文库製备试剂盒:市场概况
- NGS文库製备试剂盒:开发商概况
第十一章:投资潜力分析
- 章节概述
- 研究范围与方法
- 常用RNA定序平台的报酬潜力
- 投资报酬率评估矩阵
- 结论
第十二章:市场规模与机会分析
- 章节概述
- 预测研究方法及关键假设
- 全球RNA定序服务市场(至2035年)
- RNA定序服务市场(至2035年):依定序方法划分
- RNA定序服务市场(至2035年):依应用领域划分
- RNA定序服务市场(至2035年):依终端用户产业划分
- RNA定序服务市场(至2035年):依主要地区划分
第十三章:高阶主管洞察
第十四章:附录1:表格资料
第十五章:附录2:公司及机构列表
RNA SEQUENCING SERVICE MARKET: OVERVIEW
As per Roots Analysis, the RNA sequencing service market is USD is projected to grow from USD 3.3 billion in the current year and is expected to reach USD 7.5 billion by 2035, representing a CAGR of 8.4% during the forecast period.
RNA Sequencing Service Market
The market sizing and opportunity analysis has been segmented across the following parameters:
Type of Sequencing Method
- Next Generation Sequencing Method
- Other Methods
Application Area
- Diagnostic
- Research
End User Industry
- Academic and Research
- Clinics and Hospital
- Pharmaceutical Industry
- Others
Geographical Regions
- North America
- Europe
- Asia-Pacific
- Latin America
- Middle East and North Africa
RNA SEQUENCING SERVICES MARKET: GROWTH AND TRENDS
RNA sequencing was initially presented by Fredrick Sanger in 1977, utilizing the chain termination technique, also referred to as the Sanger sequencing method or first-generation sequencing method. It is a rapid technique that allows for the profiling of the complete spectrum of RNA produced by the cell, with enhanced coverage and resolution. Although, the Sanger sequencing technique is more expensive than alternative methods and has limited detection capability, which diminishes its scalability. With time, the RNA sequencing service market has undergone numerous technological advancements, and various RNA sequencing methods are currently employed for differential gene and allele-specific expression, small RNA profiling, characterization of alternative splicing patterns, and systems biology.
Among different sequencing techniques, next generation sequencing (NGS) launched by Lynx Therapeutics in 2000, has become a favored option throughout the industry. It is a parallel genome sequencing technology with high throughput that allows for whole genome and whole exome sequencing. It allows for a decrease in total cost and processing duration. Even with numerous technological progressions in RNA sequencing, there are several persistent issues, such as challenges in sequencing large genes, a scarcity of human resources, and insufficient tools for data manipulation and analysis. Moreover, the development and maintenance of facilities based on next generation sequencing demand significant investment. To address these challenges and achieve a high-quality result, industry players view the outsourcing of RNA sequencing as a more favorable choice compared to other options.
At present, over 70 firms provide services associated with RNA sequencing. Several of these firms are new ventures that were founded in the last ten years. Moreover, various stakeholders are involved in developing their proprietary technologies to address the issues associated with amplification and duplication rates during sequencing. Additionally, more than 340 patents concerning RNA sequencing have been recently issued or filed, showcasing the innovation. Further, in recent years, the National Institutes of Health have awarded grants worth USD 486 million to bolster the ongoing R&D initiatives in the RNA sequencing service sector. Fueled by the increasing interest from diverse stakeholders and the broad applicability of this technique, we expect that the RNA sequencing services sector will experience significant market growth in the forecast period.
RNA SEQUENCING SERVICE MARKET: KEY INSIGHTS
The report delves into the current state of the RNA sequencing service market and identifies potential growth opportunities within industry. Some key findings from the report include:
1. Close to 75 players, across the globe, claim to offer services for RNA sequencing; a relatively larger proportion of these players are start ups / small companies, established in the US post 2010.
2. Majority of the service providers (38%) offer services for sequencing of small RNA and mRNA; Illumina is the most widely employed platform for sequencing different RNA samples.
3. In pursuit of building a competitive edge, stakeholders are striving to enhance their service portfolio and upgrade their facilities with advanced sequencing platforms.
4. More than 340 patents related to RNA sequencing have been filed / granted by various stakeholders in order to protect the intellectual property generated within this field.
5. Over the past few years, grants worth USD 1,034 million have been awarded to various organizations in order to support the ongoing research and innovation efforts.
6. RNA sequencing for transcriptome profiling has become a widely used technique in life sciences industry, leading to an increase in opportunities within this domain.
7. Sequencing platforms with less turnaround time are likely to have high profitability index and offer more profit potential to the companies offering RNA sequencing services.
8. The RNA sequencing services market is expected to grow at a rate of 8.4%, till 2035; the market opportunity is likely to be well distributed across different methods, applications, end-users and geographies.
RNA SEQUENCING SERVICE MARKET: MARKET SEGMENTS
Next Generation Sequencing Service Market is Likely to Capture the Majority of the RNA Sequencing Service Market
In terms of type of sequencing method, the next generation sequencing service market is segmented across next generation sequencing methods and other methods. Currently, majority of the market share is captured by next generation sequencing methods constituting nearly 95% of the market and the trend is likely to remain the same during the forecast period.
Majority of the RNA Sequencing Service Market Share is Captured by Hospitals
In terms of type of end user, the RNA sequencing services market is segmented across hospitals and clinics, pharmaceutical and biotechnology companies, academic and research institutes and others. Currently, majority of the market share is captured by hospitals constituting around 45% of the market share. The segment is likely to grow at a notable CAGR during the period.
North America is Likely to Dominate the RNA Sequencing Service Market
In terms of type of geographical regions, the RNA sequencing services market is segmented across North America, Europe, Asia-Pacific, Latin America and MENA. Currently, majority (37%) of the market share is captured by North America and the trend is unlikely to change in the future.
Example Players in the RNA Sequencing Services Market
- Admera Health
- Biogazelle (acquired by CellCarta)
- CD Genomics
- Creative Biogene
- IGA Technology
- LC Sciences
- Lexogen
- Novogene
- Otogenetics
- Yaazh Xenomic
RNA SEQUENCING SERVICES MARKET: RESEARCH COVERAGE
- Market Sizing and Opportunity Analysis: The report features an in-depth analysis of the RNA sequencing services market, focusing on key market segments, including [A] type of sequencing method, [B] application area, [C] end user industry, and [D] key geographical regions.
- Market Landscape: A detailed analysis of the overall market landscape of RNA sequencing service providers based on several relevant parameters, such as [A] year of establishment, [A] company size, [B] location of headquarters, [C] type of RNA sequencing service(s), type of platform, [D] turnaround time, [E] type of sample and [F] volume of sample.
- Company Competitiveness Analysis: A comprehensive competitive analysis of RNA sequencing service providers, examining factors, such as [A] company strength and [B] service portfolio strength.
- Company Profiles: In-depth profiles of prominent players offering providing services for RNA sequencing, headquartered in North America, Europe and Asia-Pacific focusing on [A] year of establishment, [B] location of headquarters, [C] product portfolio, [D] recent developments and [E] an informed future outlook.
- Grants Analysis: A detailed analysis of grants awarded to various research institutes for projects related to RNA sequencing, based on several relevant parameters, such as [A] year of grant awarded, [B] amount awarded, [C] administering institute center, [D] support period, [E] type of grant application, [F] purpose of grant, [G] activity code, [H] study section, [I] type of organization, [J] emerging focus areas, [K] popular NIH departments, [L] popular recipient organizations (in terms of number of grants and amount awarded), [M] prominent program officers and [N] location of recipient organizations.
- Patent Analysis: An insightful analysis of patents filed / granted for RNA sequencing, since 2018, taking into consideration various relevant parameters, such as [A] type of patent, [B] publication year, [C] application year, [D] geographical location, [E] CPC symbols, [F] emerging focus areas, [G] type of applicant, [H] leading players and [I] individual assignees (in terms of number of patents granted / filed in the given time period).
- Porter's Five Forces Analysis: A qualitative analysis of the five competitive forces, including [A] threats of new entrants, [B] bargaining power of customers, [C] bargaining power of RNA sequencing service providers, [D] threats of substitute services and [E] rivalry among existing competitors under an insightful Porter's Five Forces framework.
KEY QUESTIONS ANSWERED IN THIS REPORT
- How many companies are currently engaged in this market?
- Which are the leading companies in this market?
- What factors are likely to influence the evolution of this market?
- What is the current and future market size?
- What is the CAGR of this market?
- How is the current and future market opportunity likely to be distributed across key market segments?
REASONS TO BUY THIS REPORT
- The report provides a comprehensive market analysis, offering detailed revenue projections of the overall market and its specific sub-segments. This information is valuable to both established market leaders and emerging entrants.
- Stakeholders can leverage the report to gain a deeper understanding of the competitive dynamics within the market. By analyzing the competitive landscape, businesses can make informed decisions to optimize their market positioning and develop effective go-to-market strategies.
- The report offers stakeholders a comprehensive overview of the market, including key drivers, barriers, opportunities, and challenges. This information empowers stakeholders to stay abreast of market trends and make data-driven decisions to capitalize on growth prospects.
ADDITIONAL BENEFITS
- Complimentary PPT Insights Packs
- Complimentary Excel Data Packs for all Analytical Modules in the Report
- 15% Free Content Customization
- Detailed Report Walkthrough Session with Research Team
- Free Updated report if the report is 6-12 months old or older
TABLE OF CONTENTS
1. PREFACE
- 1.1. Scope of the Report
- 1.2. Market Segmentation
- 1.3. Research Methodology
- 1.4 Key Questions Answered
- 1.5. Chapter Outlines
2. EXECUTIVE SUMMARY
3. INTRODUCTION
- 3.1. Chapter Overview
- 3.2. An Overview of RNA Sequencing
- 3.2.1. Key Steps Involved in RNA Sequencing
- 3.2.2. Types of RNA Sequencing
- 3.2.2.1. Single End Sequencing
- 3.2.2.2. Paired End Sequencing
- 3.2.3. Methods of RNA Sequencing
- 3.2.3.1. First Generation Sequencing
- 3.2.3.2. Next Generation Sequencing
- 3.2.3.3. Third Generation Sequencing
- 3.2.4. Applications of RNA Sequencing
- 3.2.5. Advantages of RNA Sequencing
- 3.2.6. Limitations of RNA Sequencing
- 3.2.7. RNA Sequencing Platforms
- 3.2.7.1. Illumina Sequencing Platforms
- 3.2.7.2. Pac Bio Sequencing Platforms
- 3.2.7.3. Nanopore Sequencing Platforms
- 3.3. Concluding Remarks
4. RNA SEQUENCING SERVICE PROVIDERS: MARKET OVERVIEW
- 4.1. Chapter Overview
- 4.1.1. RNA Sequencing Service Providers
- 4.1.2. Analysis by Year of Establishment
- 4.1.3. Analysis by Company Size
- 4.1.4. Analysis by Location of Headquarters
- 4.1.5. Analysis by Company Size and Region of Headquarters
- 4.1.6. Analysis by Type of RNA Sequencing Service(s)
- 4.1.7. Analysis by Type of Platform
- 4.1.8. Analysis by Turnaround Time
- 4.1.9. Analysis by Type of Sample
- 4.1.10. Analysis by Amount of Sample
5. COMPANY COMPETITIVENESS ANALYSIS
- 5.1. Chapter Overview
- 5.2. Assumptions and Key Parameters
- 5.3. Scope and Methodology
- 5.4. Company Competitiveness Analysis: RNA Sequencing Service Providers in North America
- 5.5. Company Competitiveness Analysis: RNA Sequencing Service Providers in Europe
- 5.6. Company Competitiveness Analysis: RNA Sequencing Service Providers in Asia-Pacific and Rest of the World
6. COMPANY PROFILES
- 6.1. Chapter Overview
- 6.2. Admera Health
- 6.2.1. Company Overview
- 6.2.2. RNA Sequencing Service Portfolio
- 6.2.3. Recent Developments and Future Outlook
- 6.3. Biogazelle (acquired by CellCarta)
- 6.3.1. Company Overview
- 6.3.2. RNA Sequencing Service Portfolio
- 6.3.3. Recent Developments and Future Outlook
- 6.4. CD Genomics
- 6.4.1. Company Overview
- 6.4.2. RNA Sequencing Service Portfolio
- 6.4.3. Recent Developments and Future Outlook
- 6.5. Creative Biogene
- 6.5.1. Company Overview
- 6.5.2. RNA Sequencing Service Portfolio
- 6.5.3. Recent Developments and Future Outlook
- 6.6. IGA Technology
- 6.6.1. Company Overview
- 6.6.2. RNA Sequencing Service Portfolio
- 6.6.3. Recent Developments and Future Outlook
- 6.7. LC Sciences
- 6.7.1. Company Overview
- 6.7.2. RNA Sequencing Service Portfolio
- 6.7.3. Recent Developments and Future Outlook
- 6.8. Lexogen
- 6.8.1. Company Overview
- 6.8.2. RNA Sequencing Service Portfolio
- 6.8.3. Recent Developments and Future Outlook
- 6.9. Novogene
- 6.9.1. Company Overview
- 6.9.2. RNA Sequencing Service Portfolio
- 6.9.3. Recent Developments and Future Outlook
- 6.10. Otogenetics
- 6.10.1. Company Overview
- 6.10.2. RNA Sequencing Service Portfolio
- 6.10.3. Recent Developments and Future Outlook
- 6.11. Yaazh Xenomic
- 6.11.1. Company Overview
- 6.11.2. RNA Sequencing Service Portfolio
- 6.11.3. Recent Developments and Future Outlook
7. ACADEMIC GRANT ANALYSIS
- 7.1. Chapter Overview
- 7.2. Scope and Methodology
- 7.3. Analysis by Year of Grant Award
- 7.3.1. Analysis by Amount Awarded
- 7.3.2. Analysis by Administering Institute Centre
- 7.3.3. Analysis by Support Period
- 7.3.4. Analysis by Administering Institute Centre and Support Period
- 7.3.5. Analysis by Type of Grant Application
- 7.3.6. Analysis by Purpose of Grant
- 7.3.7. Analysis by Purpose of Grant and Amount Awarded
- 7.3.8. Analysis by Activity Code
- 7.3.9. Analysis by Study Section Involved
- 7.3.10. Analysis by Type of Organization
- 7.3.11. Word Cloud: Emerging Focus Areas
- 7.3.12. Most Popular Departments: Analysis by Number of Grants
- 7.3.13. Prominent Program Officers: Analysis by Number of Grants
- 7.3.14. Popular Recipient Organizations: Analysis by Number of Grants
- 7.3.15. Popular Recipient Organizations: Analysis by Amount Awarded
- 7.3.16. Analysis of Recipient Organizations located in the US
8. PATENT ANALYSIS
- 8.1. Chapter Overview
- 8.2. Scope and Methodology
- 8.3. RNA Sequencing: Patent Analysis
- 8.3.1. Analysis by Publication Year
- 8.3.2. Analysis by Application Year
- 8.3.3. Analysis by Annual Number of Granted Patents and Patent Applications
- 8.3.4. Analysis by Geography
- 8.3.5. Analysis by CPC Symbols
- 8.3.6. Analysis by Focus Area
- 8.3.7. Analysis by Type of Applicant
- 8.3.8. Leading Players: Analysis by Number of Patents
- 8.3.9. Leading Individual Assignees: Analysis by Number of Patents
- 8.4. RNA Sequencing: Patent Benchmarking Analysis
- 8.4.1. Analysis by Patent Characteristics
- 8.5. RNA sequencing: Patent Valuation Analysis
- 8.6. Leading Patents: Analysis by Number of Citations
9. PORTER'S FIVE FORCES ANALYSIS
- 9.1. Chapter Overview
- 9.2. Methodology and Assumptions
- 9.3. Key Parameters
- 9.3.1. Threats of New Entrants
- 9.3.2. Power of Customers
- 9.3.3. Power of RNA Sequencing Service Providers
- 9.3.4. Threats of Substitute Services
- 9.3.5. Rivalry Among Existing Competitors
- 9.4. Concluding Remarks
10. CASE STUDY: NGS LIBRARY PREPARATION KITS
- 10.1. Chapter Overview
- 10.2. NGS Library Preparation Kits: Overall Market Landscape
- 10.2.1. Analysis by Type of Platform
- 10.2.2. Analysis by Amount of Sample
- 10.2.3. Analysis by Turnaround Time
- 10.2.4. Analysis by Storage Temperature
- 10.2.5. Analysis by Type of Sequencing
- 10.2.6. Analysis by Kit Components
- 10.2.7. Analysis by Type of Sample
- 10.3. NGS Library Preparation Kits: Developer Landscape
- 10.3.1. Analysis by Year of Establishment
- 10.3.2. Analysis by Company Size
- 10.3.3. Analysis by Region of Headquarters
11. INVESTMENT POTENTIAL ANALYSIS
- 11.1. Chapter Overview
- 11.2. Scope and Methodology
- 11.3. Profit Potential of Commonly used RNA Sequencing Platforms
- 11.2.1. iSeq: Likely Profit Potential
- 11.2.2. MiSeq: Likely Profit Potential
- 11.2.3. NextSeq 550 Series: Likely Profit Potential
- 11.2.4. NextSeq 1000: Likely Profit Potential
- 11.2.5. NextSeq 1000: Likely Profit Potential
- 11.2.6. Sequel: Likely Profit Potential
- 11.2.7. Sequel II: Likely Profit Potential
- 11.2.8. Sequel IIe: Likely Profit Potential
- 11.4. Payback Evaluation Matrix
- 11.3. Conclusion
12. MARKET SIZING AND OPPORTUNITY ANALYSIS
- 12.1. Chapter Overview
- 12.2. Forecast Methodology and Key Assumptions
- 12.3. Global RNA Sequencing Services Market, Till 2035
- 12.3.1. RNA Sequencing Services Market, Till 2035: Distribution by Type of Sequencing Method
- 12.3.1.1. RNA Sequencing Services Market for Next Generation Sequencing Methods, Till 2035
- 12.3.1.2. RNA Sequencing Services Market for Other Methods, Till 2035
- 12.3.2. RNA Sequencing Services Market, Till 2035: Distribution by Type of Application Area
- 12.3.2.1. RNA Sequencing Services Market for Research Purposes, Till 2035
- 12.3.2.2. RNA Sequencing Services Market for Diagnostic Purposes, Till 2035
- 12.3.3. RNA Sequencing Services Market, Till 2035: Distribution by Type of End User Industry
- 12.3.3.1. RNA Sequencing Services Market for Academic and Research Industry, Till 2035
- 12.3.3.2. RNA Sequencing Services Market for Clinics and Hospitals, Till 2035
- 12.3.3.3. RNA Sequencing Services Market for Pharmaceutical Industry, Till 2035
- 12.3.3.4. RNA Sequencing Services Market for Other Users, Till 2035
- 12.3.4. RNA Sequencing Services Market, Till 2035: Distribution by Key Geographical Regions
- 12.3.4.1. RNA Sequencing Services Market in North America, Till 2035
- 12.3.4.2. RNA Sequencing Services Market in Europe, Till 2035
- 12.3.4.3. RNA Sequencing Services Market in Asia-Pacific, Till 2035
- 12.3.4.4. RNA Sequencing Services Market in Latin America, Till 2035
- 12.3.4.5. RNA Sequencing Services Market in Middle East and North Africa, Till 2035
- 12.3.1. RNA Sequencing Services Market, Till 2035: Distribution by Type of Sequencing Method
13. EXECUTIVE INSIGHTS
14. APPENDIX 1: TABULATED DATA
15. APPENDIX 2: LIST OF COMPANIES AND ORGANIZATIONS
List of Tables
- Table 4.1 List of RNA Sequencing Service Providers
- Table 4.2 RNA Sequencing Service Providers: Information on Type of RNA Sequencing Service(s), Type of Platform, and Turnaround time
- Table 4.3 RNA Sequencing Service Providers: Information on Type of RNA Sequencing Service(s), Type of Sample, and Amount of Sample
- Table 6.1 Admera Health: Company Overview
- Table 6.2 Admera Health: RNA Sequencing Service Portfolio
- Table 6.3 Biogazelle: Company Overview
- Table 6.4 Biogazelle: RNA Sequencing Service Portfolio
- Table 6.5 CD Genomics: Company Overview
- Table 6.6 CD Genomics: RNA Sequencing Service Portfolio
- Table 6.7 Creative Biogene: Company Overview
- Table 6.8 Creative Biogene: RNA Sequencing Service Portfolio
- Table 6.9 IGA Technology: Company Overview
- Table 6.10 IGA Technology: RNA Sequencing Service Portfolio
- Table 6.11 LC Sciences: Company Overview
- Table 6.12 LC Sciences: RNA Sequencing Service Portfolio
- Table 6.13 Lexogen: Company Overview
- Table 6.14 Lexogen: RNA Sequencing Service Portfolio
- Table 6.15 Lexogen: Recent Developments and Future Outlook
- Table 6.16 Novogene: Company Overview
- Table 6.17 Novogene: RNA Sequencing Service Portfolio
- Table 6.18 Novogene: Recent Developments and Future Outlook
- Table 6.19 Otogenetics: Company Overview
- Table 6.20 Otogenetics: RNA Sequencing Service Portfolio
- Table 6.21 Yaazh Xenomic: Company Overview
- Table 6.22 Yaazh Xenomics: RNA Sequencing Service Portfolio
- Table 8.1 Patent Analysis: Most Popular CPC Symbols
- Table 8.2 Patent Analysis: List of Top CPC Symbols
- Table 8.3 Patent Analysis: Summary of Benchmarking Analysis
- Table 8.4 Patent Analysis: Categorization based on Weighted Valuation Scores
- Table 8.5 Patent Portfolio: List of Leading Patents (by Highest Relative Valuation)
- Table 8.6 Patent Portfolio: List of Leading Patents (by Number of Citations)
- Table 11.1 Investment Analysis and Likely Profit Potential: Cost Consideration
- Table 11.2 Investment Analysis and Likely Profit Potential: Revenue Consideration
- Table 11.3 Investment Analysis and Likely Profit Potential: Minimum Sales Required for iSeq 100
- Table 11.4 Investment Analysis and Likely Profit Potential: Minimum Sales Required for MiSeq
- Table 11.5 Investment Analysis and Likely Profit Potential: Minimum Sales Required for NextSeq 550
- Table 11.6 Investment Analysis and Likely Profit Potential: Minimum Sales Required for NextSeq 1000
- Table 11.7 Investment Analysis and Likely Profit Potential: Minimum Sales Required for NextSeq 2000
- Table 11.8 Investment Analysis and Likely Profit Potential: Minimum Sales Required for Sequel
- Table 11.9 Investment Analysis and Likely Profit Potential: Minimum Sales Required for Sequel II
- Table 11.10 Investment Analysis and Likely Profit Potential: Minimum Sales Required for Sequel IIe
- Table 11.11 Investment Analysis and Likely Profit Potential: Payback Evaluation Matrix
- Table 15.1 RNA Sequencing Service Providers: Distribution by Year of Establishment
- Table 15.2 RNA Sequencing Service Providers: Distribution by Company Size
- Table 15.3 RNA Sequencing Service Providers: Distribution by Location of Headquarters (Region-wise)
- Table 15.4 RNA Sequencing Service Providers: Distribution by Location of Headquarters (Country-wise)
- Table 15.5 RNA Sequencing Service Providers: Distribution by Company Size and Region of Headquarters
- Table 15.6 RNA Sequencing Service Providers: Distribution by Type of RNA Sequencing Service(s)
- Table 15.7 RNA Sequencing Service Providers: Distribution by Turnaround Time
- Table 15.8 RNA Sequencing Service Providers: Distribution by Type of Sample
- Table 15.9 RNA Sequencing Service Providers: Distribution by Amount of Sample (in mg)
- Table 15.10 Grant Analysis: Cumulative Year-Wise Trend, 2018-2022
- Table 15.11 Grant Analysis: Distribution by Amount Awarded (USD Million)
- Table 15.12 Grant Analysis: Distribution by Administering Institute Centre
- Table 15.13 Grant Analysis: Distribution by Support Period
- Table 15.14 Grant Analysis: Distribution by Type of Grant Application
- Table 15.15 Grant Analysis: Distribution of Amount Awarded by Purpose of Grant Award (USD Million)
- Table 15.16 Grant Analysis: Distribution by Purpose of Grant Award
- Table 15.17 Grant Analysis: Distribution by Activity Code
- Table 15.18 Grant Analysis: Distribution by Study Section Involved
- Table 15.19 Grant Analysis: Distribution by Type of Organization
- Table 15.20 Most Popular Departments: Distribution by Number of Grants
- Table 15.21 Prominent Program Officers: Distribution by Number of Grants
- Table 15.22 Popular Recipient Organizations: Distribution by Number of Grants
- Table 15.23 Popular Recipient Organizations: Distribution by Amount of Grant
- Table 15.24 Grant Analysis: Distribution of Recipient Organizations located in US
- Table 15.25 Patent Analysis: Distribution by Type of Patent
- Table 15.26 Patent Analysis: Cumulative Distribution by Publication Year, 2018-2022
- Table 15.27 Patent Analysis: Cumulative Distribution by Application Year, Pre-2016 - 2022
- Table 15.28 Patent Analysis: Cumulative Distribution by Annual Number of Granted Patents and Patents Applications, 2018-2022
- Table 15.29 Patent Analysis: Distribution by Geography
- Table 15.30 Patent Analysis: Cumulative Year-wise Distribution by Type of Applicant
- Table 15.31 Leading Industry Players: Distribution by Number of Patents
- Table 15.32 Leading Non-Industry Players: Distribution by Number of Patents
- Table 15.33 Patent Analysis: Leading Individual Assignees
- Table 15.34 Patent Analysis: Categorization based on Weighted Valuation Scores
- Table 15.35 NGS Library Preparation Kits: Distribution by Type of Platform
- Table 15.36 NGS Library Preparation Kits: Distribution by Amount of Sample
- Table 15.37 NGS Library Preparation Kits: Distribution by Turnaround Time
- Table 15.38 NGS Library Preparation Kits: Distribution by Storage Temperature
- Table 15.39 NGS Library Preparation Kits: Distribution by Type of Sequencing
- Table 15.40 NGS Library Preparation Kits: Distribution by Kit Components
- Table 15.41 NGS Library Preparation Kits: Distribution by Type of Sample
- Table 15.42 NGS Library Preparation Kits Providers: Distribution by Year of Establishment
- Table 15.43 NGS Library Preparation Kits Providers: Distribution by Company Size
- Table 15.44 NGS Library Preparation Kits Providers: Distribution by Location of Headquarters
- Table 15.45 Likely Profit Potential of iSeq platform
- Table 15.46 Likely Profit Potential of MiSeq platform
- Table 15.47 Likely Profit Potential of NextSeq 550 Series platform
- Table 15.48 Likely Profit Potential of NextSeq 1000 platform
- Table 15.49 Likely Profit Potential of NextSeq 2000 platform
- Table 15.50 Likely Profit Potential of Sequel platform
- Table 15.51 Likely Profit Potential of Sequel II platform
- Table 15.52 Likely Profit Potential of Sequel IIe platform
- Table 15.53 Global RNA Sequencing Services Market, Conservative, Base, and Optimistic Scenarios, Till 2035 (USD Billion)
- Table 15.54 RNA Sequencing Services Market, 2022 and 2035: Distribution by Type of Sequencing Method
- Table 15.55 RNA Sequencing Services Market for Next Generation Sequencing Method, Conservative, Base, and Optimistic Scenarios, Till 2035 (USD Billion)
- Table 15.56 RNA Sequencing Services Market for Other Methods, Conservative, Base, and Optimistic Scenarios, Till 2035 (USD Billion)
- Table 15.57 RNA Sequencing Services Market, 2022 and 2035: Distribution by Type of Application
- Table 15.58 RNA Sequencing Services Market for Research Purposes, Conservative, Base, and Optimistic Scenarios, Till 2035 (USD Billion)
- Table 15.59 RNA Sequencing Services Market for Diagnostic Purposes, Conservative, Base, and Optimistic Scenarios, Till 2035 (USD Billion)
- Table 15.60 RNA Sequencing Services Market, 2022 and 2035: Distribution by Type of End User
- Table 15.61 RNA Sequencing Services Market for Academic and Research Industry, Conservative, Base, and Optimistic Scenarios, Till 2035 (USD Billion)
- Table 15.62 RNA Sequencing Services Market for Clinics and Hospitals, Conservative, Base, and Optimistic Scenarios, Till 2035 (USD Billion)
- Table 15.63 RNA Sequencing Services Market for Pharmaceutical Industry, Conservative, Base, and Optimistic Scenarios, Till 2035 (USD Billion)
- Table 15.64 RNA Sequencing Services Market for Other Users, Conservative, Base, and Optimistic Scenarios, Till 2035 (USD Billion)
- Table 15.65 RNA Sequencing Services Market, 2022 and 2035: Distribution by Key Geographical Regions
- Table 15.66 RNA Sequencing Services Market in North America, Conservative, Base, and Optimistic Scenarios, Till 2035 (USD Billion)
- Table 15.67 RNA Sequencing Services Market in Europe, Conservative, Base, and Optimistic Scenarios, Till 2035 (USD Billion)
- Table 15.68 RNA Sequencing Services Market in Asia-Pacific, Conservative, Base, and Optimistic Scenarios, Till 2035 (USD Billion)
- Table 15.69 RNA Sequencing Services Market in Latin America, Conservative, Base, and Optimistic Scenarios, Till 2035 (USD Billion)
- Table 15.70 RNA Sequencing Services Market in Middle East and North Africa, Conservative, Base, and Optimistic Scenarios, Till 2035 (USD Billion)
List of Figures
- Figure 3.1 Key Steps Involved in RNA Sequencing
- Figure 4.1 RNA Sequencing Service Providers: Distribution by Year of Establishment
- Figure 4.2 RNA Sequencing Service Providers: Distribution by Company Size
- Figure 4.3 RNA Sequencing Service Providers: Distribution by Location of Headquarters (Region Wise)
- Figure 4.4 RNA Sequencing Service Providers: Distribution by Location of Headquarters (Country Wise)
- Figure 4.5 RNA Sequencing Service Providers: Distribution by Company Size and Region of Headquarters
- Figure 4.6 RNA Sequencing Service Providers: Distribution by Type of RNA Sequencing Service(s) Offered
- Figure 4.7 RNA Sequencing Service Providers: Distribution by Platform
- Figure 4.8 RNA Sequencing Service Providers: Distribution by Type of RNA Sequencing Service(s) and Type of Platform
- Figure 4.9 RNA Sequencing Service Providers: Distribution by Turnaround Time
- Figure 4.10 RNA Sequencing Service Providers: Distribution by Type of Sample
- Figure 4.11 RNA Sequencing Service Providers: Distribution by Type of RNA Sequencing Services(s) and Type of Sample
- Figure 4.12 RNA Sequencing Service Providers: Distribution by Amount of Sample (in mg)
- Figure 4.13 RNA Sequencing Service Providers: Distribution by Type of RNA Sequencing Services(s) and Amount of Sample
- Figure 5.1 Company Competitiveness Analysis: RNA Sequencing Service Providers in North America
- Figure 5.2 Company Competitiveness Analysis: RNA Sequencing Service Providers in Europe
- Figure 5.3 Company Competitiveness Analysis: RNA Sequencing Service Providers in Asia-Pacific
- Figure 7.1 Grant Analysis: Cumulative Year-Wise Trend, 2017-2022
- Figure 7.2 Grant Analysis: Distribution by Amount Awarded (USD Million)
- Figure 7.3 Grant Analysis: Distribution by Administering Institute Centre
- Figure 7.4 Grant Analysis: Distribution by Support Period
- Figure 7.5 Grant Analysis: Distribution by Administering Institute Centre and Support Period
- Figure 7.6 Grant Analysis: Distribution by Type of Grant Application
- Figure 7.7 Grant Analysis: Distribution by Purpose of Grant Award
- Figure 7.8 Grant Analysis: Distribution of Amount Awarded by Purpose of Grant (USD Million)
- Figure 7.9 Grant Analysis: Distribution by Activity Code
- Figure 7.10 Grant Analysis: Distribution by Study Section Involved
- Figure 7.11 Grant Analysis: Distribution by Type of Organization
- Figure 7.12 Most Popular Departments: Distribution by Number of Grants
- Figure 7.13 Word Cloud: Emerging Focus Areas
- Figure 7.14 Prominent Program Officers: Distribution by Number of Grants
- Figure 7.15 Popular Recipient Organizations: Distribution by Number of Grants
- Figure 7.16 Popular Recipient Organization: Distribution by Amount Awarded (USD Million)
- Figure 7.17 Grant Analysis: Distribution of Recipient Organizations located in US
- Figure 8.1 Patent Analysis: Distribution by Type of Patent
- Figure 8.2 Patent Analysis: Cumulative Distribution by Publication Year, 2018-2022
- Figure 8.3 Patent Analysis: Cumulative Distribution by Application Year, Pre-2016 - 2022
- Figure 8.4 Patent Analysis: Distribution by Annual Number of Granted Patents and Patent Applications, 2018-2022
- Figure 8.5 Patent Analysis: Distribution by Geography
- Figure 8.6 Patent Analysis: Distribution by CPC Symbols
- Figure 8.7 Word Cloud: Emerging Focus Areas
- Figure 8.8 Patent Analysis: Cumulative Year-wise Distribution by Type of Applicant
- Figure 8.9 Leading Industry Players: Distribution by Number of Patents
- Figure 8.10 Leading Non-Industry Players: Distribution by Number of Patents
- Figure 8.11 Patent Analysis: Leading Individual Assignees
- Figure 8.12 Leading Industry Players: Benchmarking by Patent Characteristics (CPC Symbols)
- Figure 8.13 Patent Analysis: Distribution by Patent Age
- Figure 8.14 Patent Valuation Analysis
- Figure 9.1 Porter's Five Forces: Key Parameters
- Figure 9.2 Porter's Five Forces: Harvey Ball Analysis
- Figure 10.1 NGS Library Preparation Kits: Distribution by Type of Platform
- Figure 10.2 NGS Library Preparation Kits: Distribution by Amount of Sample
- Figure 10.3 NGS Library Preparation Kits: Distribution by Turnaround Time
- Figure 10.4 NGS Library Preparation Kits: Distribution by Storage Temperature
- Figure 10.5 NGS Library Preparation Kits: Distribution by Type of Sequencing
- Figure 10.6 NGS Library Preparation Kits: Distribution by Kit Components
- Figure 10.7 NGS Library Preparation Kits: Distribution by Type of Sample
- Figure 10.8 NGS Library Preparation Kit Providers: Distribution by Year of Establishment
- Figure 10.9 NGS Library Preparation Kit Providers: Distribution by Company Size
- Figure 10.10 NGS Library Preparation Kit Providers: Distribution by Location of Headquarters
- Figure 11.1 Likely Profit Potential of iSeq platform
- Figure 11.2 Likely Profit Potential of MiSeq platform
- Figure 11.3 Likely Profit Potential of NextSeq 550 Series platform
- Figure 11.4 Likely Profit Potential of NextSeq 1000 platform
- Figure 11.5 Likely Profit Potential of NextSeq 2000 platform
- Figure 11.6 Likely Profit Potential of Sequel platform
- Figure 11.7 Likely Profit Potential of Sequel II platform
- Figure 11.8 Likely Profit Potential of Sequel IIe platform
- Figure 11.9 Payback Evaluation Matrix
- Figure 12.1 Global RNA Sequencing Services Market, Till 2035 (USD Billion)
- Figure 12.2 RNA Sequencing Services Market, 2022 and 2035: Distribution by Type of Sequencing Method
- Figure 12.3 RNA Sequencing Services Market for Next Generation Sequencing Method, Till 2035 (USD Billion)
- Figure 12.4 RNA Sequencing Services Market for Other Method, Till 2035 (USD Billion)
- Figure 12.5 RNA Sequencing Services Market, 2022 and 2035: Distribution by Type of Application
- Figure 12.6 RNA Sequencing Services Market for Research Purposes, Till 2035 (USD Billion)
- Figure 12.7 RNA Sequencing Services Market for Diagnostic Purposes, Till 2035 (USD Billion)
- Figure 12.8 RNA Sequencing Services Market, 2022 and 2035: Distribution by Type of End User
- Figure 12.9 RNA Sequencing Services Market for Academic and Research Industry, Till 2035 (USD Billion)
- Figure 12.10 RNA Sequencing Services Market for Clinics and Hospitals, Till 2035 (USD Billion)
- Figure 12.11 RNA Sequencing Services Market for Pharmaceutical Industry, Till 2035 (USD Billion)
- Figure 12.12 RNA Sequencing Services Market for Other Users, Till 2035 (USD Billion)
- Figure 12.13 RNA Sequencing Services Market, 2022 and 2035: Distribution by Key Geographical Regions
- Figure 12.14 RNA Sequencing Services Market in North America, Till 2035 (USD Billion)
- Figure 12.15 RNA Sequencing Services Market in Europe, Till 2035 (USD Billion)
- Figure 12.16 RNA Sequencing Services Market in Asia-Pacific, Till 2035 (USD Billion)
- Figure 12.17 RNA Sequencing Services Market in Latin America, Till 2035 (USD Billion)
- Figure 12.18 RNA Sequencing Services Market in Middle East and North Africa, Till 2035 (USD Billion)
 短读定序市场:依产品、技术、最终用户和应用划分-2026-2032年全球市场预测RNA分析/转录组学市场:依产品、技术和应用划分-2026-2032年全球市场预测
 2026年短读定定序全球市场报告
 短读定序市场-全球产业规模、份额、趋势、机会及预测(依产品、应用、最终用户、地区及竞争格局划分,2021-2031年)
 转录组定序市场:依产品/服务、技术、应用和最终用户划分-全球预测至2035年
 全球标靶DNA和RNA定序市场:市场规模、份额和趋势分析(按工作流程、技术、应用、类型、最终用途和地区划分),细分市场预测(2025-2033年)
 标靶RNA定序:全球市场份额和排名、总收入和需求预测(2025-2031年)2025年全球RNA定序服务市场报告2025年全球核糖核酸(RNA定序)市场报告
 全球标靶 DNA RNA定序市场